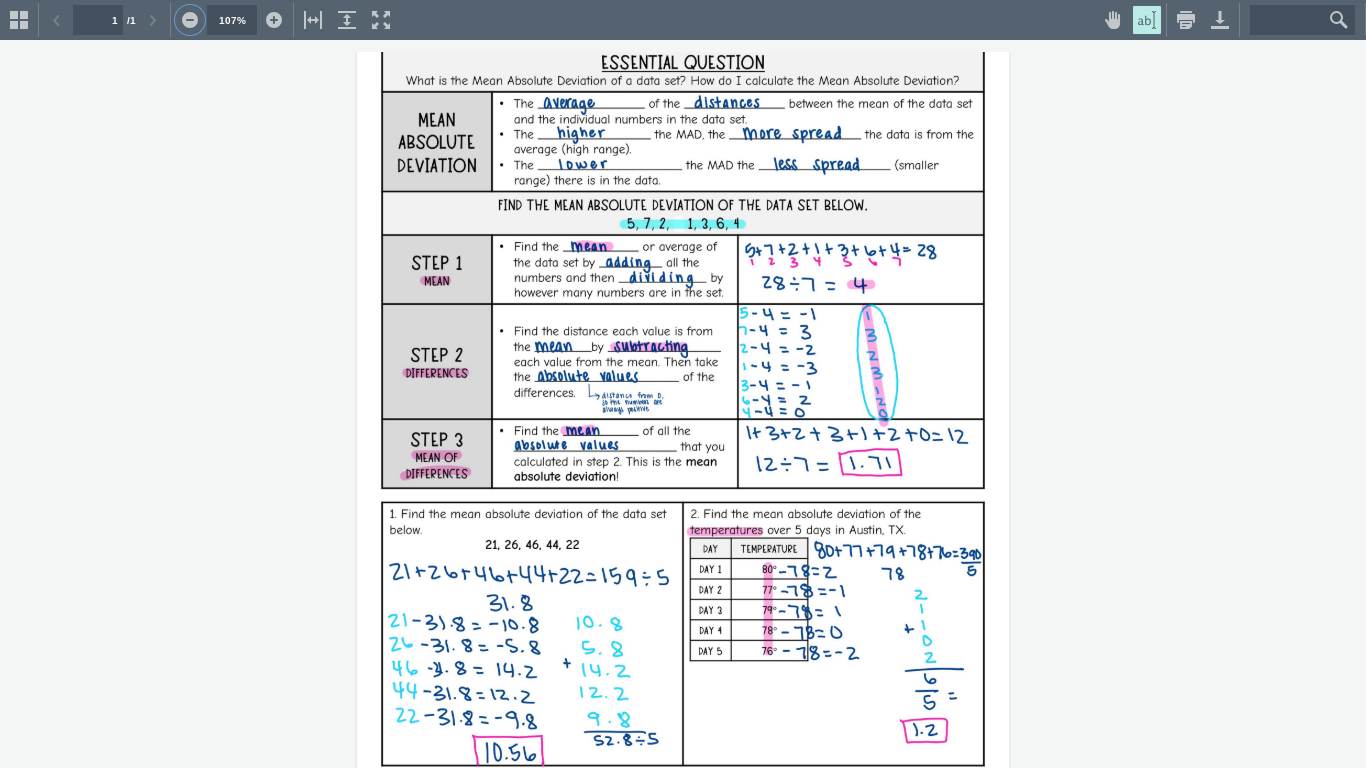
middle school statistics
Mean: The average of a set of numbers, calculated by adding them all together and dividing by the total count.
Median: The middle value in a list of numbers, which separates the higher half from the lower half.
Mode: The number that appears most frequently in a data set. Range: The difference between the highest and lowest values in a data set, providing insight into the spread of the numbers. Variance: A measure of how far each number in the set is from the mean, indicating the degree of spread in the data. Standard Deviation: A statistic that quantifies the amount of variation or dispersion in a set of values, calculated as the square root of the variance, allowing for a better understanding of how spread out the numbers are.
Key Concepts in Middle School Statistics
1. Mean, Median, and Mode
Mean (Average): The sum of all the numbers divided by the number of values.
Example: For the numbers 2, 3, 5, and 8: Mean = (2 + 3 + 5 + 8) / 4 = 4.5
Median: The middle number in a sorted list of numbers.
Example: For the numbers 2, 3, 5, and 8: Median = (3 + 5) / 2 = 4
Mode: The number that appears most frequently in a set.
Example: For the numbers 2, 3, 3, 5, and 8: Mode = 3
2. Range
The difference between the highest and lowest values in a set.
Example: For the numbers 2, 3, 5, and 8: Range = 8 - 2 = 6
3. Interpreting Data
Understanding and making sense of data presented in various forms like graphs, charts, and tables.
Bar Graphs: Used to compare different groups.
Line Graphs: Show trends over time.
Pie Charts: Represent parts of a whole.
4. Probability
The likelihood or chance of an event occurring.
Example: The probability of flipping a coin and getting heads is 1/2 or 50%.
5. Histograms
A type of bar graph that shows the frequency of data within equal intervals.
Example: If you have test scores grouped into ranges (70-79, 80-89, etc.), a histogram can show how many scores fall into each range.
6. Box-and-Whisker Plots
A graphical representation of data that shows the distribution, quartiles, and outliers.
Median (Q2): The middle value.
Lower Quartile (Q1): The median of the lower half of the data.
Upper Quartile (Q3): The median of the upper half of the data.
Interquartile Range (IQR): The difference between Q3 and Q1.
7. Scatter Plots
Graphs that show the relationship between two sets of data.
Example: A scatter plot can show the correlation between hours studied and test scores.