Chapter 5: Organizational Costing and Profit Analysis
Managerial vs. Financial Accounting:
Financial accounting:
Uses organizational (aggregate) data.
Designed for use by external parties.
Primarily historical.
Must adhere to external standards (GAAP).
Managerial accounting:
Uses organizational and subunit data.
Designed for use by managers.
Primarily forward looking.
Does not adhere to external standards
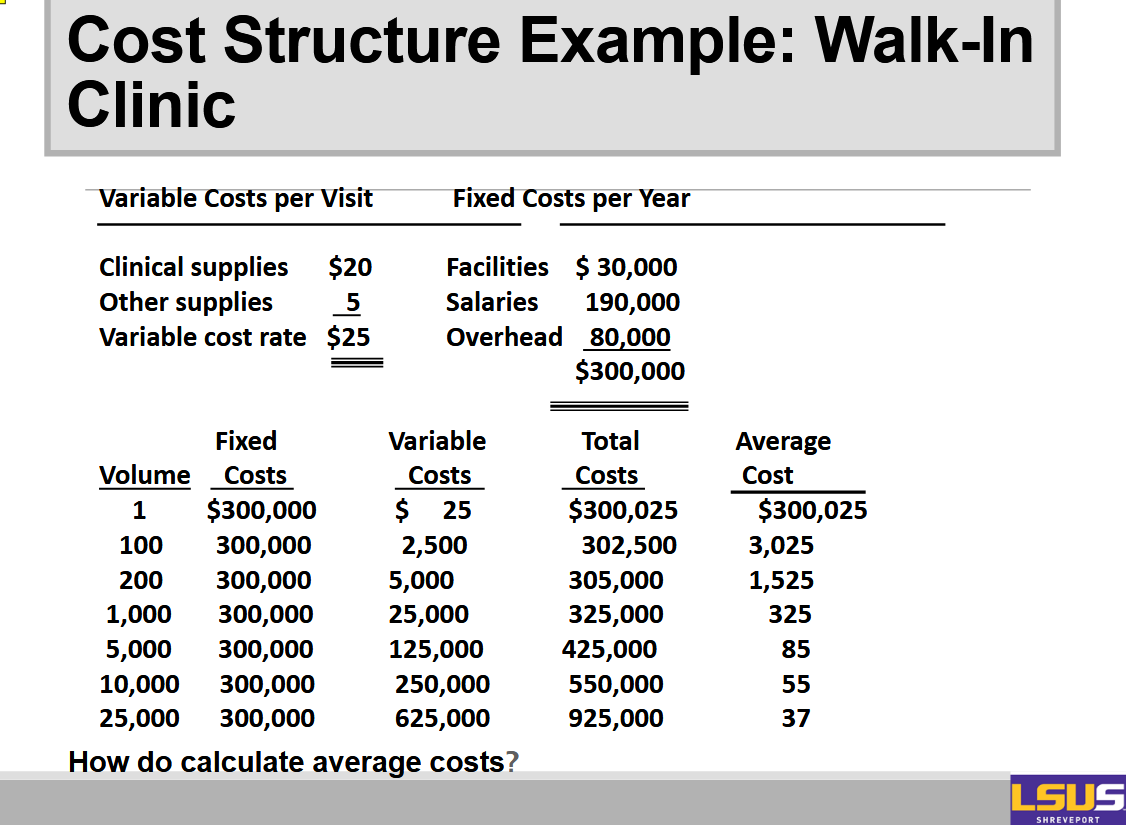
Fixed vs. Variable Costs:
Underlying cost structure:
The relationship between costs and the volume of services provided.
Can be used to forecast costs at different levels of patient volume.
Costs may be:
Fixed- independent of volume.
Variable- depend on volume.
Semi-fixed- partially depend on volume.
Two Ground Rules:
In the long run, all costs are variable.
Cost classifications hold only in the short run, say, for one year.
No costs are fixed throughout an infinite range of volumes.
The concept of cost classifications according to volume must be applied within some relevant range of patient volume.
Examples of fixed and variable costs, say, for a hospital’s clinical laboratory:
Fixed:
Salaries of full-time staff (e.g., lab manager, administrative staff).
Equipment depreciation (e.g., analyzers, centrifuges).
Facility costs (e.g., rent or mortgage for lab space).
Licensing and accreditation fees.
Utility base charges (e.g., fixed portion of electricity/water).
Maintenance contracts on lab equipment.
Variable:
Reagents and testing supplies (e.g., test kits, pipettes, slides).
Disposable items (e.g., gloves, syringes, specimen cups).
Contract/part-time labor (e.g., temp techs hired during high volume).
Shipping costs for off-site testing.
Lab report printing and mailing.
Waste disposal costs (which can increase with higher volume).
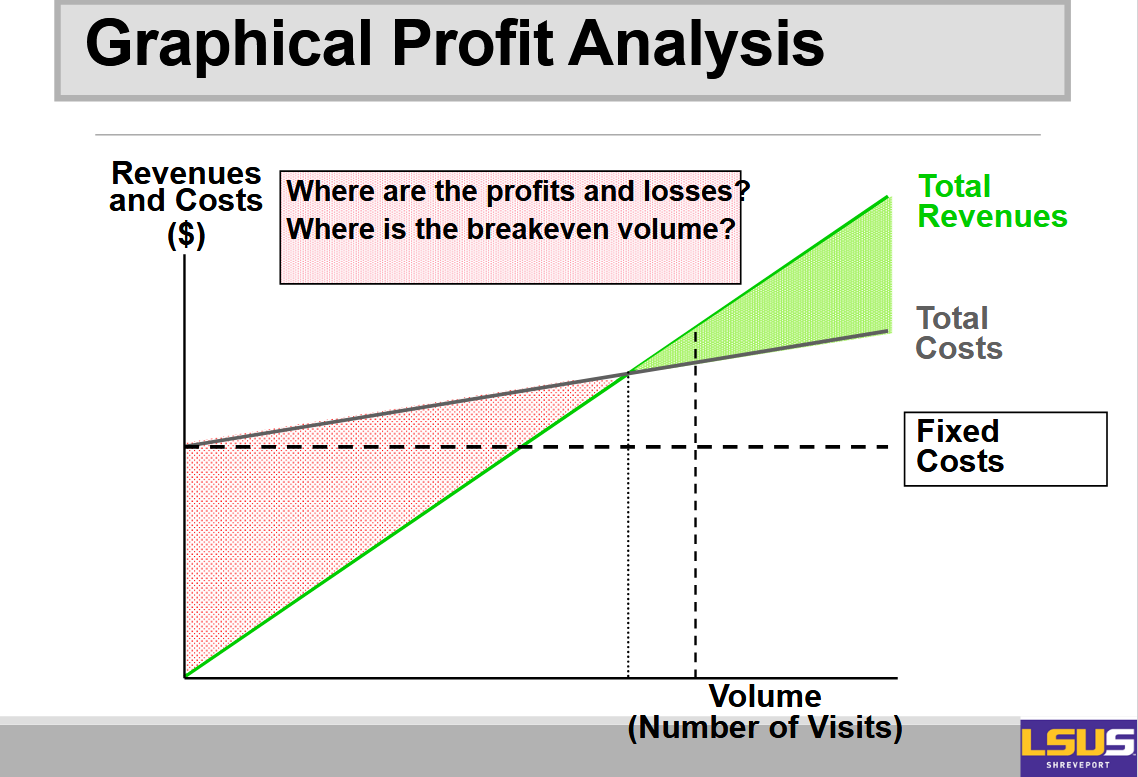
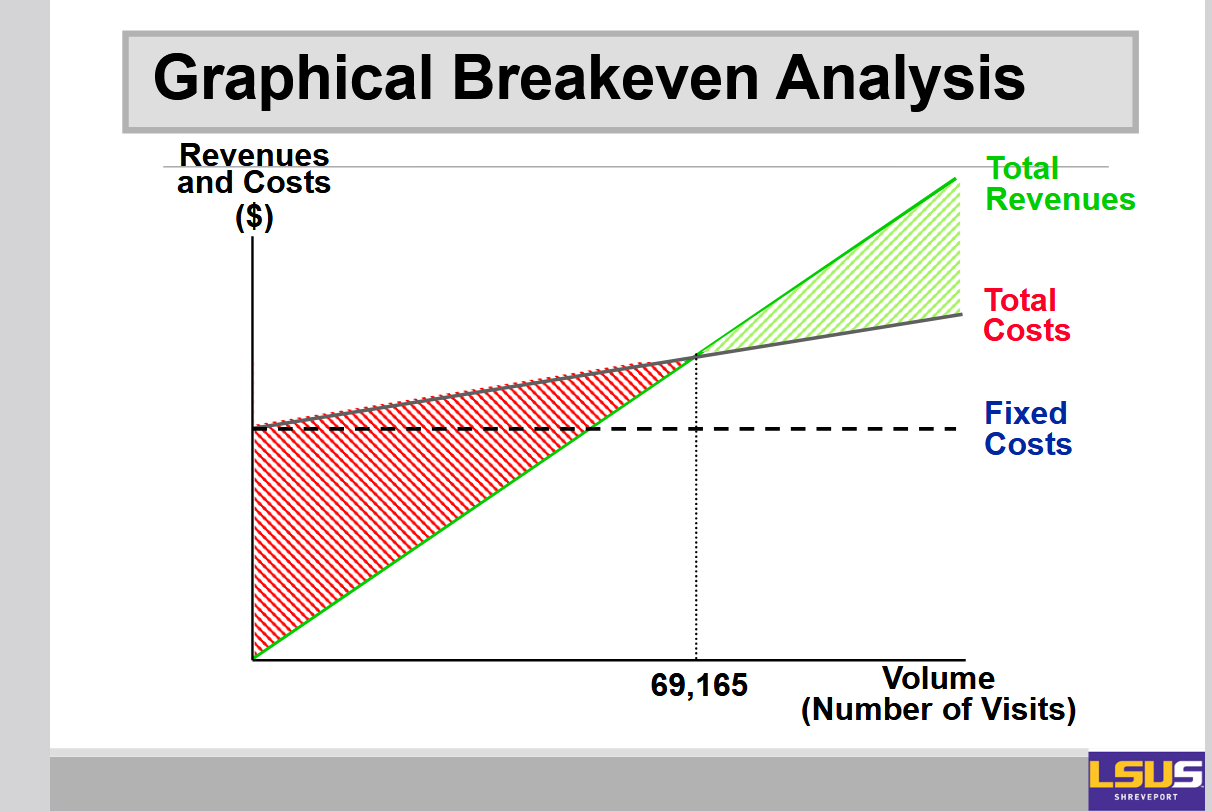
On the x-axis you have volume or number of visits, and on the y-axis you have cost. Then there are three lines. You have the total variable cost line, you have the fixed cost, and then you have the total cost line.
Profit (CVP) Analysis:
Profit analysis (Cost-volume- profit (CVP) analysis) - Technique to assess the effects of alternative volume assumptions on costs and profits.
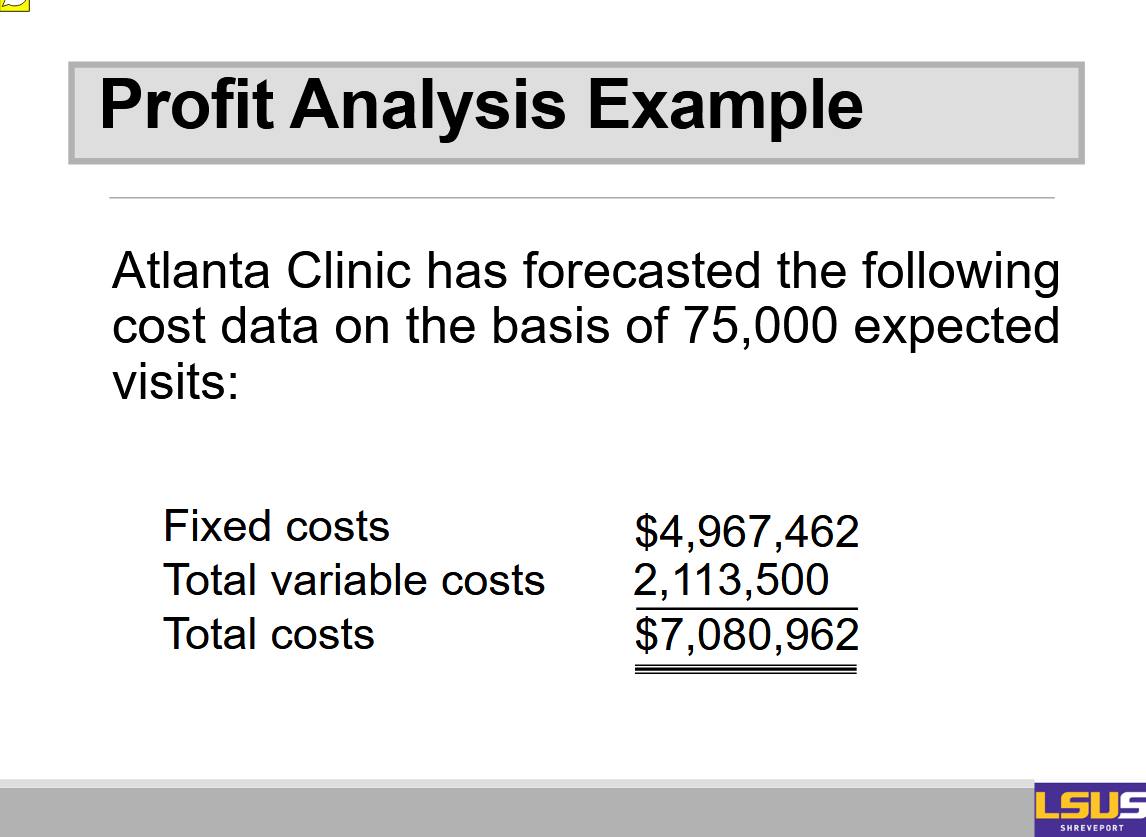
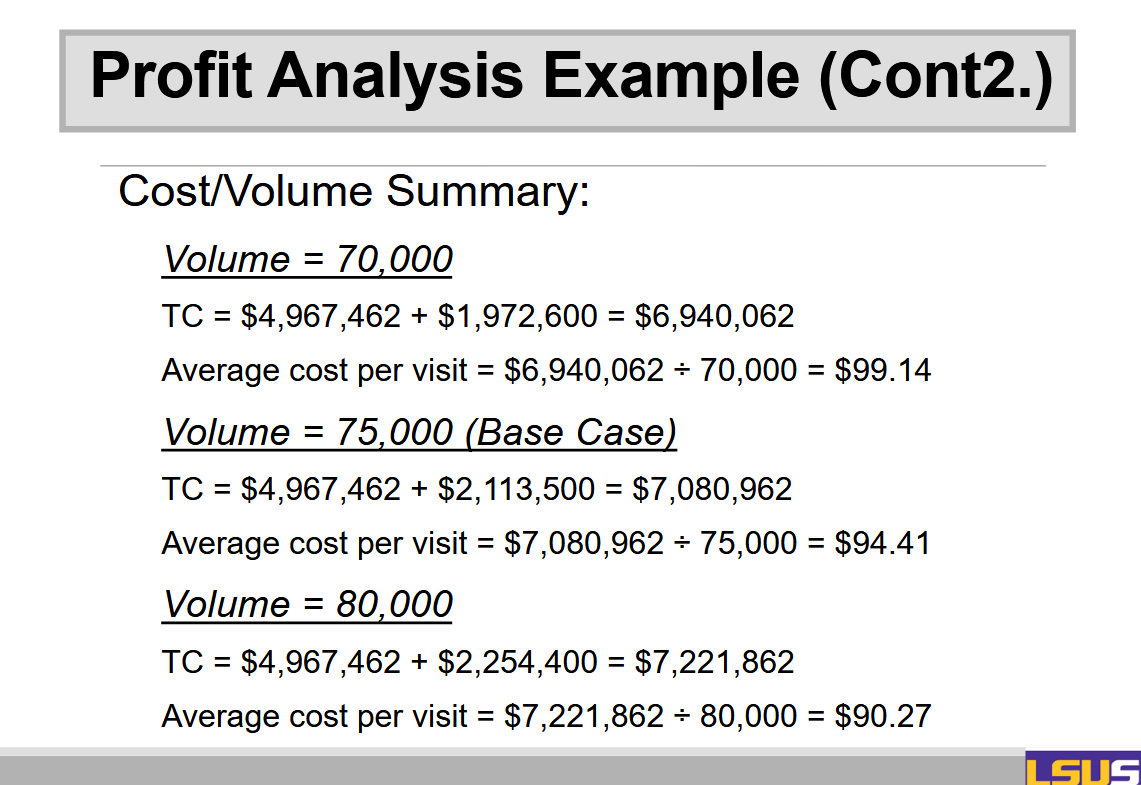
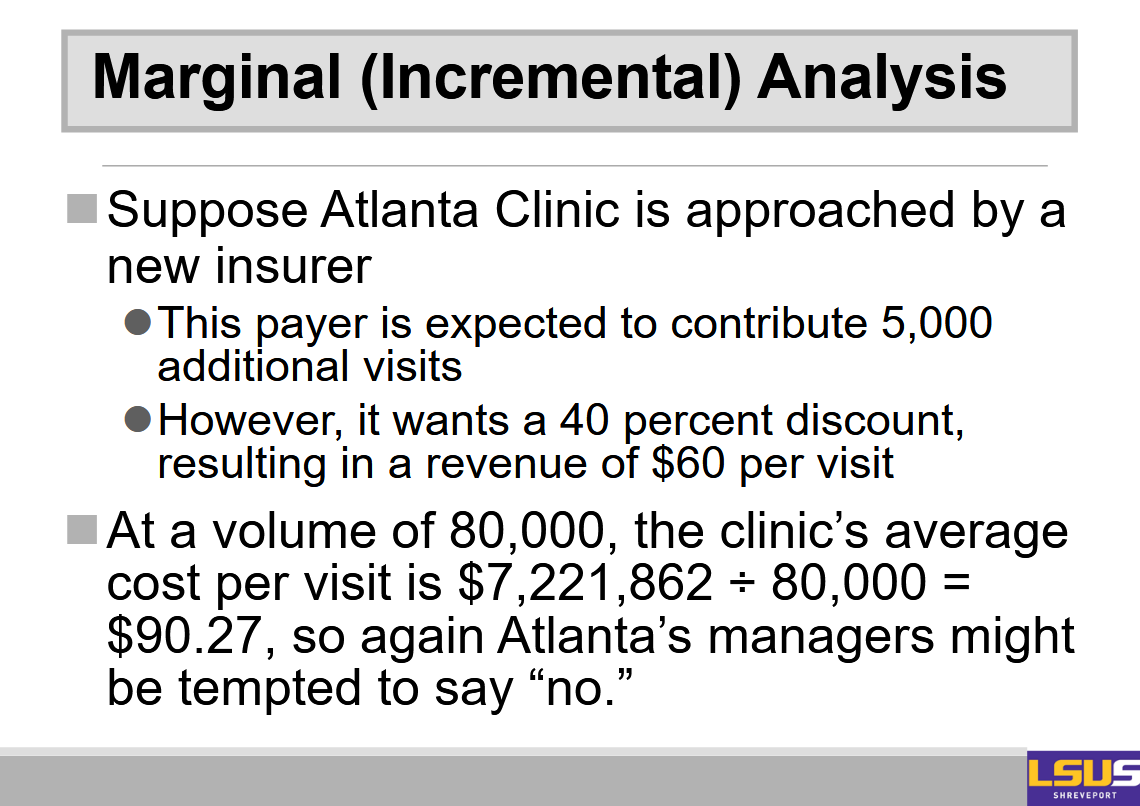
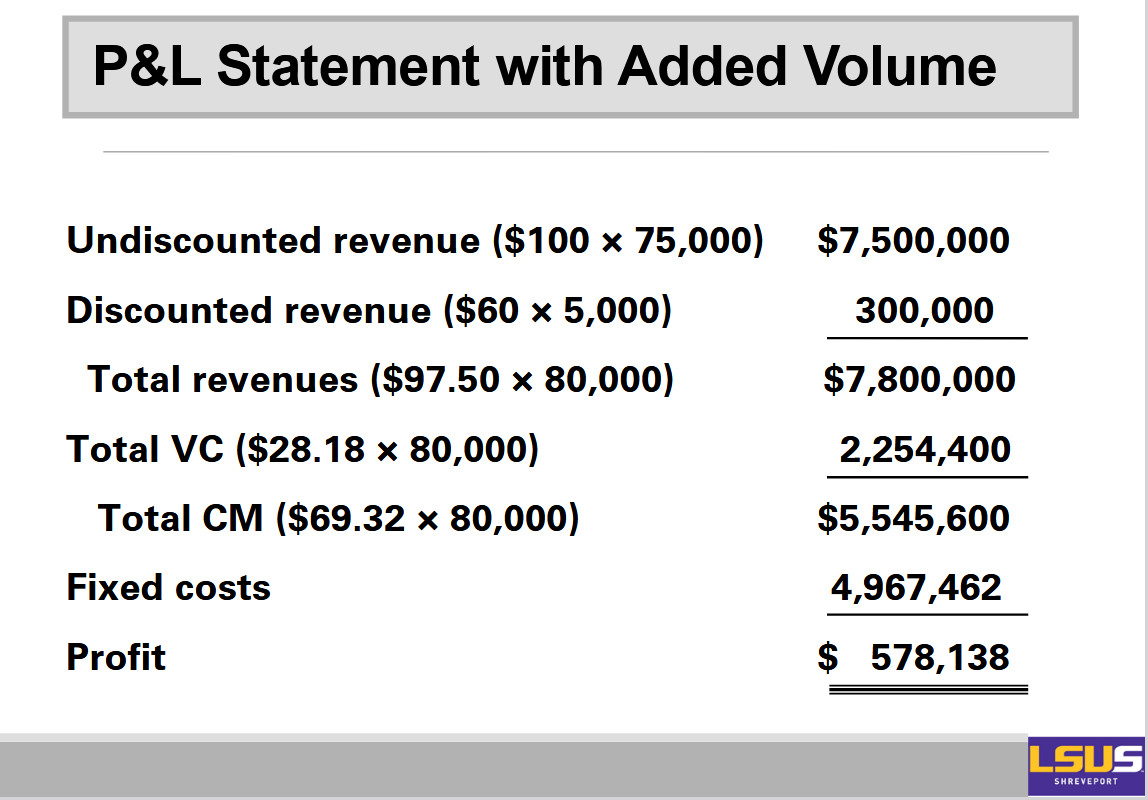
Profit Analysis Example (CONT3.):
When average cost per visit as volume increases the average cost per unit goes down. Primarily because we're able to spread the fixed costs over a larger volume of visits.
In economics this is referred to as economies of scale.
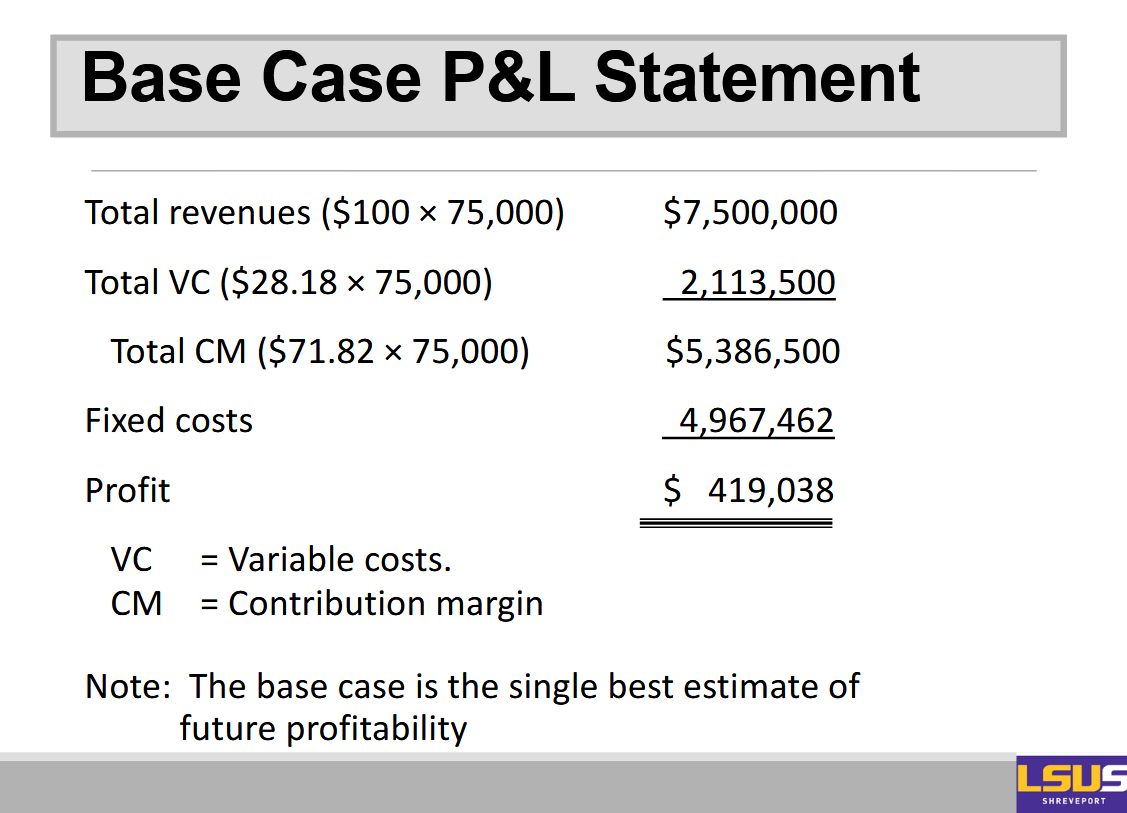
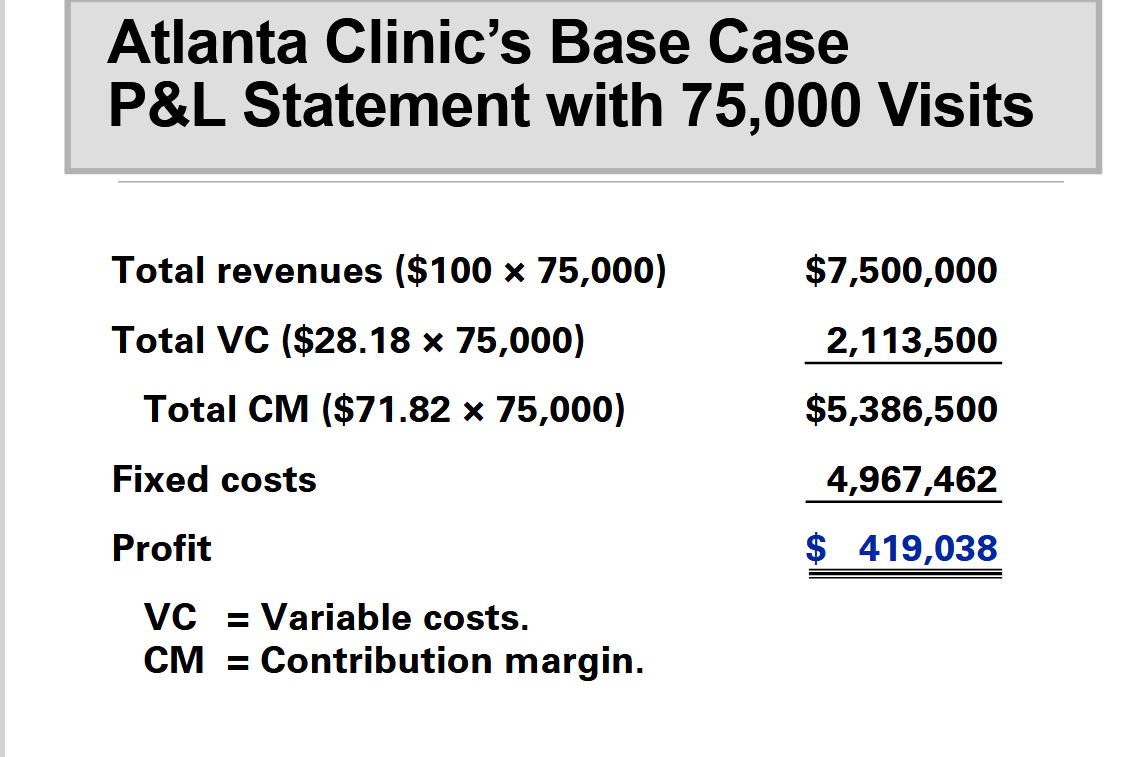
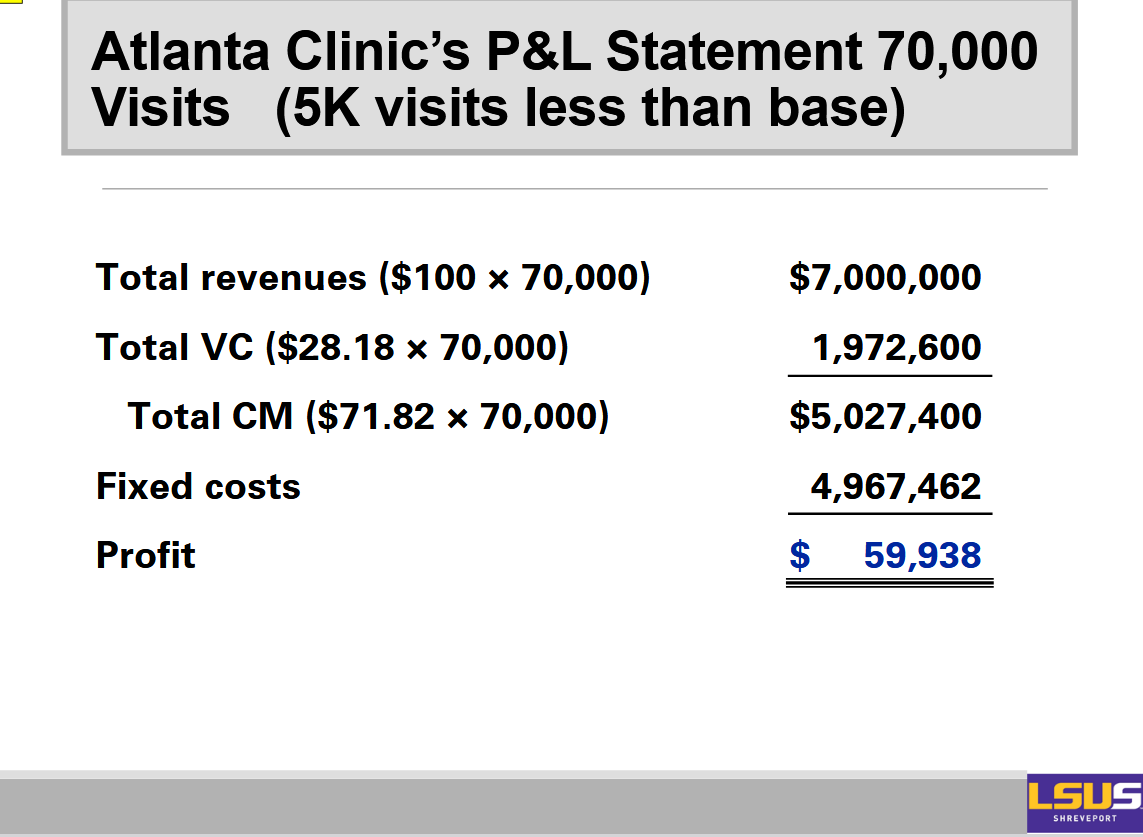
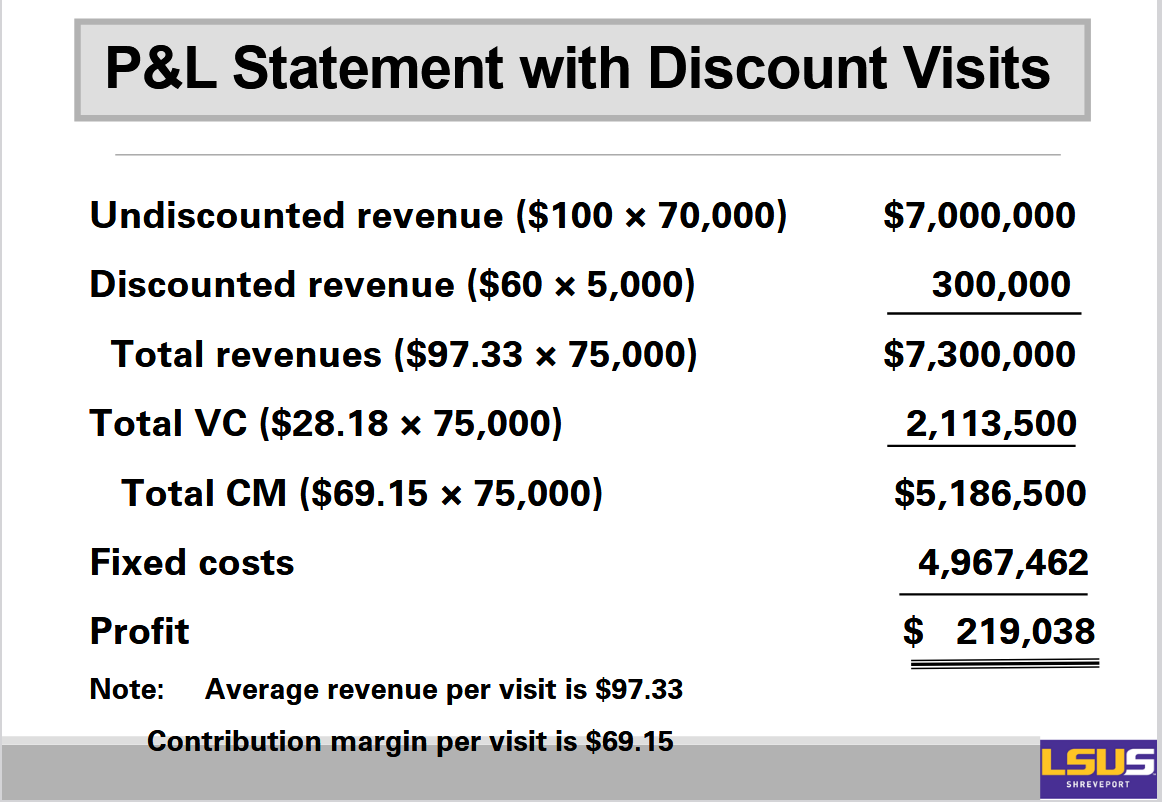
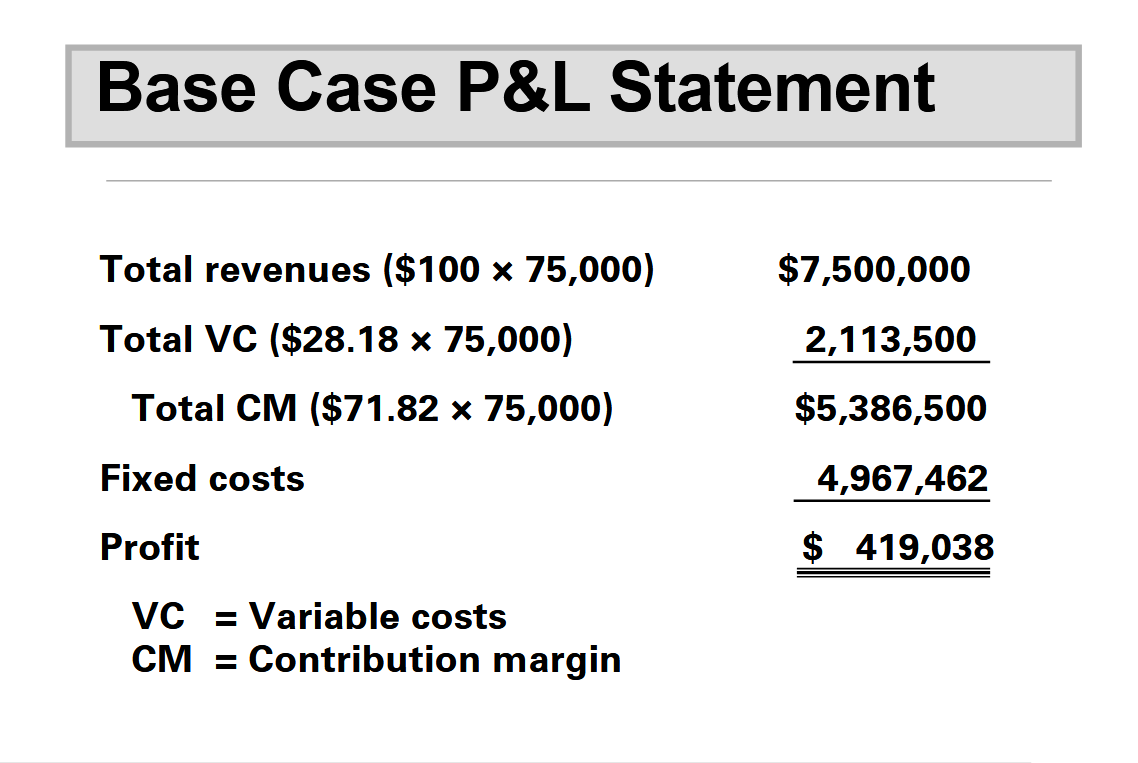
Forecasted (Projected) Profit and Loss (P&L) Statement:
P&L statement - Uses cost structure information, revenue forecast, and projected volume to forecast profitability.
Although it looks like an income statement, it does not have to follow financial
accounting guidelines (GAAP). Thus, different formats can be used for different purposes.
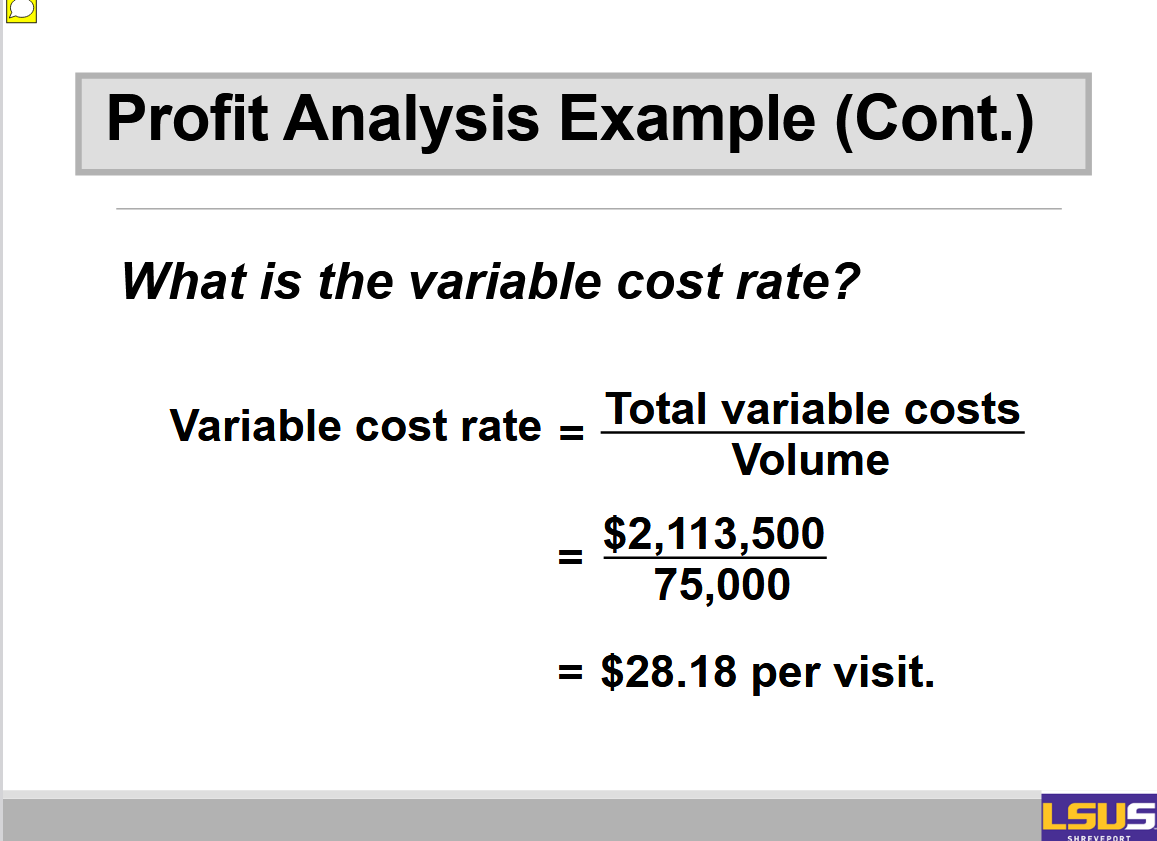
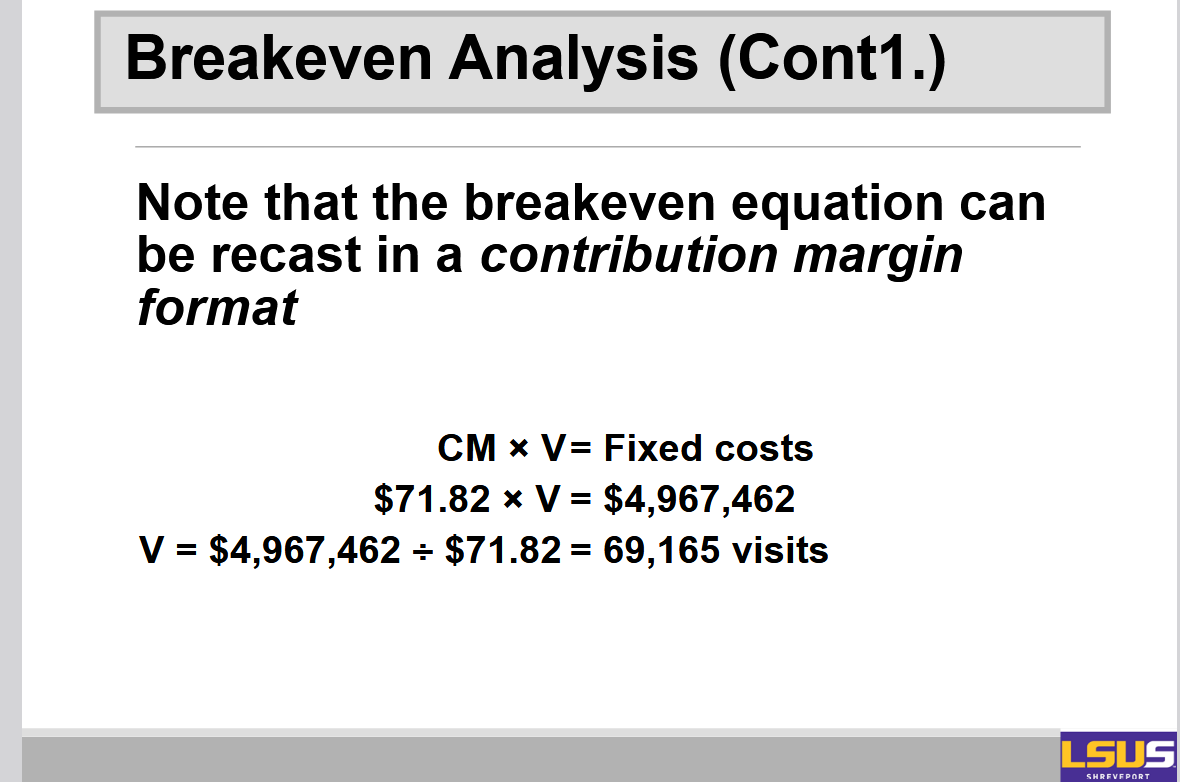
Contribution Margin:
The contribution margin - Difference between per visit (unit) revenue and the variable cost rate.
Amount of each visit’s revenue that is available to:
First cover fixed costs.
Flow to profit when fixed costs are covered.
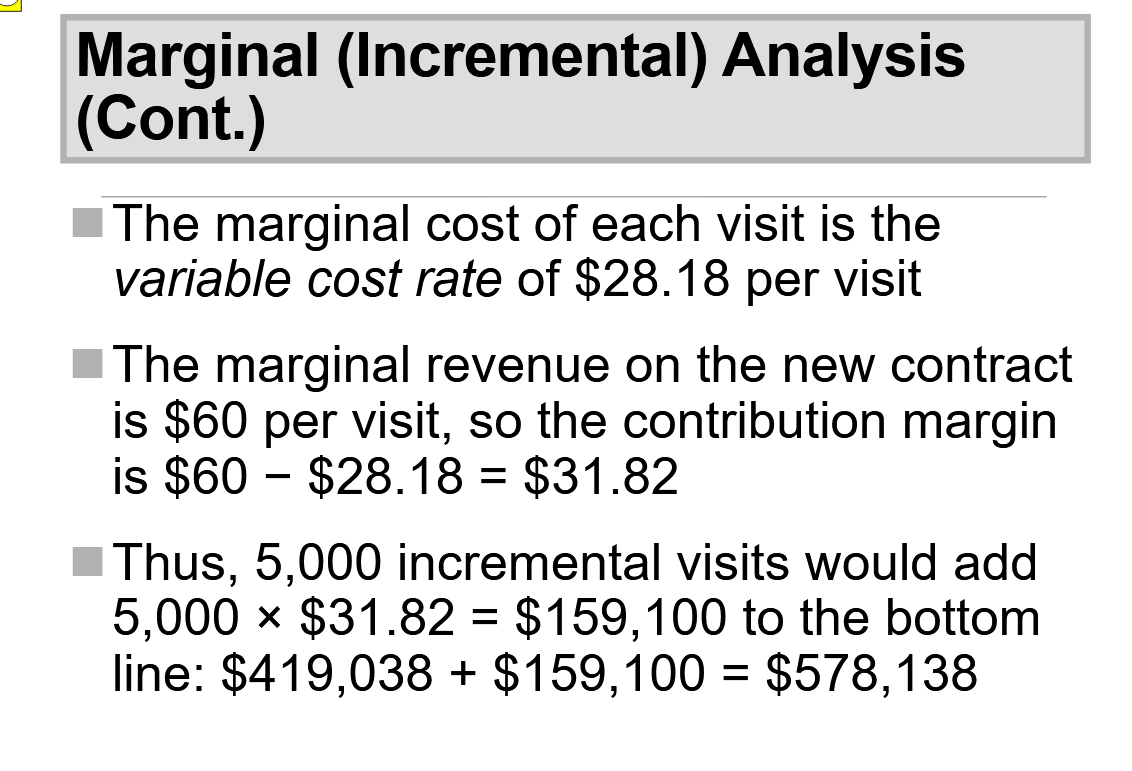
Example: In the case of the Atlanta clinic, the contribution margin is $100 − $28.18 = $71.82.
We calculated before the variable cost per visit, which is $28.18 and that give us that the contribution margin is $71.82.
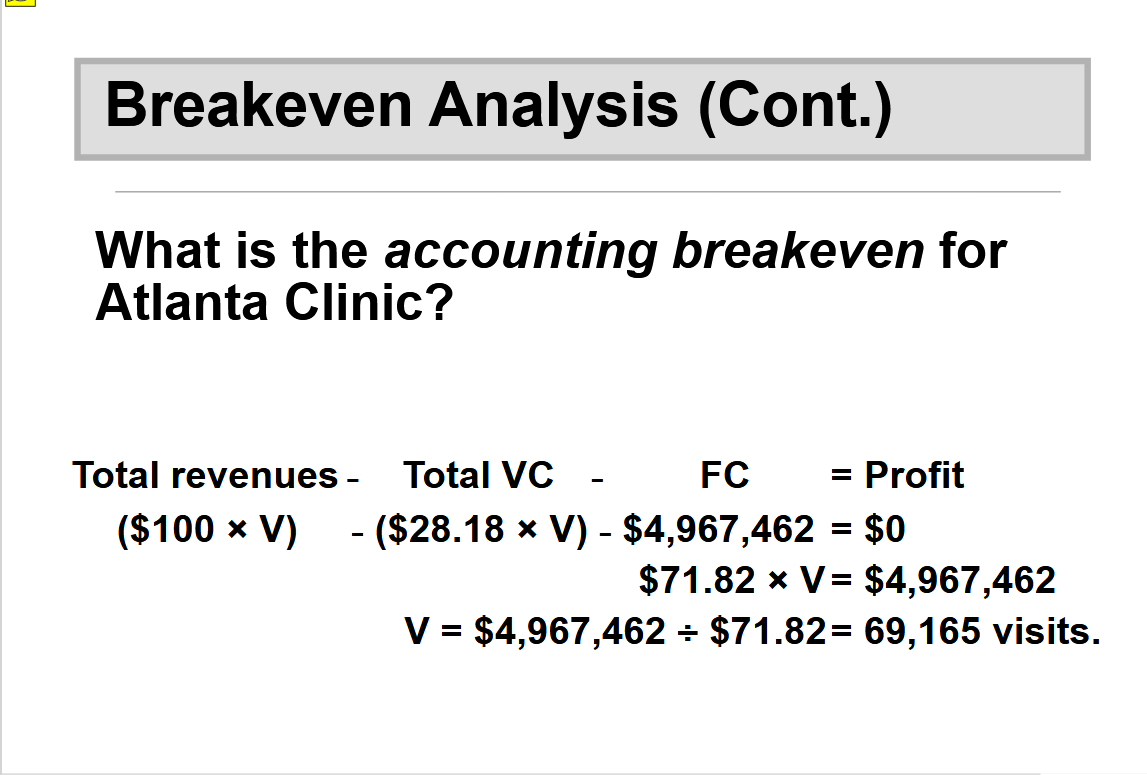
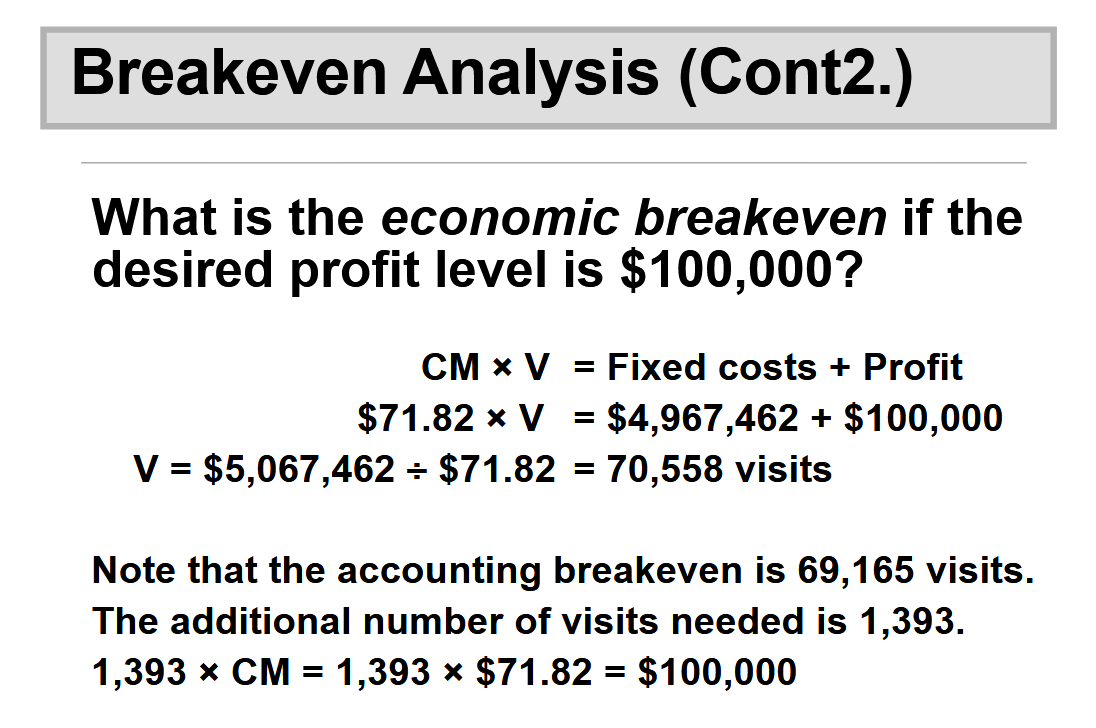
Breakeven Analysis:
Breakeven Analysis - The volume needed for an organization (or service or program) to be financially self-sufficient.
There are two types of breakeven:
Accounting breakeven (zero profit).
Economic breakeven (with profit).
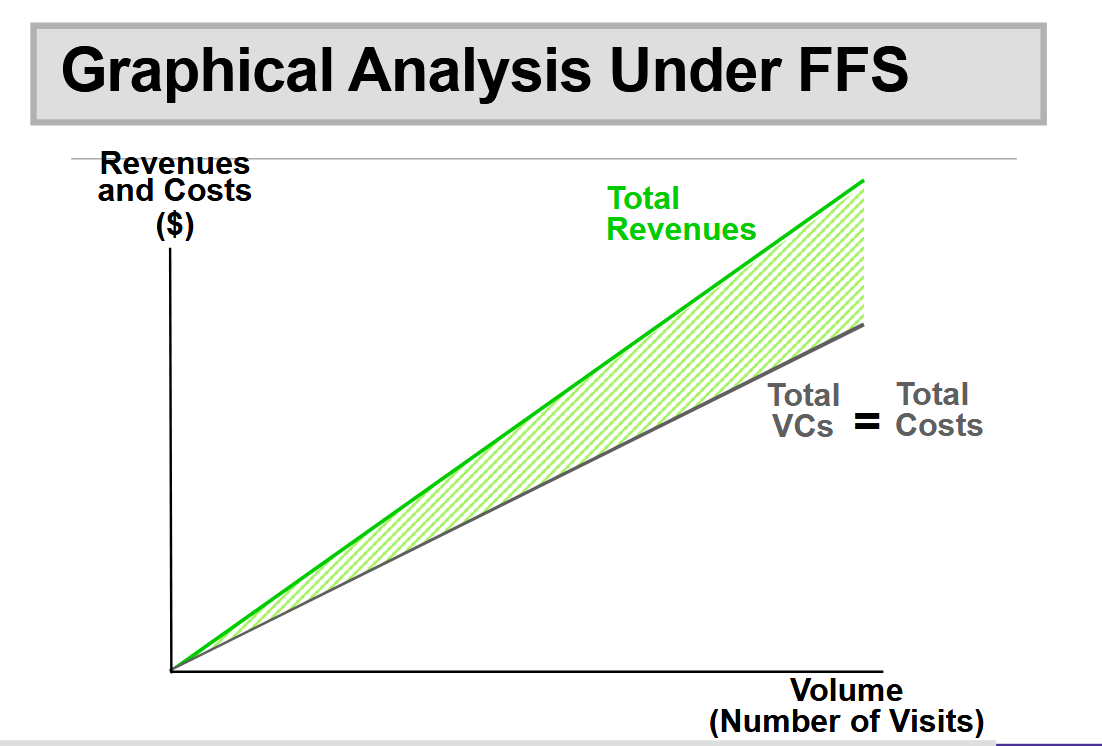
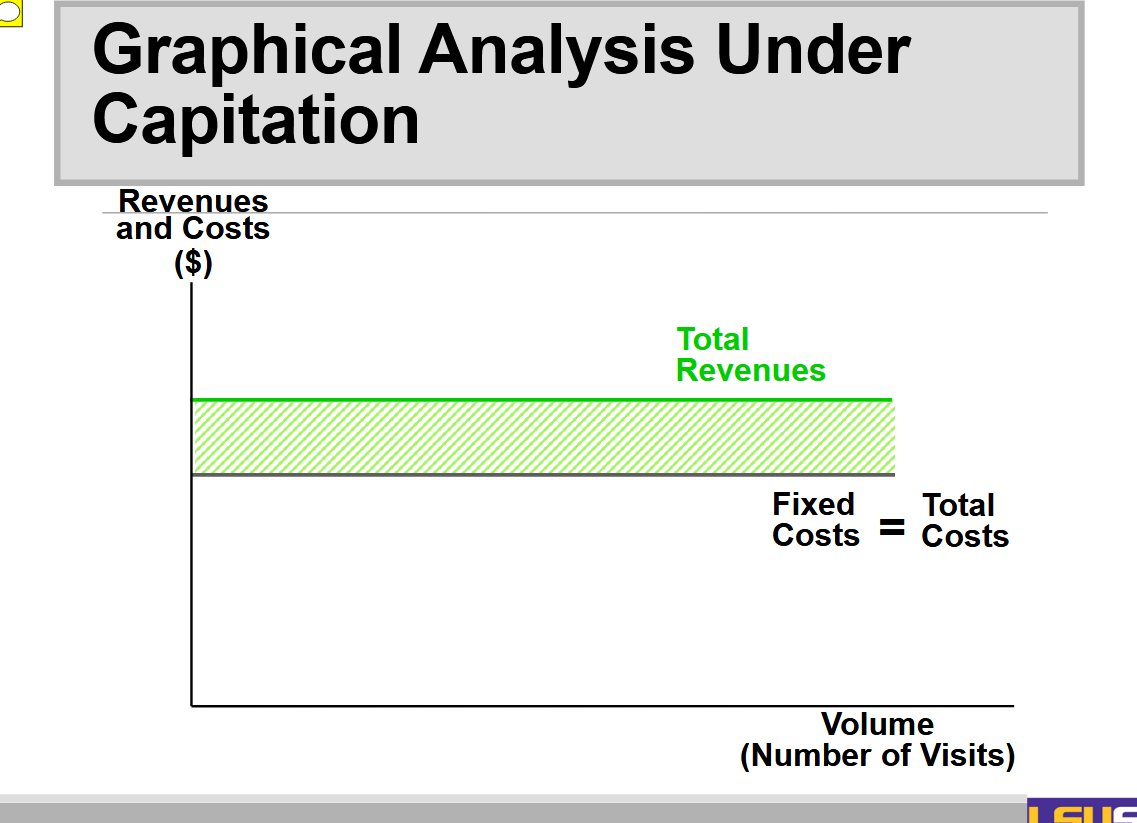
Profit Analysis Under Capitation:
Capitation changes the way in which profit analysis is conducted.
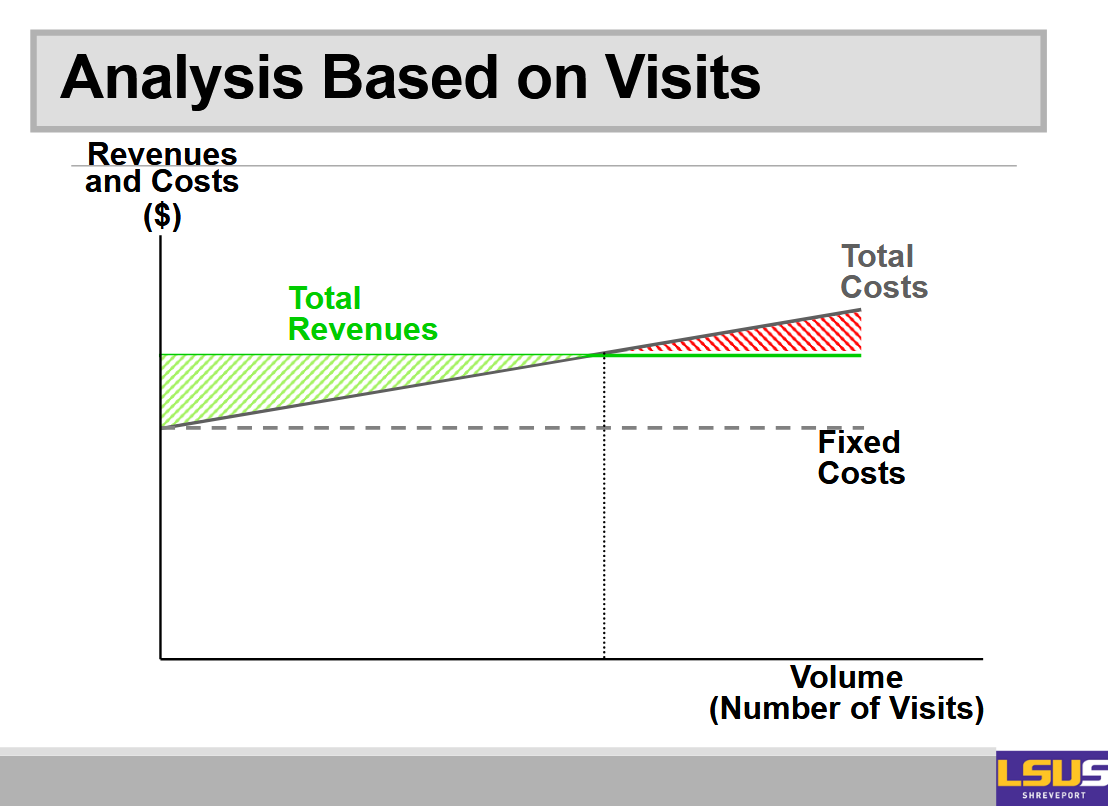
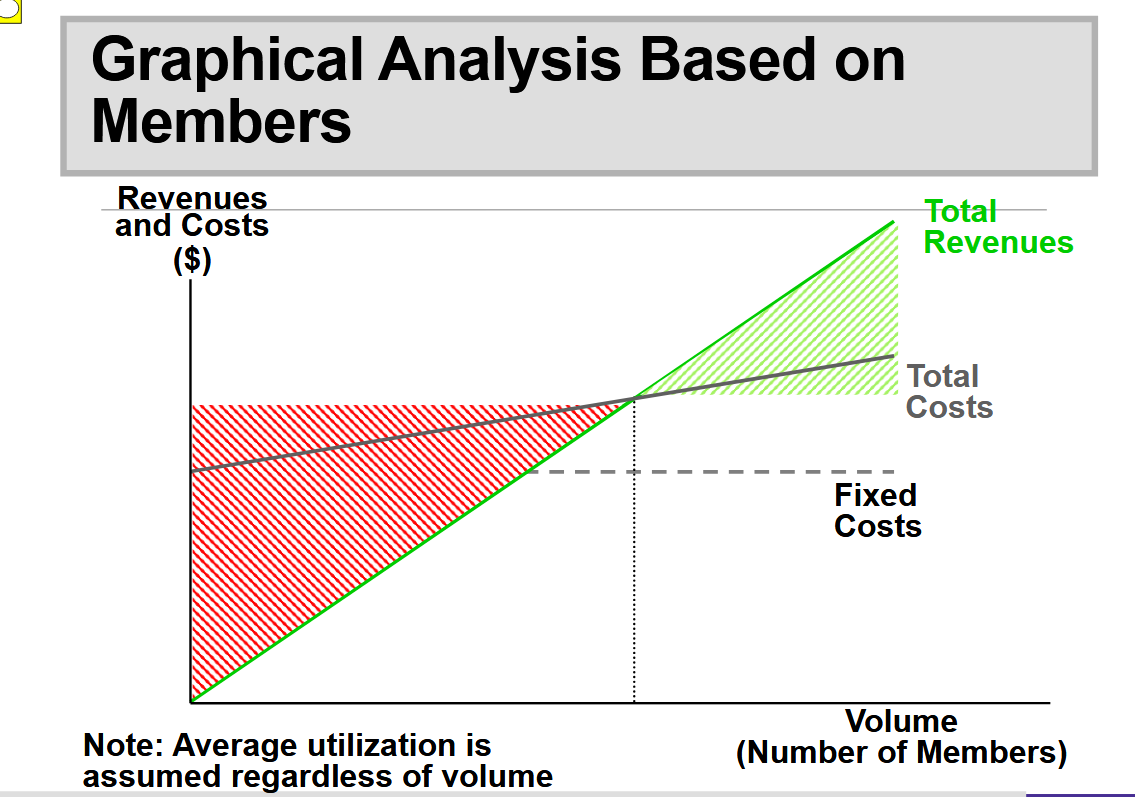
The best way to see the effects of capitation is by graphical analysis.
We will examine two approaches to graphical analysis:
In terms of utilization (number of visits).
In terms of membership (covered lives).
The Impact of Cost Structure on Risk:
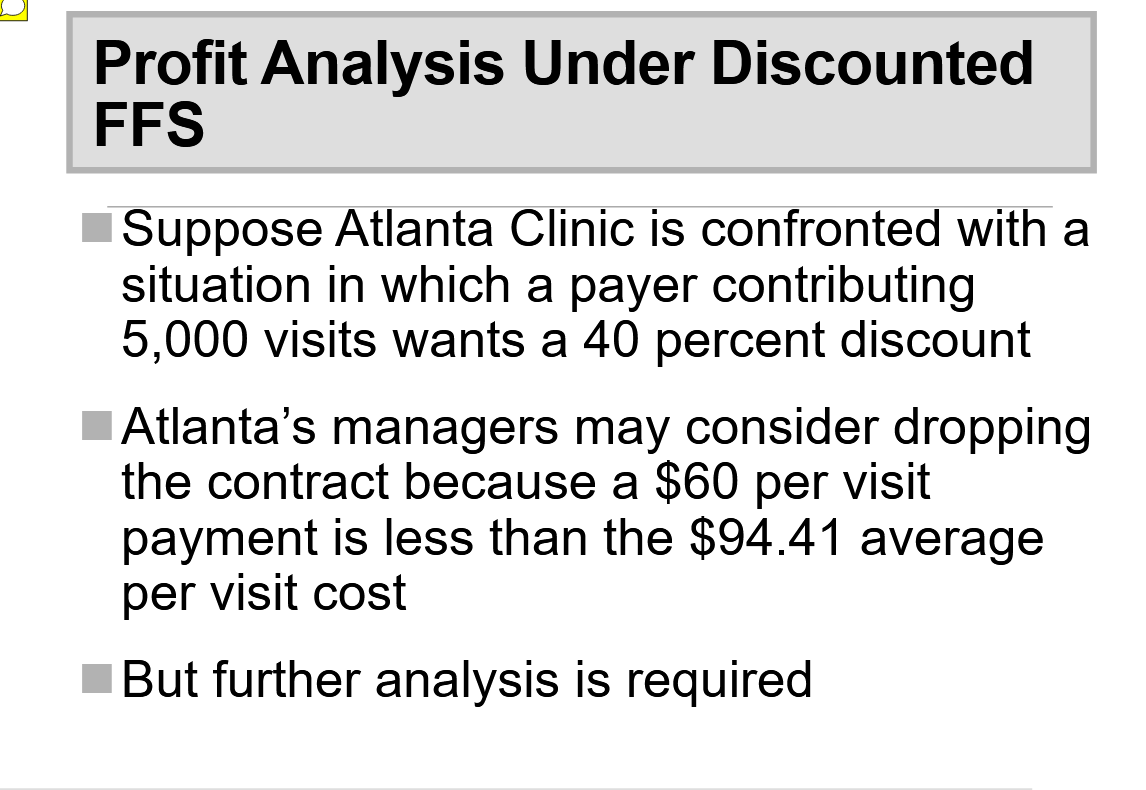
If reimbursement is tied exclusively to volume (FFS), then the provider’s financial risk is minimized if all costs are variable.
If reimbursement is exclusively capitated, then the provider’s financial risk is minimized if all costs are fixed.