Data Handling
two types of data research studies:
Quantitative data
Qualitative data
Quantitative data:
→ Primary data: data that has been collected firsthand from the source(participants) directly by the researchers.
→ Secondary data: data that has been already published & simply used by researchers in the own work.
Strengths | Weaknesses |
|
|
|
|
| - |
| - |
| - |
Qualitative and Quantitative are both research methods used for interviews and questionnaires in psychology.
Quantitative data is divided into two subgroups:
→ Primary data: data that has been collected firsthand from the source(participants) directly by the researchers.
→ Secondary data: data that has been already published & simply used by researchers in the own work.
Quantitative data:
find a large number of answers to set questions
looks for descriptive, rich & detailed answers, in a study
Qualitative data:
→ descriptive & detailed
→ collected through open questions
→ different opinions
Strengths | Weaknesses |
|
|
|
|
- |
|
Mean, Median, Mode and Range
There are three types of averages that can be calculated from raw data
The mean average
The median average
The mode
→ range is not an average, but still able to work out
1- Mean Average:
add all values of the set together
divide by the number of values in the set
→ 3 + 4 + 9 + 3 + 1 = 20 / 5 = 4
2- Median Average
arrange all values from lowest to highest
find middle value of set
→ 1, 2, 3, 4, 5 = 3
→ 1, 2, 3, 4, 5, 6 = 3 + 4 / 2 = 3.5
3- The Mode
most frequently occurring value in a set of scores
→ 9, 8, 2, 8, 8, 3, 5, 1 = 8
4- The Range
Numerical difference between the highest and lowest value in a set
Arrange values from lowest to highest and subtract them from each other
→ 10, 6, 8, 9, 3 = 3, 6, 8, 9, 10 = 10 - 3 = 7
Ways to express results
Ratios
Fractions/ decimals
Percentages
Ratio: comparing the amount of something between each other.
→ 15 boys and 12 girls in one class, the ratio would be 5:4 (simplest form)
Fractions and Decimals: way of expressing a part of a whole number.
→ 20 boys’ tot. and 15 of those ran, fraction would be 15/20 or ¾ (simplest form) or 0.75 as decimal. Therefore, the number of boys who didn’t run would be 0.25.
Percentage: way of expressing a fraction of hundred.
→ 50/100 would be 50%
Ways to write results down
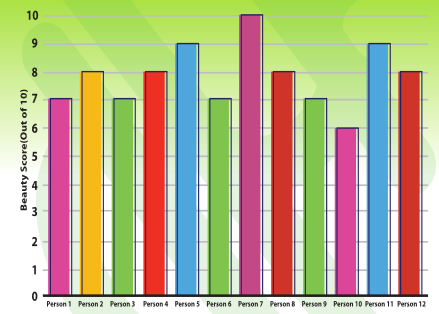
Bar Charts
used to display data that is in categories
→ bars should not touch and be separated from one another
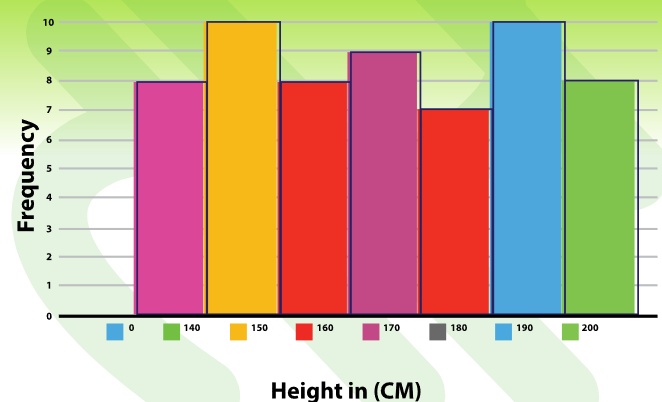
Histograms
used to present data that are continuous measurements such as test scores or even heights
→ have no spaces in between the bars
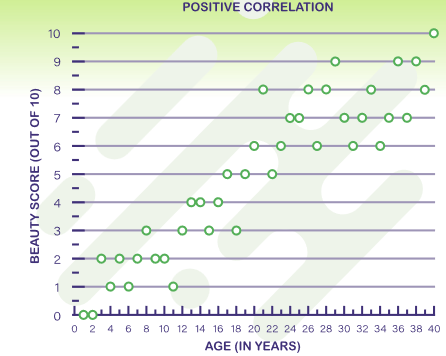
Scattergrams
used to visualize the relationship between two variables
→ random points on a graph, always showing either a positive, negative or zero correlation.
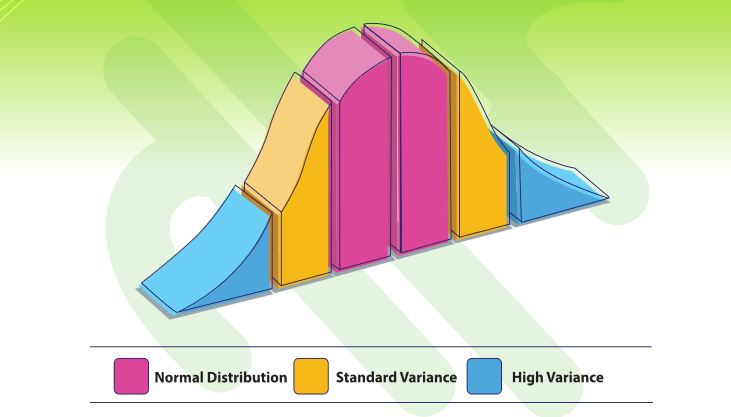
Normal Distribution
→ On a graph, this shows as a bell-shaped curve containing the mean, median and mode.