L9: CD spectroscopy
How Molecular Structure Affects σ and ε
Recap
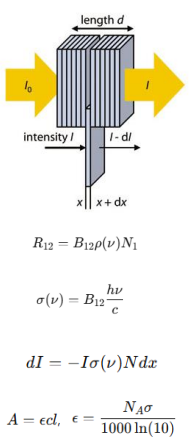
ε is molecule AND solvent specific
Chromophore properties
Electron Density Distribution: Affects transition dipole moments.
Conjugation and Planarity: Extended conjugation increases orbital overlap, enhancing absorption.
conjugation inversely related to energy - red shift
pi character - reduces energy gap
Substituents Effects:
Composition: distance between valence electrons and nucleus determines conjugation.
stability decreases light interaction
Electron-Donating Groups (e.g., -OH, -NH2_22): Increase conjugation and absorption.
Electron-Withdrawing Groups (e.g., -NO2_22, -COOH): Alter energy levels and transition probabilities.
Conformational Changes: Planar conformations maximize conjugation.
p-orbitals interact perpendicularly
Environmental Effects: Polarity and hydrogen bonding affect energy states.
titratable groups means absorption is affected by pH
hydrophobic vs hydrophillic environments
stablise charge distribution in polar solvents
Notable chromophores
Tryptophan in hydrophobic vs. hydrophilic environments showing spectral shifts.
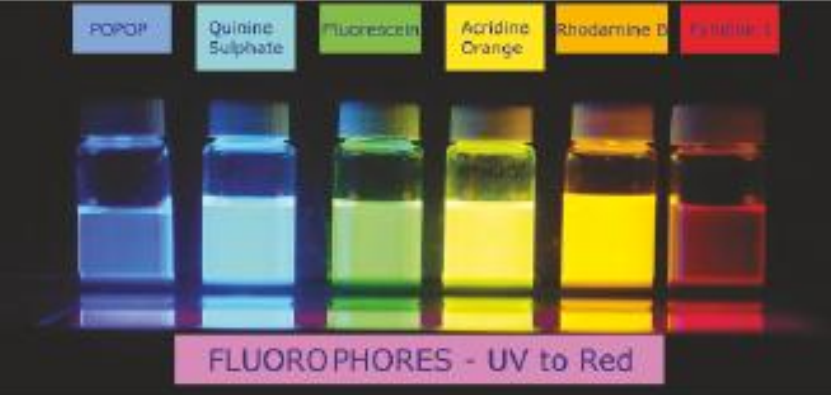
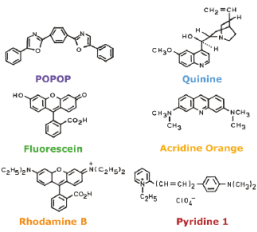
Dyes: BODIPy, Cy3, Cy5, Nile Red, Rhodamine
Beta-carotene with extended conjugation resulting in intense visible absorption.
Why Do Conjugated Systems Show Larger σ and ϵ?
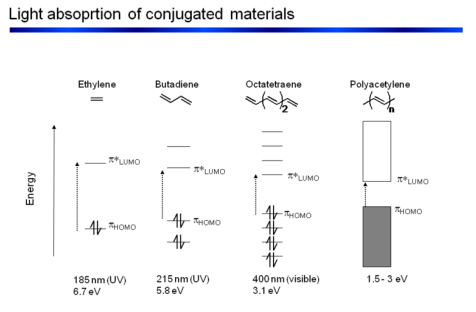
Delocalization of π Electrons
Increased Transition Dipole Moment
Planarity and Rigidity
tradeoff btwn planarity and number of bonds/atoms
Broad and Intense Absorption Bands: From multiple vibrational transitions in conjugated systems.
Examples
Beta-carotene: Strong absorption in the visible range due to extended conjugation.
Cyanine Dyes: Highly conjugated systems with intense visible and NIR absorption, used in fluorescence imaging.
Polyaromatic Hydrocarbons: Display intense absorption and emission due to extensive conjugation.
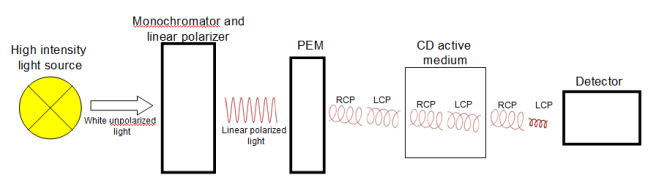
Circular Dichroism (CD) Spectroscopy
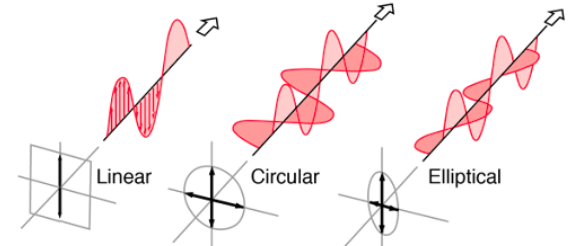
Differential Absorption of Circularly Polarized Light: Measures difference in absorption between left and right circularly polarized light.
Chiral Sensitivity: Used to analyze chiral molecules such as proteins and DNA.
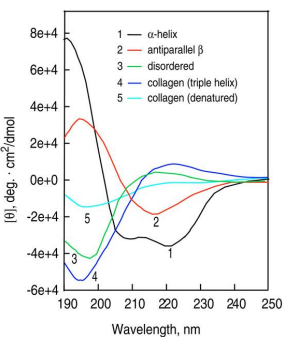
Secondary Structure Analysis: CD spectra can distinguish between α-helix, β-sheet, and random coil structures.
α-Helix: Negative peaks at 222 nm and 208 nm, positive peak at 190 nm.
β-Sheet: Negative peak at 218 nm, positive peak at 195 nm.
Electronic Transitions and Optical Activity: Transitions are influenced by the chiral environment, leading to CD signals.
Applications
Protein Folding and Conformational Changes: Monitoring secondary structure transitions.
Ligand Binding Studies: Detecting conformational changes upon ligand binding.
Chiral Drug Analysis: Characterization of enantiomeric purity.
single molecule FRET
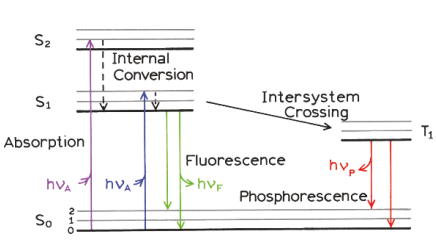
Fluorescence
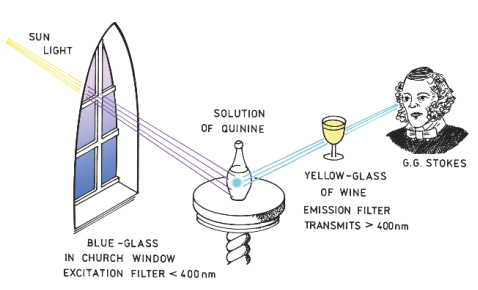
Discovery of fluorescence
aromatic, conjugated systems in particular environments
dyes - Ancient Egypt
Sir William Herschel -
Characteristics of fluorescence emission
Jablonski diagram, Stokes shift,