***Normal Distributions
Normal distribution - a probability distribution that appears as a "bell curve" when graphed; it’s centered at its mean, and the standard deviation determines how thin or fat the shape is
Center of curve / highest point = the mean
Low standard deviation = most of the points are very close to the mean; thin tails; cluster / high concentration
High standard deviation = most of the points are spread out relative to the mean; fat tails; diffused / low concentration
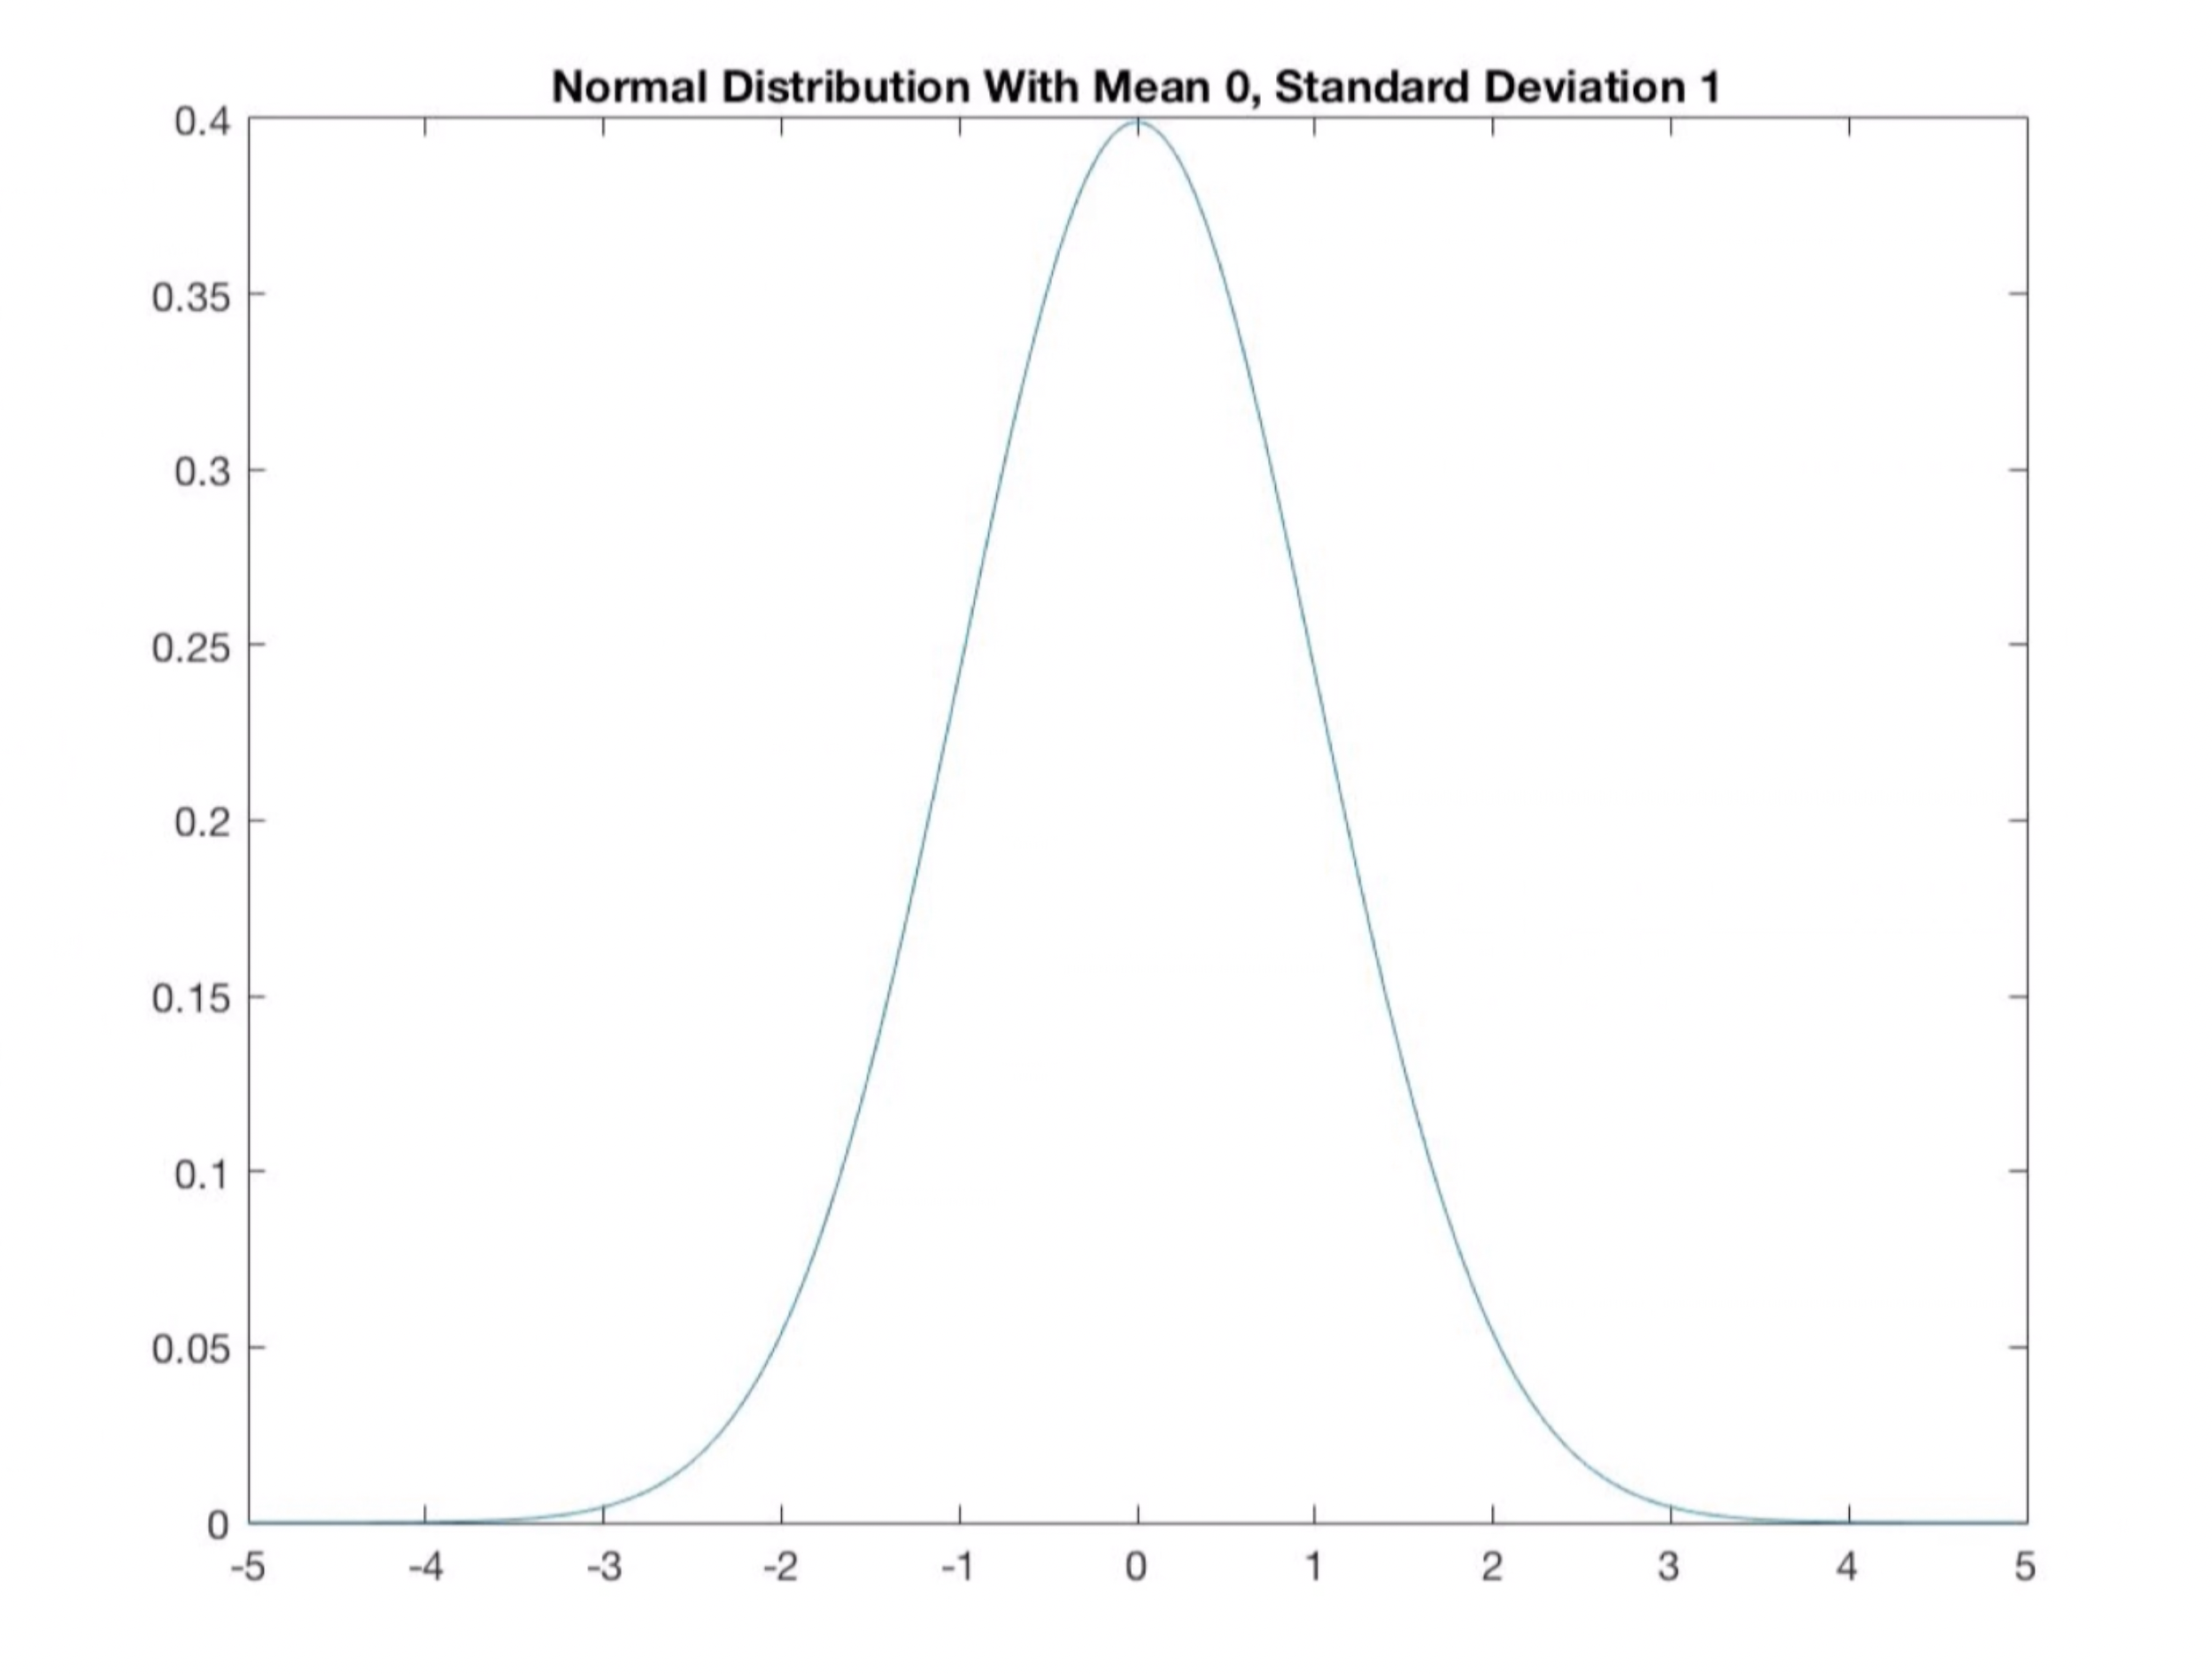
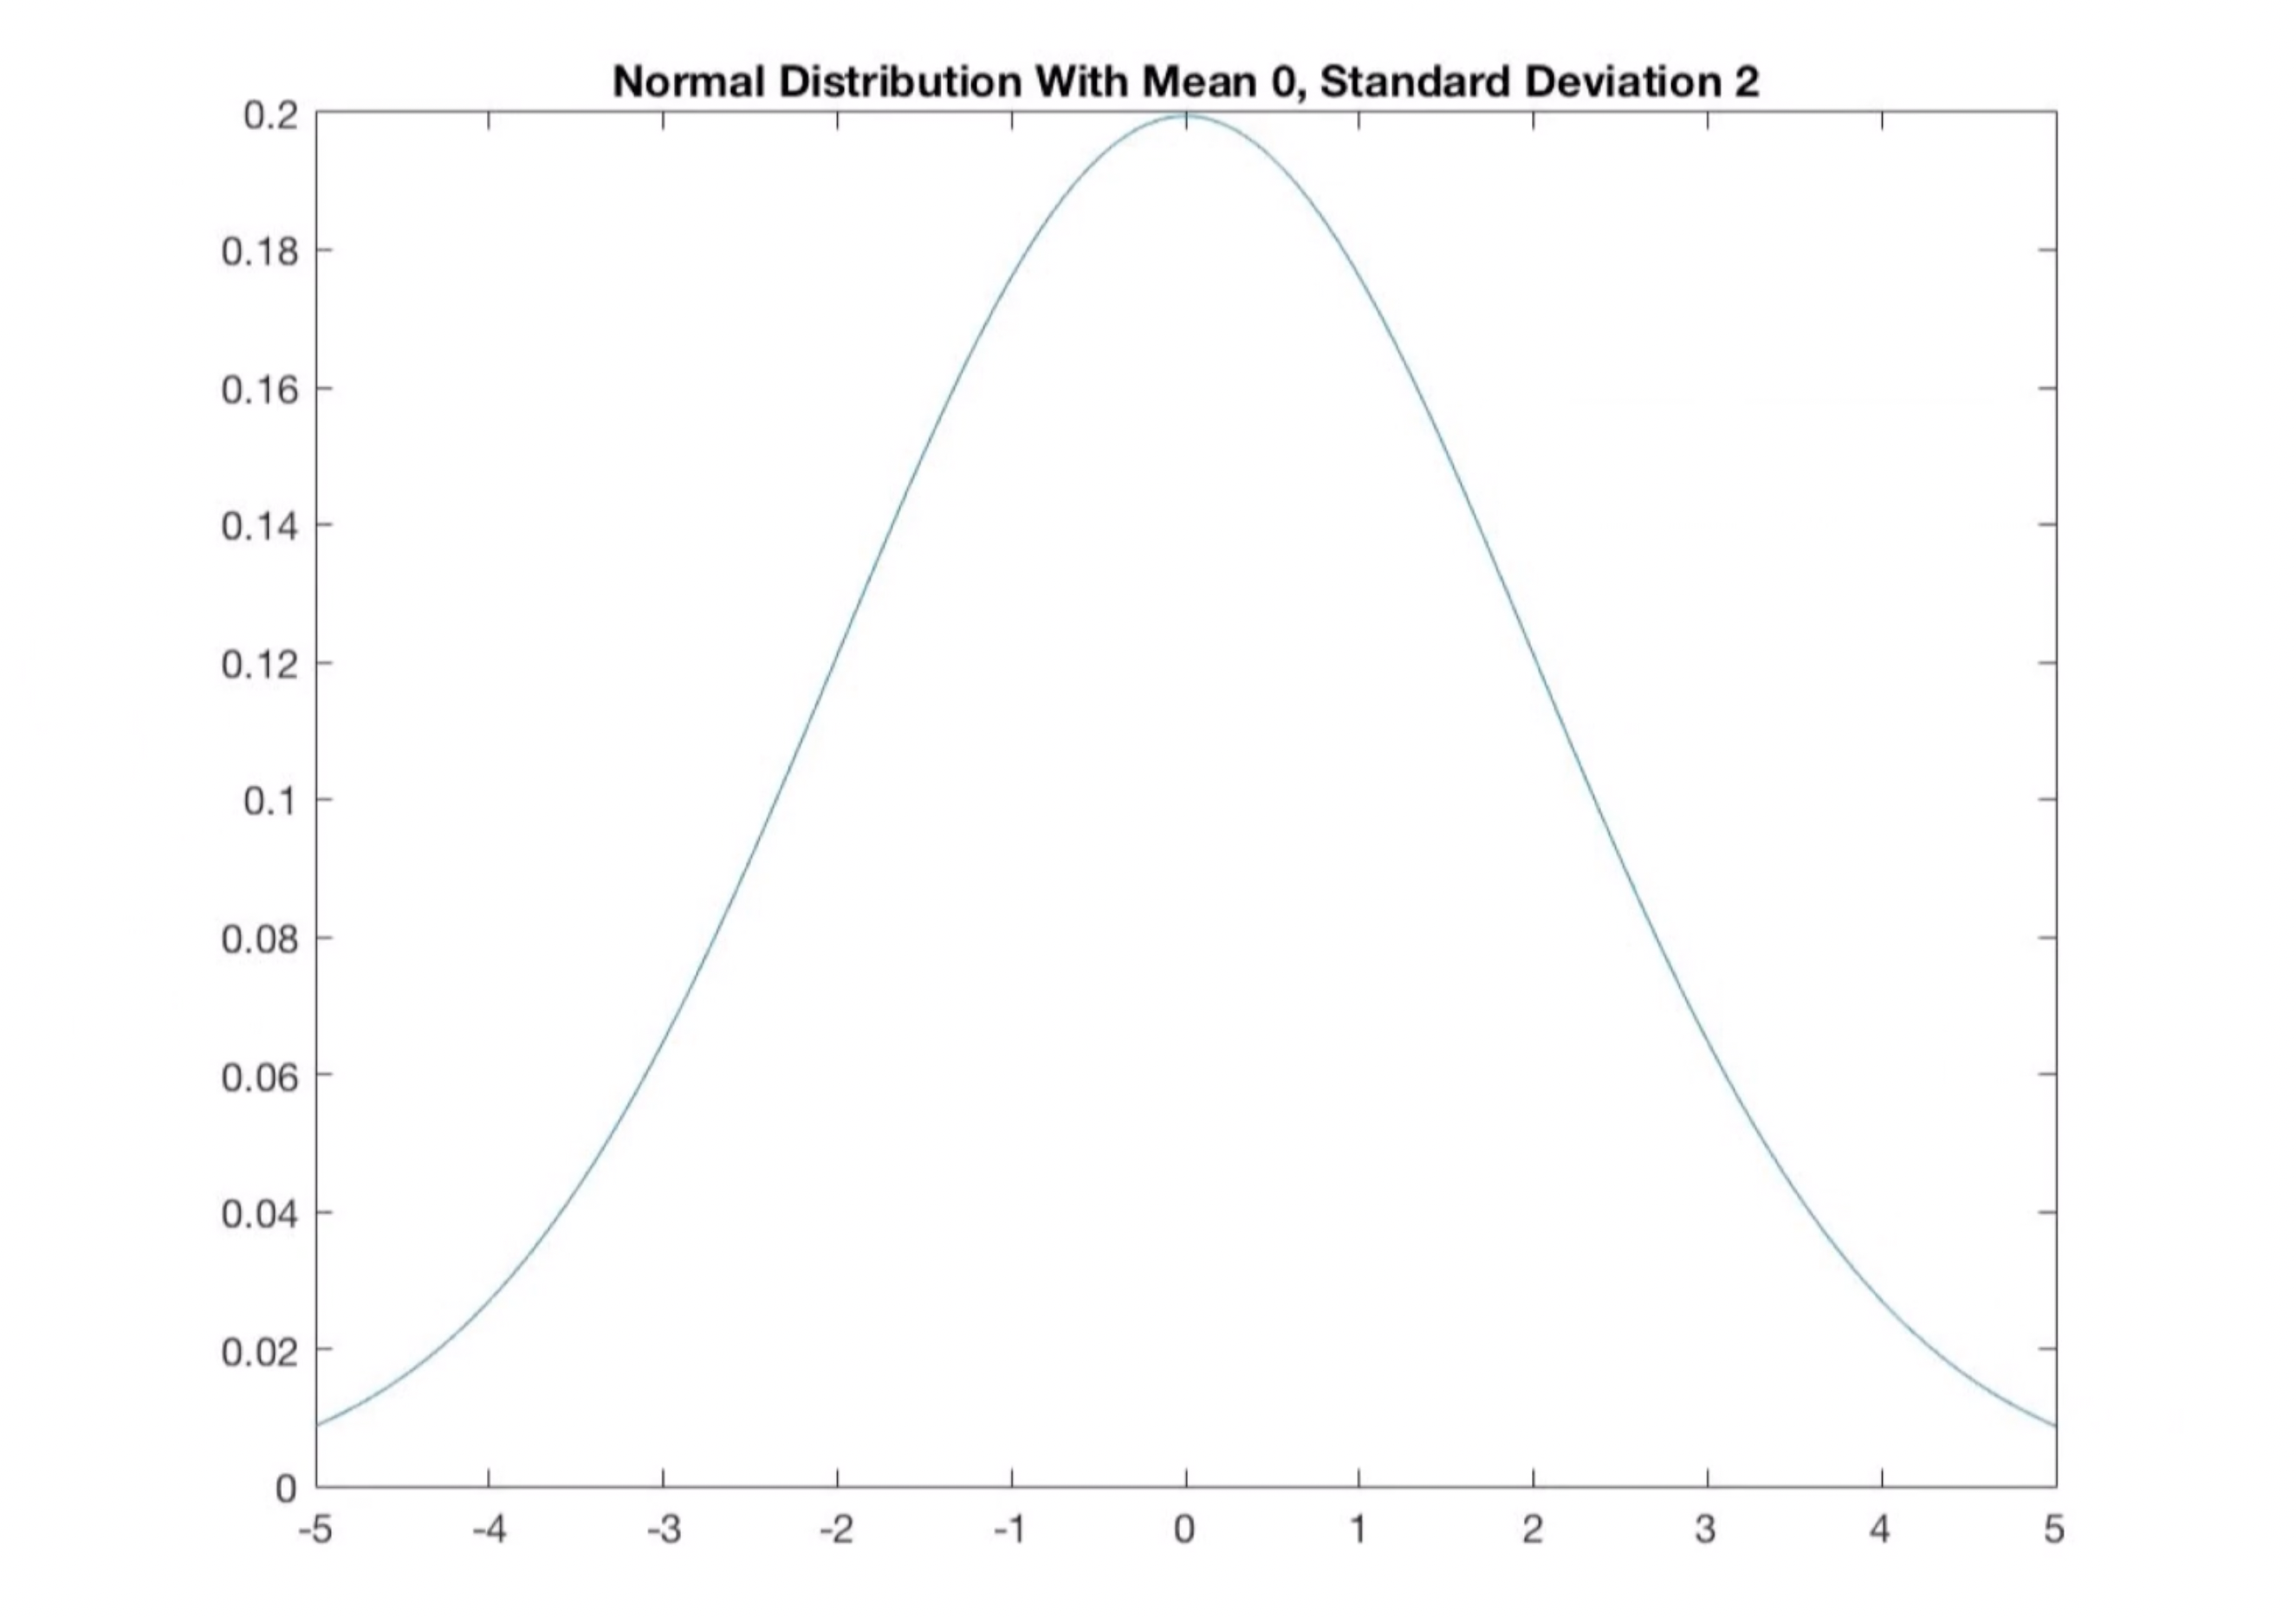
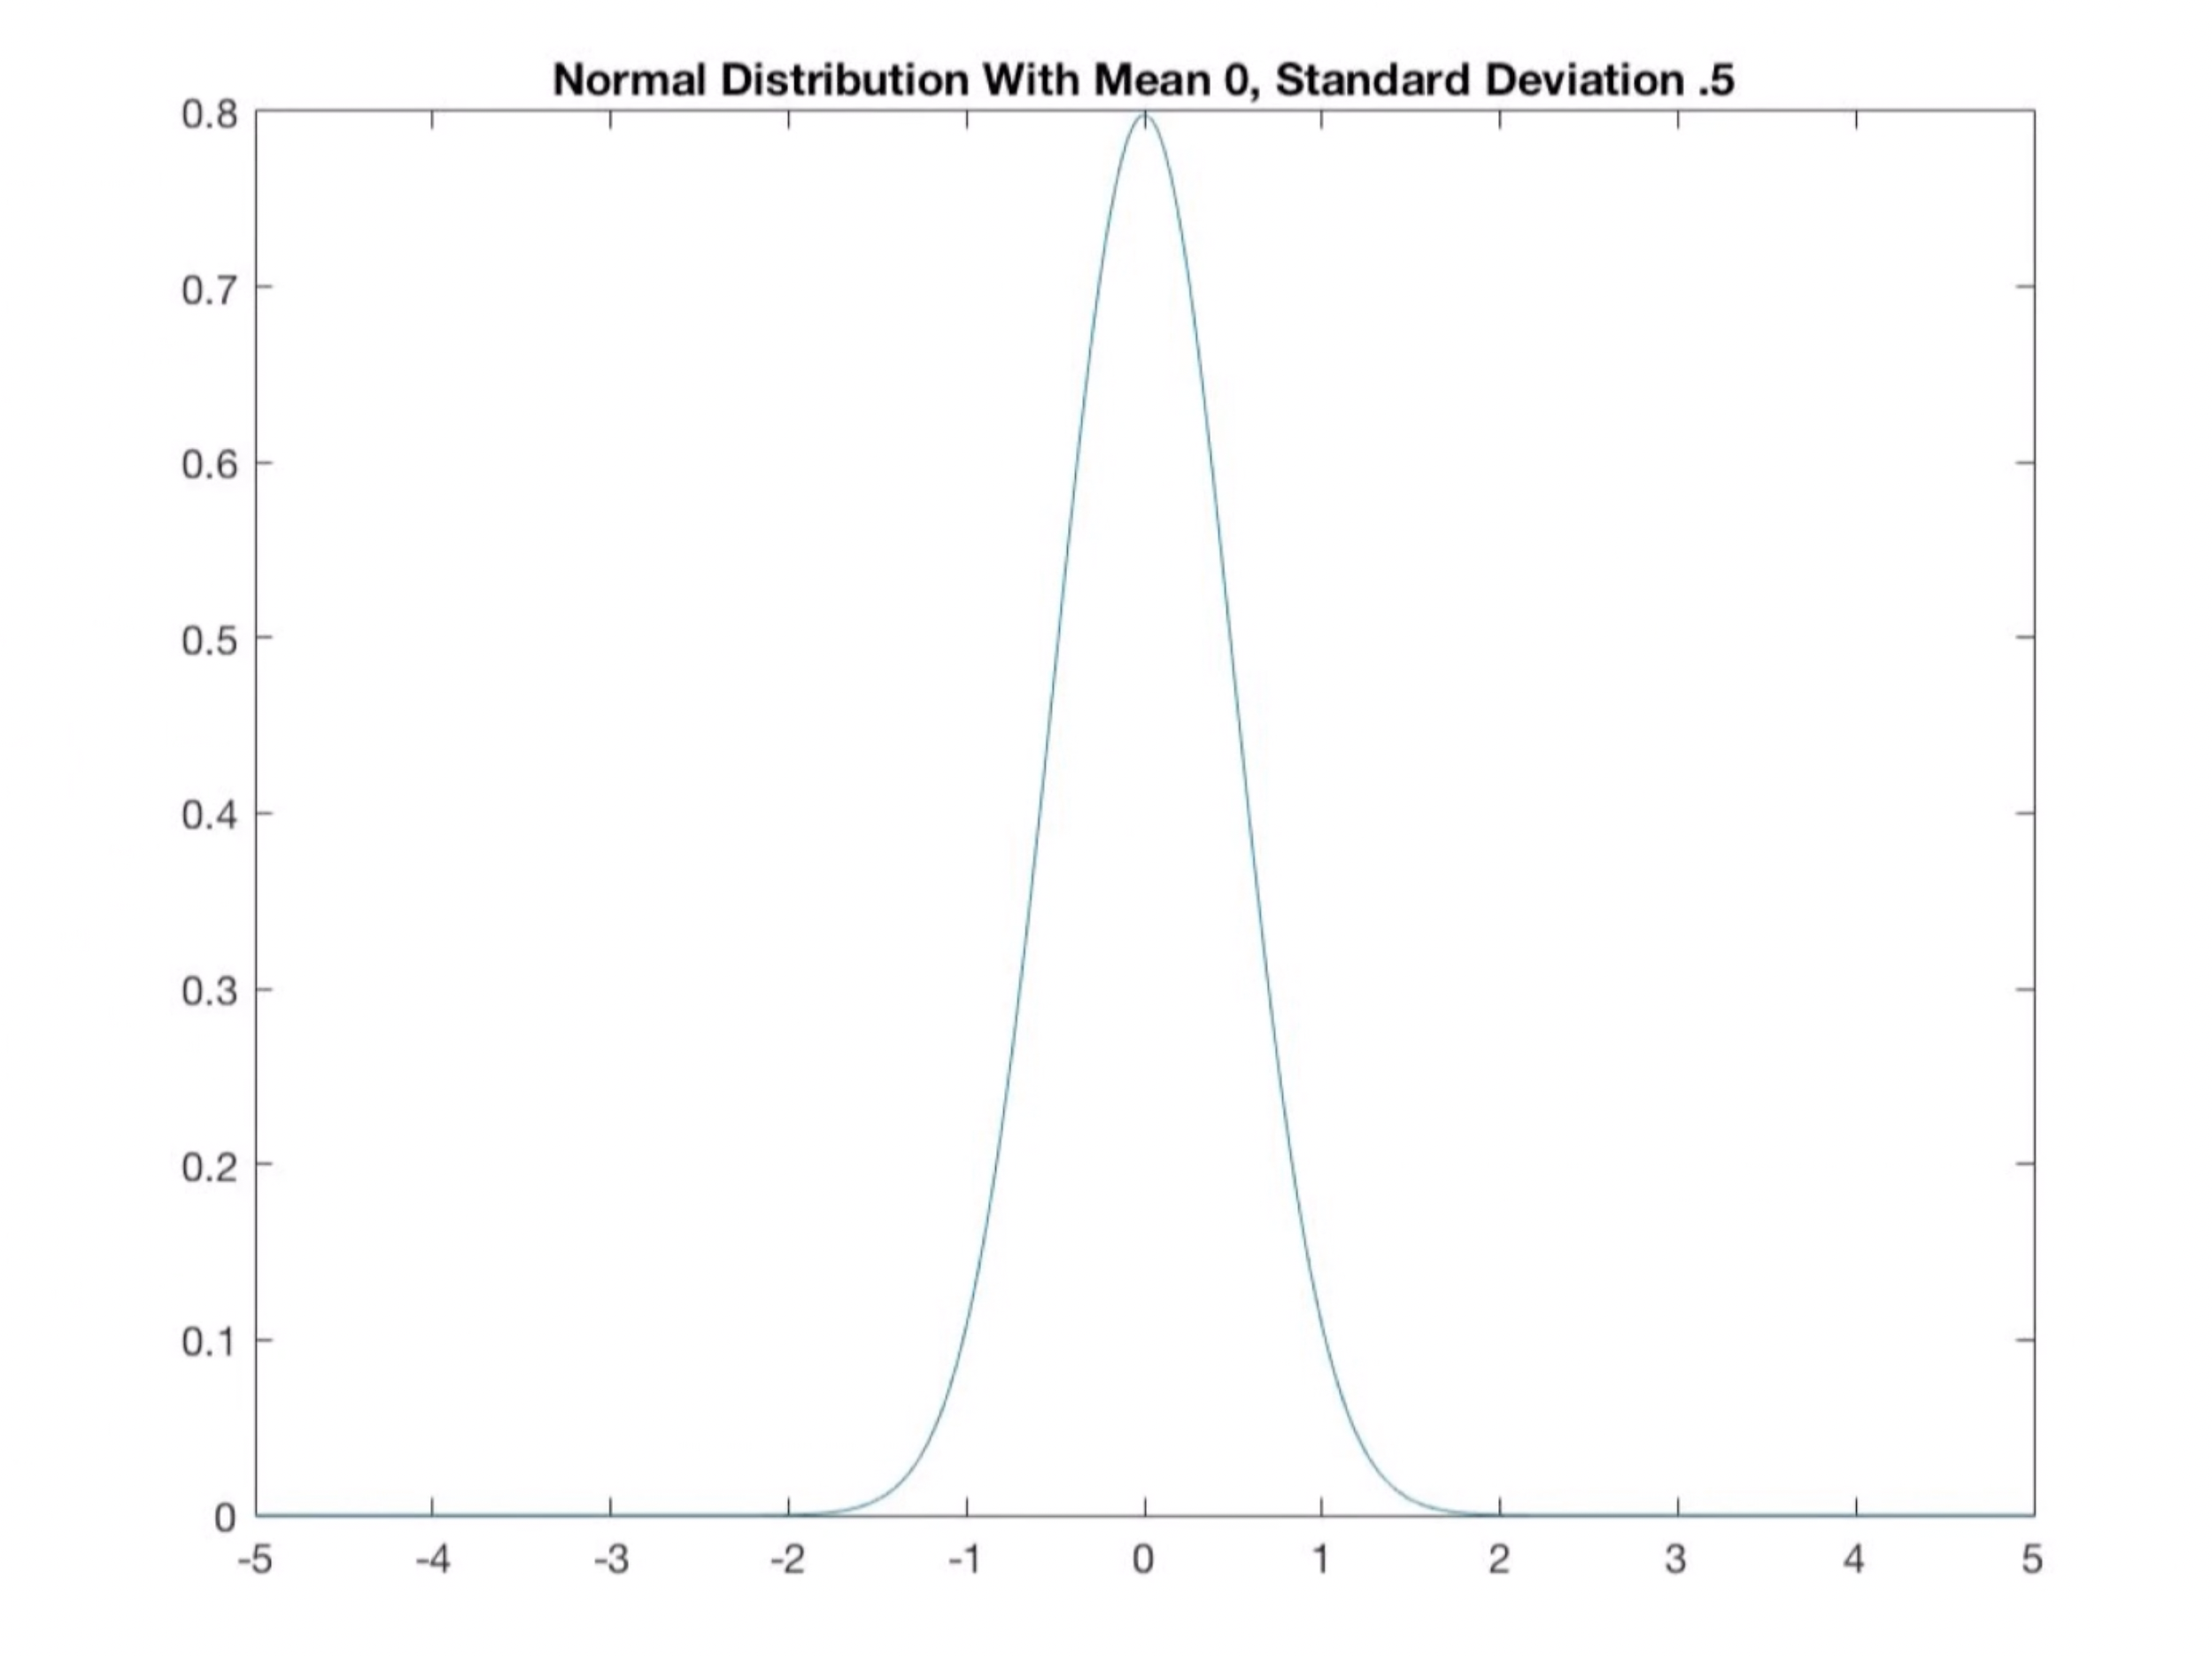
How to compute Probabilities with Normal distribution
The probability that a quantity, x, is within a certain range, a and b = the area between a and b under the normal distribution curve
P (a ≤ x ≤ b)
68-95-99.7 rule
P (μ - σ ≤ x ≤ μ + σ) ≈ .68; means the probability that you’re within 1 standard deviation of the mean is 68%
μ = mean
σ = standard deviation
P (μ - 2σ ≤ x ≤ μ + 2σ) ≈ .95; means the probability that you’re within 2 standard deviations of the mean is 95%
P (μ - 3σ ≤ x ≤ μ + 3σ) ≈ .997; means the probability that you’re within 3 standard deviations of the mean is 99.7%
SOLVE suppose height is normally distributed with mean 68” and standard deviation 3”. estimate the following possibility: P (a person is between 65 and 71 inches)
P (65 ≤ x ≤ 71)
P (68 - 3 ≤ x ≤ 68 + 3)
P (μ - σ ≤ x ≤ μ + σ); μ = mean (68), σ = standard deviation (3)
P (68 - 3 ≤ x ≤ 68 + 3)
P (65 ≤ x ≤ 71) ≈ .68