ch03 Discrete Random Variables & Prob Distributions-4
Chapter 3: Discrete Random Variables & Probability Distributions
3.1 Probability Distributions and Probability Mass Functions
1) Random Variables: A random variable is defined as a quantity resulting from an experiment that can assume different values due to chance.
1) Probability Distribution: lists all outcome of an experiment and the probability associated with each outcome
2) Two Types of Random Variables:
2) Discrete Random Variable: has a probability distribution that specifies the list of possible values of X along with the probability of each, or it can be expressed in terms of a function or formula typically arising from counting.
ex: number of cars entering a car wash
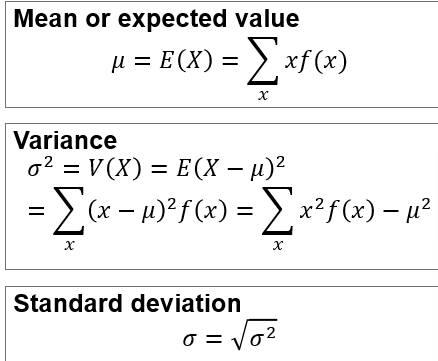
Mean (mhu), Variance (rho²), Standard Deviation (rho) of Discrete Random Variable
Excel: use excel to breakdown formula to solv can’t use preset setting on excel
2) Continuous Random Variable: can assume an infinite number of values within a given range. result of a measurement
length of an afternoon nap or distance student travels to class
Mean of Probability Distribution:
also known as expected value, represents the central location of probability distribution

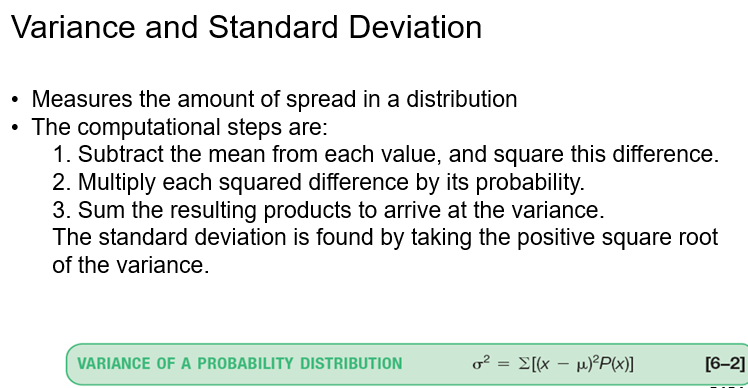
Variance (rho²) and Standard Deviation (rho) of a Probability Distribution:
measure spread in distribution

3) Discrete Distribution
sum of the probabilities of the outcomes is 1.00
probability of a particular outcome is between 0 - 1.00
outcomes are mutually exclusive
3) 3.2 Cumulative Distribution Functions
Cumulative Distribution Function (CDF): A function that gives the probability that a discrete random variable is less than or equal to a specific value.
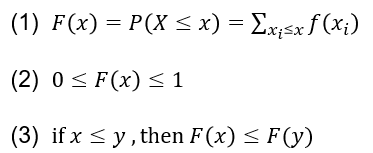
Calculation of CDF: For a given value , the CDF is summed over its probability mass function, that is,
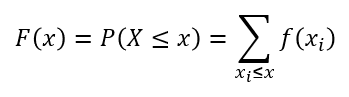
for discrete random variable satisfies:
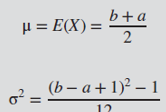
3) 3.4 Discrete Uniform Distribution
For a discrete uniform distribution, every value within a defined range has the same probability.

Mean and Variance of Discrete Uniform Distribution:
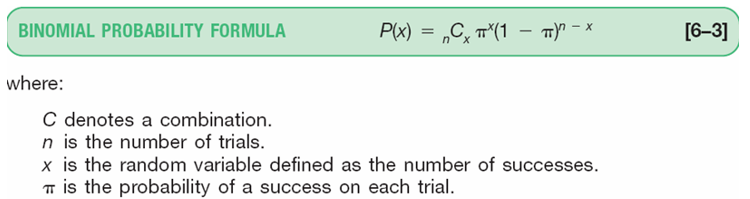
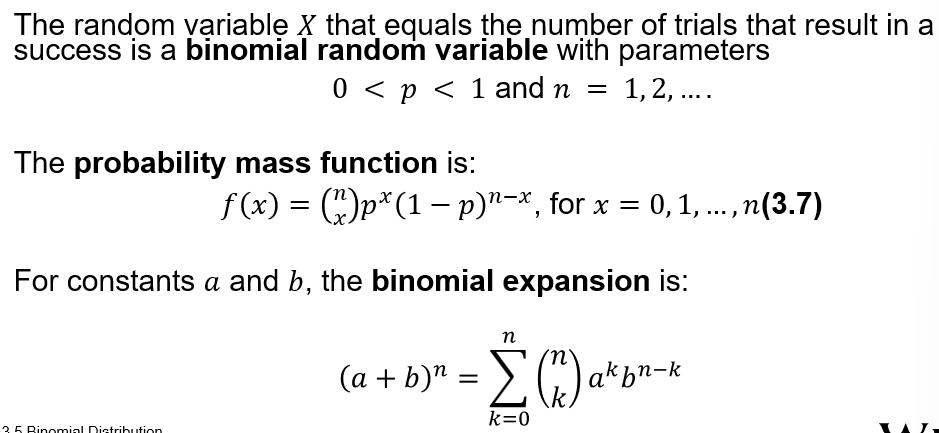
3) 3.5 Binomial Distribution
Characteristics: Only two possible outcomes, trials are independent, and the variable counts successes. Outcomes are mutually exclusive
Binomial Formula:
Excel: =BINOM.DIST
P(at most x-1 ) for true <
X - number of success trials
Trials - number of independent trials
Probability - probability of success
Cumulative:
True = at most number of successes
False = mass function or the probability that there a number of success
Cumulative true/false:
if says exactly than false
x = x
if inequality than x-1 for first variable (at least)
X>= x use n-x as X and 1-p(x) (at least) true
for less than 1- binom true
X = x-1 to turn into x<= x-1
for more than binom false
X=x 1-p(x)
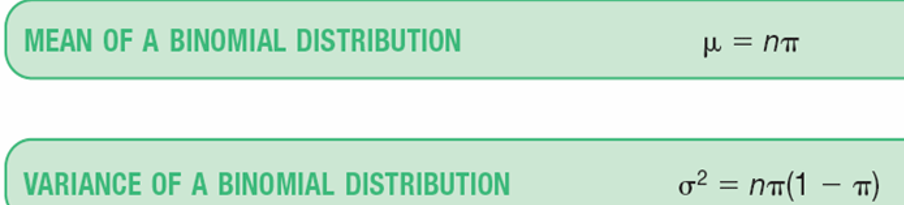
Mean and Variance of Binomial Distribution:
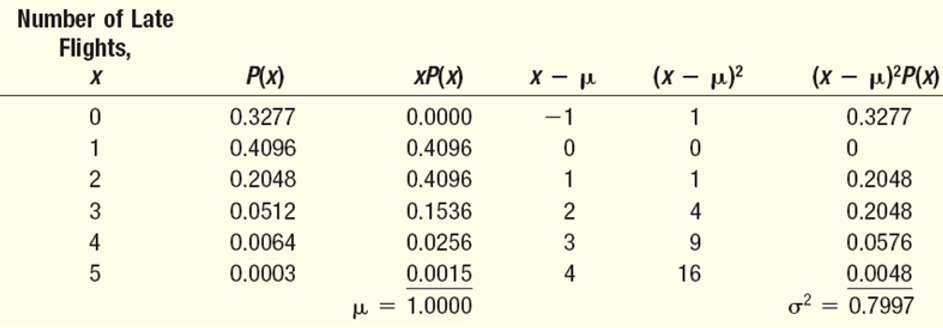
Probability mass function binomial distribution and binomial expansion
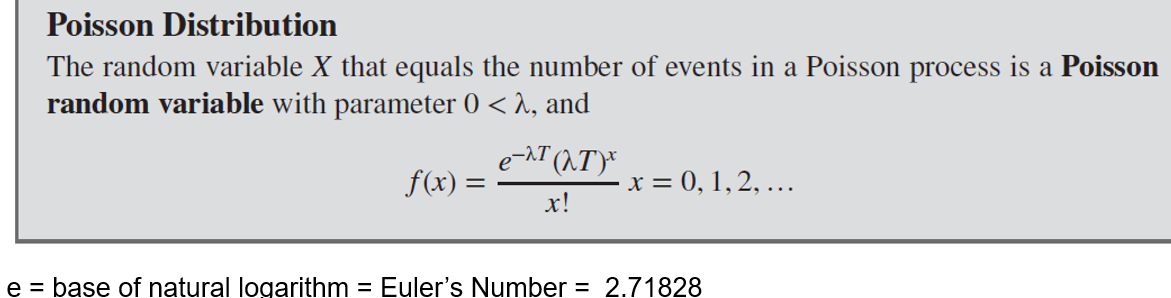
3.8 Poisson Distribution
Definition: The Poisson distribution models the number of events in a fixed interval of time or space, assuming events occur independently and probability is proportion to length of interval
Excel: = POISSON.DIST(x, mean, cumulative)
reference: Cumulative true/false:
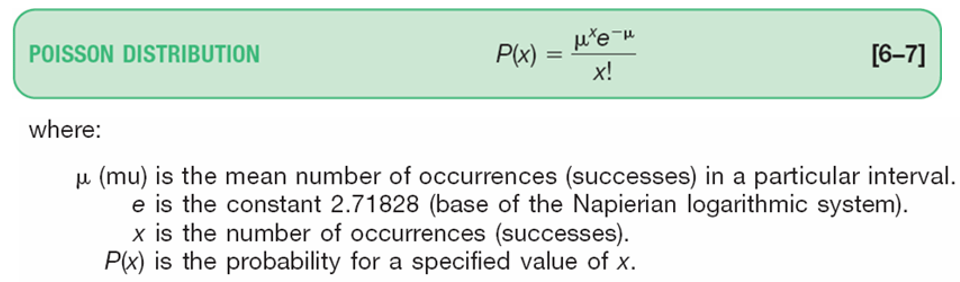
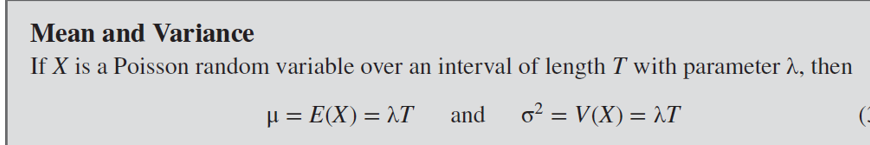
Mean of Poisson:
mhu = n*pi = numner of successes
Variance of Poisson:
= n*pi same as mean
Application Example: Can be applied to model rare events like bag loss in flights or theft occurrences using the specified interval.
Practical Interpretations
Understanding these distributions helps in making informed decisions in engineering contexts, such as risk assessment and resource allocation. It is critical to choose the appropriate model depending on the situation at hand.