Introduction to the Practice of Statistics
Introduction to the Practice of Statistics
Objectives
Define statistics and statistical thinking.
Explain the process of statistics.
Distinguish between qualitative and quantitative variables.
Distinguish between discrete and continuous variables
Determine the level of measurement of a variable
Define statistics and statistical thinking
Statistics is the science of collecting, organizing, summarizing, and analyzing information to draw conclusions or answer questions. In addition, statistics is about providing a measure of confidence in any conclusions.
The information referred to in the definition is data.
Data: a “fact or proposition used to draw a conclusion or make a decision.”
Data describes the characteristics of an individual.
A key aspect of data is that they vary.
Is everyone in your class the same height? No!
Does everyone have the same hair color? No!
So, among individuals, there is variability.
In fact, data measured on ourselves vary as well.
Do you sleep the same number of hours every night? No!
Do you consume the same number of calories every day? No!
One goal of statistics is to describe and understand sources of variability.
Explain the Process of Statistics
For most studies, it is unreasonable to expect access to all individuals of interest, as it might be time-consuming or impractical.
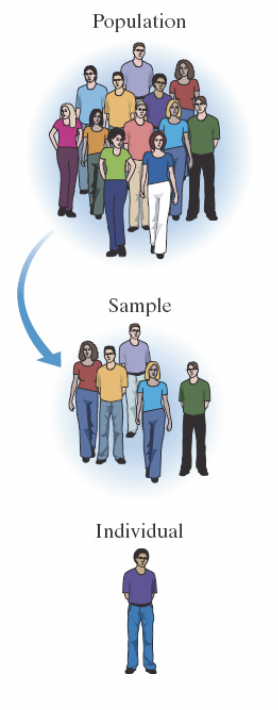
Population = The entire group of individuals to be studied.
Individual = A person or object that is a member of the population being studied
Sample = A subset of the population that is being studied
What is a statistic?
A statistic is a numerical summary based on a sample.
Inferential Statistics
How can a statistic be used? Inferentially (it can be characterized by or involving conclusions reached on the basis of evidence and reasoning)
Inferential statistics uses methods that take results from a sample and extend them to the population to measure the reliability of the result.
A numerical summary is then made for the population
Parameter = a numerical summary of a population.
Descriptive Statistics (DS)
DS consists of organizing and summarizing data.
DS describes data through numerical summaries, tables, and graphs.
Example
Parameter VS Statistic
Suppose the proportion of all students on your campus who have a job is 0.849.
This value represents a parameter because it is a numerical summary of a population.
Suppose a sample of 250 students is obtained, and from this sample, we find that the proportion of those who have a job is 0.864.
This value represents a statistic because it is a numerical summary based on a sample.
The Process of Statistics
Identify the research objective.
A researcher must determine the question(s) he or she wants answered.
The question(s) must clearly identify the population that is to be studied.
Collect the data needed to answer the question(s) posed in (1).
Conducting research on an entire population is often difficult and expensive, so we typically look at a sample.
This step is vital to the statistical process because if the data are not collected correctly, the conclusions drawn are meaningless.
Do not overlook the importance of appropriate data collection.
We discuss this step in detail in Sections 1.2 through 1.6.
Describe the data.
Descriptive statistics allow the researcher to obtain an overview of the data and can help determine the type of statistical methods the researcher should use.
We discuss this step in detail in Chapters 2 through 4.
Perform inference.
Apply the appropriate techniques to extend the results obtained from the sample to the population and report a level of reliability of the results.
We discuss techniques for measuring reliability in Chapters 5 through 8 and methods for inference in Chapters 9 through 15.
Example
Illustrating the Process of Statistics
In a study of high school students' sleeping patterns, the association between the start time of school and sleep duration was investigated.
The study included 383 randomly selected adolescents from the United States.
The sample had a mean age of 15.5 years, with a standard deviation of 0.6 years.
It was found that students who started school at 8:30 am or later exhibited a significantly longer sleep duration of 27.5 minutes.
Further comparisons showed that every 1-hour delay in start time was significantly associated with 21-minute longer sleep duration.The researchers concluded that on average, high school start times of 8:30 am or later result in significantly longer sleep durations in adolescence, compared to earlier start times.
SOLUTION
Identify the research objective.
To determine the association between start time of school and sleep duration.
Collect the information needed to answer the question.
The researchers studied 383 randomly selected adolescents from the United States.
Describe the data
Organize and summarize the information.
The adolescents had a mean age of 15.5 years with a standard deviation of 0.6 years.
Students who started school at 8:30am or later exhibited a significantly longer sleep duration of 27.5 minutes.
Further comparisons showed that every 1-hour delay in start time was significantly associated with 21 minutes longer sleep duration.
Draw conclusions from the data.
The researchers concluded that, on average, high school start times of 8:30 am or later result in significantly longer sleep durations in adolescence, compared to earlier start times.
Distinguish between Qualitative & Quantitative
Variables = the characteristics of the individuals within the population.
Key Point
Variables vary.
Consider the variable “height”.
If all individuals had the same height, then obtaining the height of one individual would be sufficient to know the heights of all individuals.
Of course, this is not the case.
As researchers, we wish to identify the factors that influence variability.
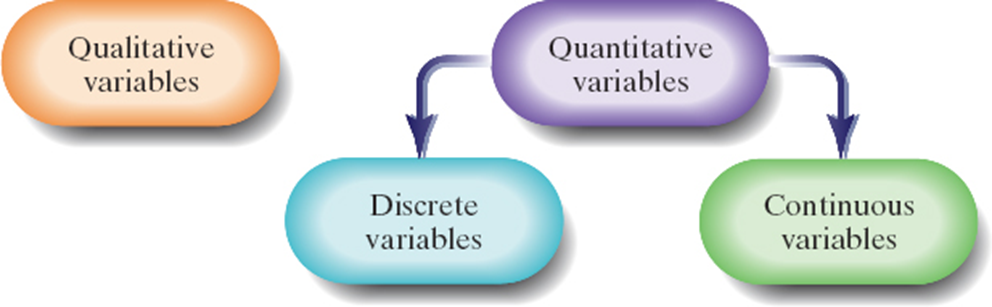
Qualitative or categorical = variables that allow the classification of individuals based on some attribute or characteristic.
Quantitative = variables that provide numerical measures of individuals.
The values of a quantitative variable can be added or subtracted to provide meaningful results.
Example
Qualitative versus Quantitative Variables
Classify each of the following variables as qualitative or quantitative.
(a) Level of education
(b) Today’s highest temperature
(c) Daily intake of whole grains (measured in grams per day)
(d) Number of vending machines at a school
(e) Whether or not a student is prepared for class
(f) Number of days per week a student eats lunch
(g) Name of a university
(a) Qualitative - characteristic/detail
(b) Quantitative - numerical value
(c) Quantitative - numerical value
(d) Quantitative - numerical value
(e) Qualitative - detail/categorical
(f) Quantitative - numerical value
(g) Qualitative - detail/categorical
Distinguish between Discrete & Continuous Variables
Discrete Variable
Quantitative variable that has either a finite number of possible values or a countable number of possible values.
Finite = limited
Countable = the values that result from counting, such as 0, 1, 2, 3, and so on.
A discrete variable cannot take on every possible value within a given range of two whole numbers
Continuous Variable
Quantitative variable that has an infinite number of possible values that are not countable.
Infinite = NO LIMITS
It may take on every possible value
Can be measured to any desired level of accuracy.
Example
Discrete vs Continuous Variables
Classify each of the following variables as qualitative or quantitative.
Determine whether the quantitative variables are discrete or continuous.
(a) Gender
(b) Income status (i.e. middle income, low income, etc.)
(c) Income
(d) Grade earned in Algebra (as a percentage)
(e) Response to the question “Working with numbers upsets me,” where the responses are given as strongly agree, agree, disagree, or strongly disagree)
(f) Number of children in a classroom
(a) Qualitative
(b) Qualitative
(c) Quantitative - C
(d) Quantitative - C
(e) Qualitative
(f) Quantitative - D
Data
Data = The list of observations a variable assumes
While gender is a variable, the observations, male or female, are data.
Qualitative data are observations corresponding to a qualitative variable.
Quantitative data are observations corresponding to a quantitative variable.
Discrete data are observations corresponding to a discrete variable.
Continuous data are observations corresponding to a continuous variable.
Example
Qualitative Variable = Manufacturing of a car (CATEGORY)
Qualitative Data = Ford, Chevrolet, BMW, etc (OBSERVATIONS A VARIABLE ASSUMES)
Continuous Variable = Gas Mileage, eg. 13 mpg, 21 mpg, etc (INFINITE)