UNIT 2.2: horse girl turns into city girlie
IN CLASS NOTES
Crude birth rate: # of live births/yr for each 1,000 ppl alive in a society
a cbr of 20= for every 1,000 ppl in a society, 20 babies r born each yr
highest cbrs r in sub-saharan africa (about 40), the lowest r in Europe (abt 10)
highest=least developed (and vice versa)
total fertility rate: avg # of children who would be born per woman of a society (assuming every woman lived thru her childbearing yrs 15-49)
compared to cbr, tfr is more accurate in depicting cultural norms (how women r perceived in society and how they weigh the costs and benefits of having kids)
tfr is higher in the past than it is today
Crude Death Rate: the total # of deaths/yr for every 1,000 ppl alive in society
the combined CDR for all developing countries is actually lower than the combined rate for developing countries
our healthcare system sucks- not accessible to everyone
demographic transition: the pops of diff countries r at various stages in a process
moves from high CBR/CDR and a low RNI —> low CBR/CDR and a low RNI and a high total pop
Rate of natural increase (RNI or NIR): the percentage by which a pop grows in a yr
natural= excludes migration
RNI= (CBR-CDR)/10
roughly near 1 or 2%
tends to be 1% in higher developed countries and greater than 1% in lesser developed countries
doubling time: # of yrs needed to double a pop assuming a rate of nat increase
Demographic transition model (DTM): shows usually five typical stages stages of pop change that countries pass thru as they modernize
stages last for a period of indeterminate time
demographic balancing equation:
future pop = current pop + (# of births - # of deaths) + (# of immigrants - # of emigrants)
CBR: total num of live births per yr for each 1,000 ppl
TFR: avg num of children being born to a person in their childbearing ages (15-49)
used to be 6.2 kids in pre 1800s europe
avg life span was roughly 40 yrs
life expectancy: avg num of yrs ppl live
mostly calc from their time of birth, but can be calc from any point in their lifetime
a century ago it was 34 yrs, now its ~70 yrs
infant mortality rate: the num of children who die before their fist bday
CDR: num of deaths per 1,000 ppl in an area
RNI (rate of nat increase): the % at which a country’s pop is growing/decling w/o the impact of migration
rule of 70 (or 72): assuming the growth rate remains steady, the approx doubling time in yrs will be 70 divided by growth rate per yr
farmers are 3% of the population, but they feed the whole world
Advances:
mechanizing food production (horses—>tractors)
improving seeds/fertilizers/farming techniques thru research
more efficient transportation
effects:
less farmers —> more ppl in nonfarm industries, easing transition into industrialization
improved food security (famine occurred bc of poverty/political issues/ distribution problems, not a lack of food)
as farms depended less on manual labor, farm fams became smaller
machines created the need for bigger farms (one person can farm more than before)
as rural areas downsized, cars and better roads allowed ppl to travel further and more easily, many small towns disappeared
DTM (demographic transition model): shows the 5 typical stages of pop change that countries experience as they modernize
lasts for a period of indeterminate length
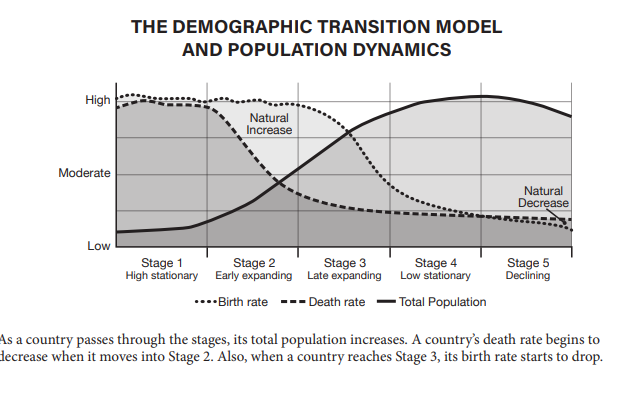
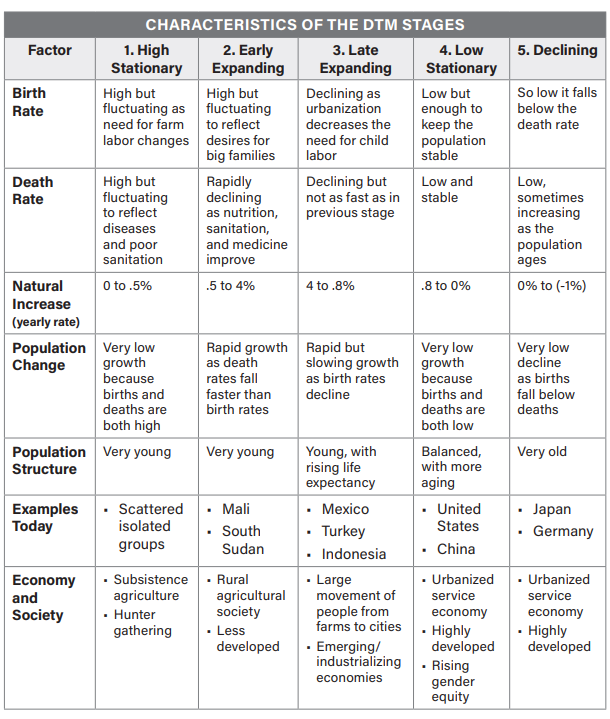
Stage 2:
expansive pop pyramid
high birth rate, low life expectancy
rapid pop growth due to younger gen being a larger pop
Stage 3:
countries wanna move from stage 3 fast to avoid long term exponential pop growth
demographic momentum: tho fertility rates have gone down, ppl r living longer and this results in pop continuing to grow for another 20-40 yrs
stage 2—>3 has the fastest pop growth
Stage 4:
stationary pop pyramid
birth rate is slow but steady
death rate is also low
(box like shape)
stage 5:
decreasing birth rate
aging pop/declining overall
dtm can be used to analyze diff scales
ex: birth rates within a region or subregion can differ from the larger society
factors that affect the dtm:
citizens of countries in stage 2/3 don’t have as many options to migrate out of the country to release some of the pop pressure
governments often place severe restrictions and limitations on migration
today, birth control and govt policies play a much larger role in reducing birth rates than prev
economic changes in less developed countries today r much diff than the experiences that the us and western europe in the past have had
Countries in later stages of the model are not necessarily more successful than countries in earlier stages; they simply have different demographic characteristics.
epidemiological transition model: explains the changing death rates and more common causes of death within societies
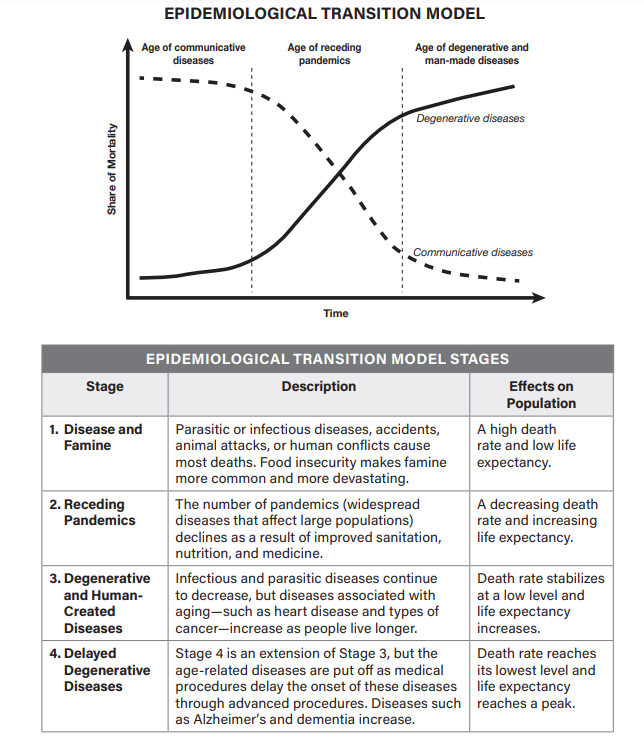
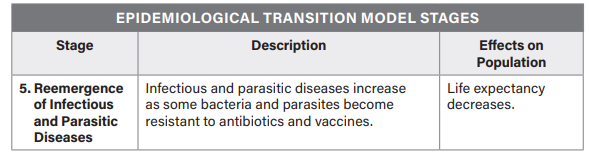
covid challegened this model, since pandemics are more part of stages 1&2
doesn’t take into account the impact of lifestyle choices/local environmental factors on life expectancy
Malthusian theory:
food would increase arithmetically (growing steadily by a similar amt each gen)
believed ppl would not limit the num of kids they have, to the pop would increase exponentially (grows by a similar % each gen)
pop would become unsupportable
if ppl didn’t limit pop growth voluntarily, we would become unsustainable and overpopulated
boserup theory:
more ppl=more hands to work, not just more mouths to feed
pop increase=more pressure is placed on existing agriculture system=stimulates innovation=more food production
neo malthusians still believe pop growth is a problem
anti natalist policies: attempt to decrease the num of births in a country and r often used by developing countries
ex: china
two diff policies-
first, “later longer, fewer” in 1972 (encouraged parents to get married later in life, wait longer between kids, and as a result
second, the one child policy
gender preference creates unequal ratios, with countries like india and china preferring males over females
can lead to ritualistic killings
pronatalist policies: programs designed to increase the fertility rate
demographic balancing equation: includes both immigration & emigration when predicting future pop
total fertility rate: avg # of children who would be born per woman of a society (assuming every woman lived thru her childbearing yrs 15-49)
1) E: since it has a smaller base than the top, which indicates a shrinking birth rate (characteristic of a stage 5 country)
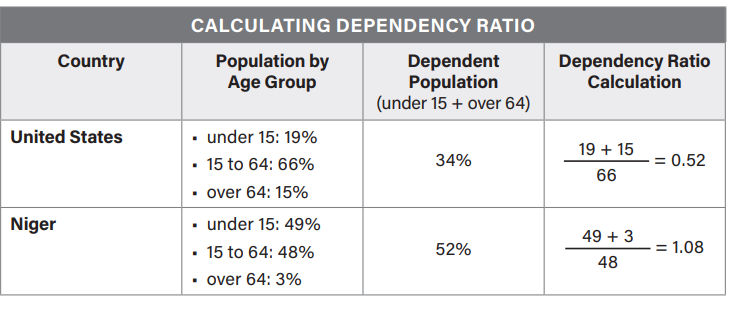
2) A: since the bulk of the population is in its older ages, requiring more care for the elderly
3) A: these people are nearing the end of what is considered their working ages, which means the new working generation, which is smaller than the population of dependant people, need to support them.
4) B: giving education to women allows them a chance to delay/choose not to get pregnant, as well as giving them an opportunity to learn the effects of pregnancy.
5) B: because as your body gets older, it becomes slower and slower with its regeneration, and that means that your health often deteriorates, necessitating more healthcare.
6) C: because the CDR to CBR ratio is the highest- meaning that there’s more people being born and less people dying than the rest of the chart.
7) C: More developed countries usually consist of people who are older, because often people just do not survive in less developed countries.
FRQ
A) in 1950, more developed countries were just under one billion, and by roughly 2015, it was just slightly over 1 billion. It is predicted to grow in an almost straight lin e, remaining stable and never reaching anywhere close to 2 billion.
B) more developed countries have lower birth rates due to a greater education of people- a greater education creates opportunities for choice when it comes to having children, and many decide to delay or not have any.
C) most of these high fertility rate countries lie near the equator, and people generally like to live in warm conditions, which are better suited for farming, and farming families need more hands on the fields (aka more children per family). Further north means less farming and more industrial workers, where less hands are needed to sustain a living.
D) It can cause brain drain, where smart people from other countries emigrate from their home to find better education/economic opportunities (and less competition) in more developed countries
E) In less developed countries, there are a lot more mouths to feed and house, and much less resources to do so, and that means children get pulled out of school early to work and keep families going and alive. In more developed countries, there’s better education, so less births and deaths, and due to more education, better economic opportunities.
F) through anti natalist policies, like the later is better policy in China placed in the 1970s, which promoted marrying and having kids later, and waiting longer between children.
G) Sometimes, these policies can go too far and the nation’s birth rates drop too low and the dependency ratio becomes a problem.
Think like a geographer:
1. the DTM and ETM both predict that the population is going to at least decrease, because of the already declining birth rates and the revival of old diseases that have become resistant to our current treatments and prevention. The DTM predicts a decreasing birth rate because everyone is shifting further along the stages, where there are better economic opportunities and less need to have as many children. We see the results right now, so if the population decreases and then flattens out it is because we have developed better tech, policies, and education for everyone.
2. every single entry in the population change column has stated a decrease in either birth rate or population, so the population will probably continue to slow in the future.
3. he thought that people wouldn’t limit the number of children they have, but they currently are and the birth rates are going down throughout the world.
EQ’s
2.4: A lot of the trends can be attributed to innovation, and people’s ways of overcoming obstacles. Take medicine- modern medicine allows people to live through diseases that would have caused epidemics and killed many. Not only this, but general knowledge and care has increased, causing people to live longer and healthier lives. Less babies and mothers are dying and people are living into their 100’s. Agriculture innovation has also influenced populations- with new tech, more and more people are sustained by a small percentage of farmers. But this tech is replacing the farmers, who now need to go to cities to find work to sustain life.
2.5: The DTM generally doesn’t factor in disasters or any other sudden events, and it provides a general overview of trends. It shows societies as innovation is spread, preventing more deaths and increasing lifespans. It graphs trends that people see over and over again with different regions and or countries that show similar patterns of modernization. The DTM groups together counties into stages, to help organize what their birth and death rate patterns look like, which matches up nicely in terms of modernization. In stage one, many people don’t have access/knowledge of death preventing innovation, and so to make up for that (and for agricultural purposes) there is a high birth rate as well. In the second stage, there are more advancements made to prevent deaths, but the country still needs to expand its population. in the late expanding stages, the death rate finally evens out, and birth rates start declining due to more advancements and higher education for the population- therefore, people choosing to have kids later in life to prioritize education. In stage 4, the birth and death rate meet at a similar point, meaning that there are just enough babies being born to replace the number of people dying.
2.6: Thomas Malthus theorized that people would run out of food because our population would reach a crisis point, and our birth rates wouldn’t change. He believed that food would grow steadily by a similar amount per generation. He also believed that people wouldn’t limit the number of children they had, and we would eventually run into problems of overpopulation. Our populations would increase exponentially, and faster than the rate of food production. He thought that we would run into famine, and increased rates of war, disease, and economic struggles.
2.7: The intent of controlling/influencing births is usually divided between increasing or decreasing the population. The intent of immigration policies can range from preserving national culture, bringing in workforces, or being exclusionary. pronatalist policies try and increase birth rates, and they can work through the government helping families with their children (ie childcare, insurance, etc). It can go too far, but it is something that can be easily monitored and regulated. There are also anti-natalist policies that try and limit the number of children each family has. This also can go too far, which creates a dependency imbalance where there aren’t enough of the future generation to support the aging previous generation. Immigration policies can allow for extremes like the cultural melting pot that america is to the very unique culture that Japan holds.
2.8: As women grow more empowered and are put in increasingly more jobs of many types, often, this affects future generations. There is better literacy, allowing women to have more of a choice when it comes to having children. Many choose to prioritize their work and education first, and decide to have less/no children later in life. Greater access to family planning info allows for fewer unintended pregnancies and larger intervals between children. There are also greater amounts of women in political positions, allowing for them to have a larger voice in the policies that affect them.
2.9: When a population ages, their bodies cannot do what they were able to do easily before. Eventually, these people grow too old and sickly and need assistance and extra care, and the future working generation has to be responsible for that. People also have a desire to retire after a long life of working, and they need to be replaced by either the future generation or new technology. If there are too many old people in ratio to the working population, that causes an imbalance on the dependency ratio. An imbalance can lead to financial struggles, national economic struggles, and personal problems. Older people will have different needs and opinions than those of newer generations, like when it comes to politics, and that can cause conflicts of interest. Also, a larger older population requires more care facilities.