Enthalpy diagrams
Limitations of mean bond enthalpies
They are averages over a range of compounds
Bond enthalpies are always based on the compound being a gas, water is a liquid in its standard state
The value of formation for water and steam will be different
Enthalpy diagrams
As well as Hess’ law, another type of diagram can be used to calculate a range of different enthalpy changes.
These are called enthalpy diagrams
They show the level of enthalpy on the vertical scale
The enthalpies of all elements in their standard states are taken as 0.
Eg H2(g), C(s, graphite)
Carbon has different forms so graphite is used
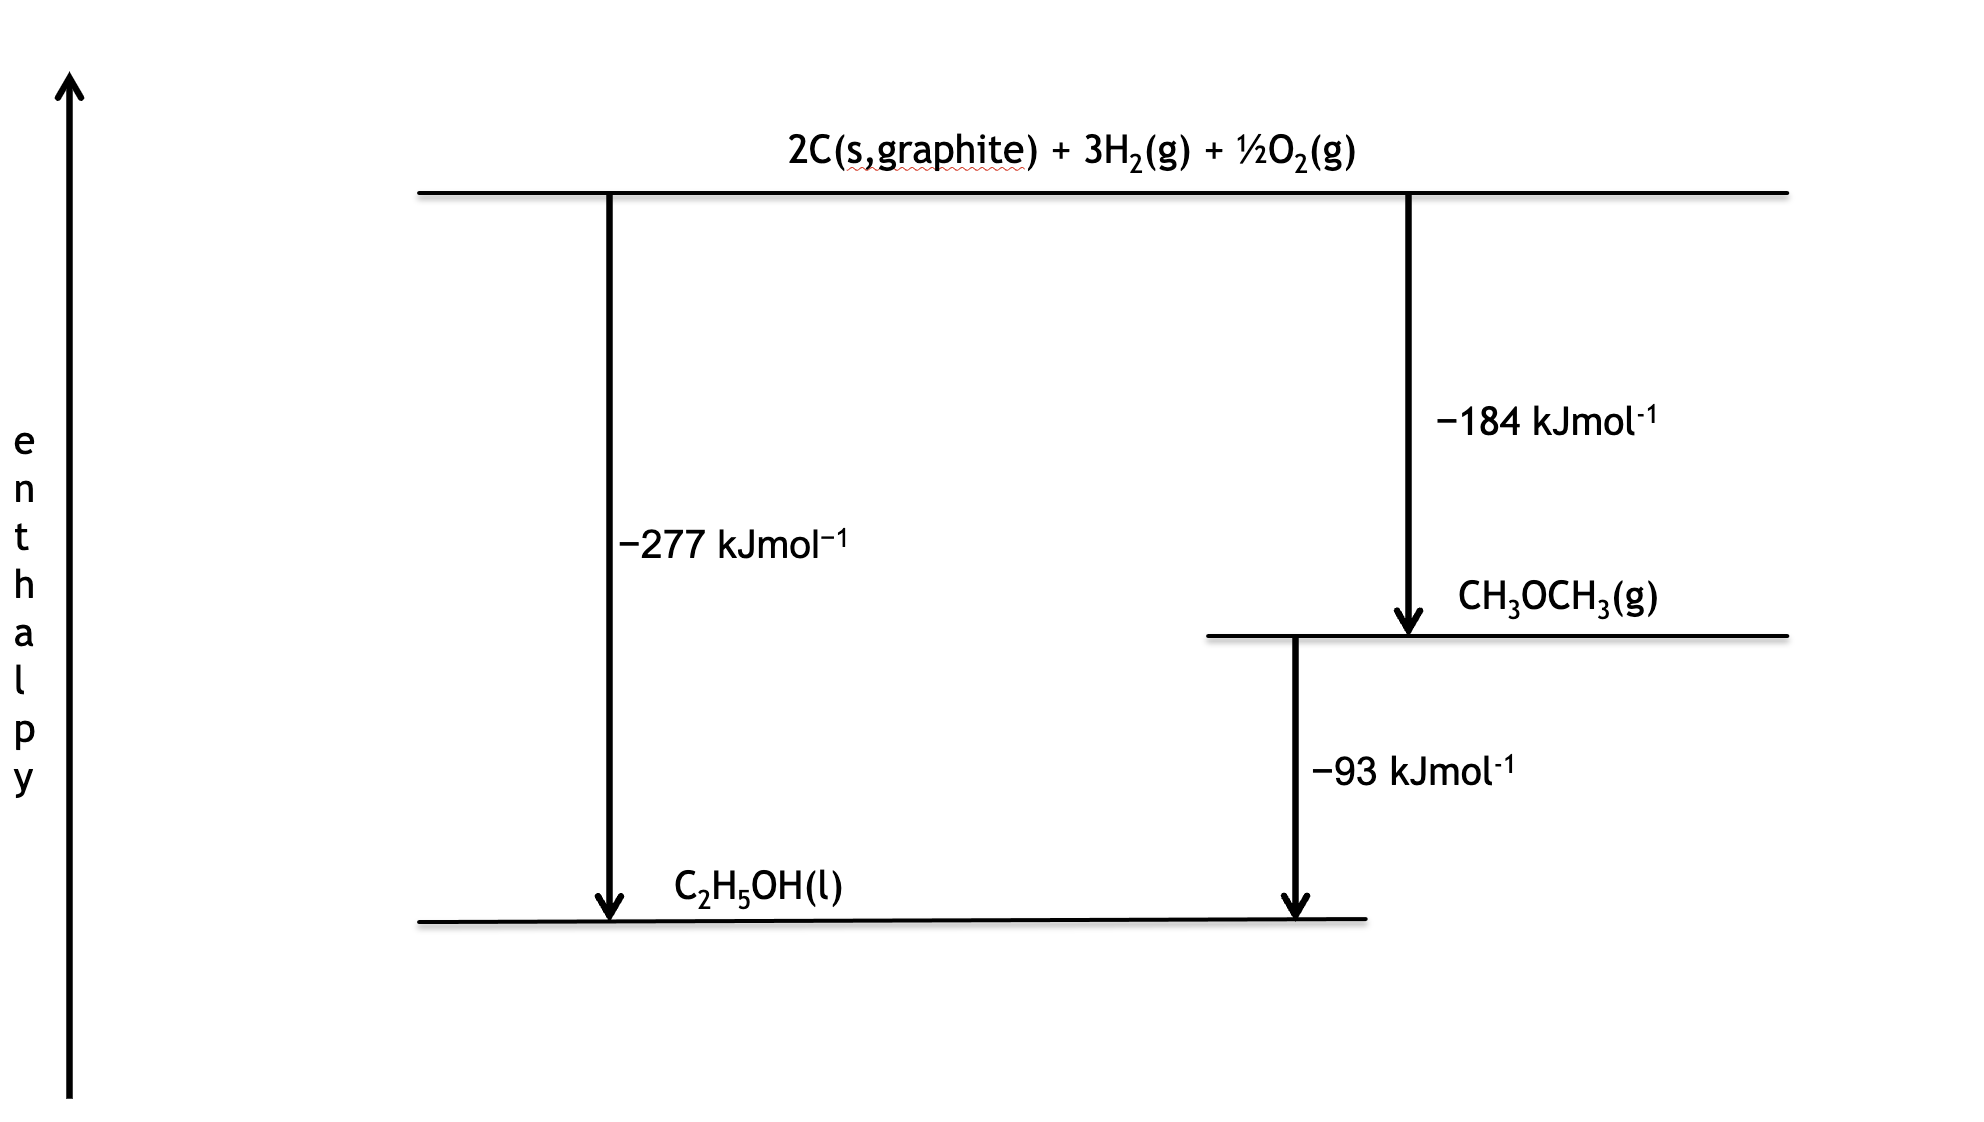
What is the enthalpy change for the following reaction?
CH3OCH3(g) → C2H5OH(l)
Given the enthalpies of formation of
CH3OCH3(g) -184kJmol-1
C2H5OH(l) -277kJmol-1
Draw a line at level 0 to represent the elements
Add the values of enthalpy of formation, remembering negative values go downwards, positive values upwards
Find the difference in levels between the two compounds
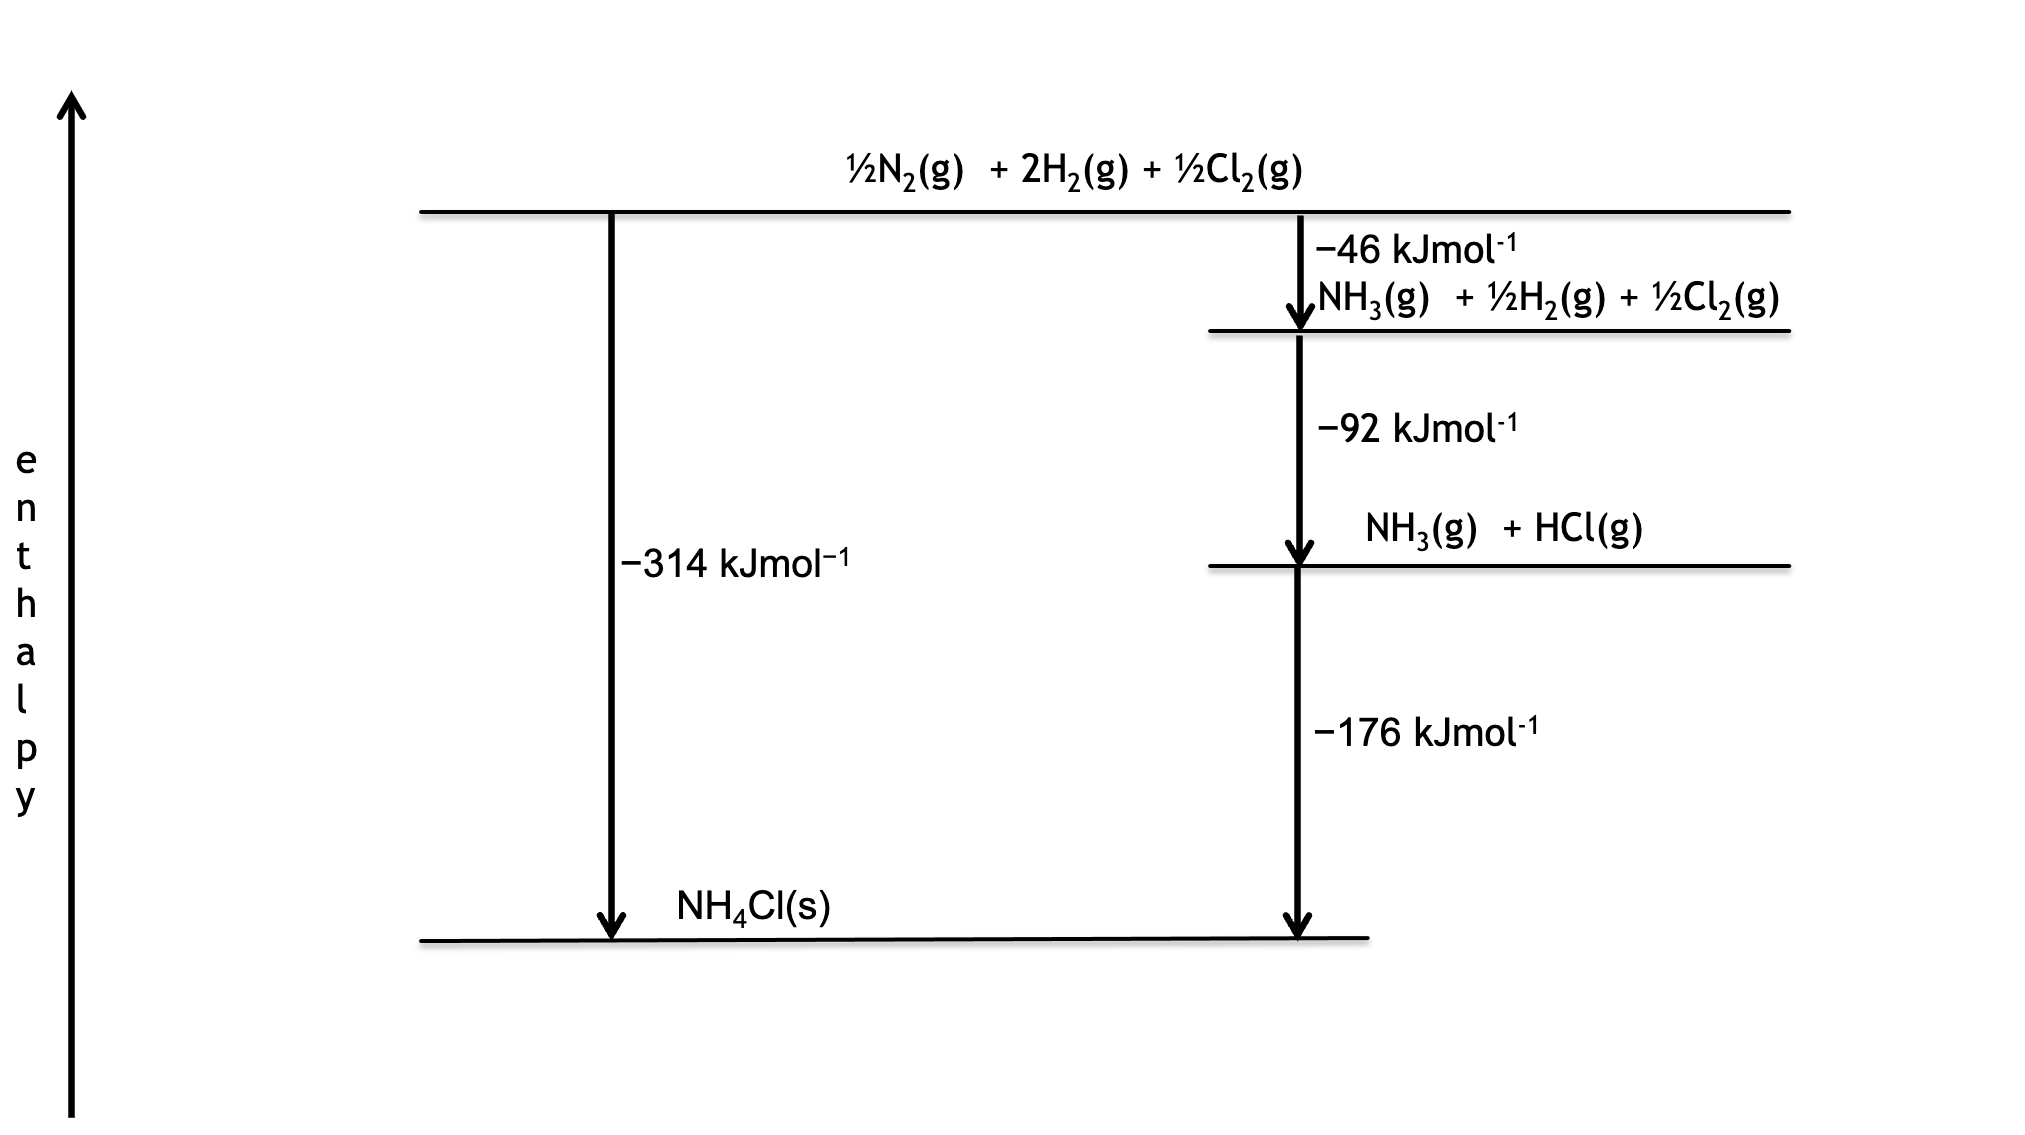
Use an enthalpy diagram to determine the enthalpy change for the following reaction
NH3(g) + HCl(g) → NH4Cl(s)
Given the enthalpies of formation of
NH3(g) -46kJmol-1
HCl(g) -92kJmol-1
NH4Cl(s) -314kKmol-1