L6 Mock Revision - Theme 1 - 1.2
1.2.1 Rational decision making
For microeconomics, it is assumed that:
- Rational consumers: wish to maximize their satisfaction or utility from consumption by correctly choosing how to spend their limited income.
- Rational producers/firms: Wish to maximise profits by producing goods and services that are desired by consumers at the lowest cost.
- Rational government: Wishes to improve social and economic welfare of citizens
1.2.2 Demand
- What is the definition for demand?
- The quantity that purchasers are willing and able to by at a given price in a given time period.
- What is effective demand?
- Demand is only effective it is backed up by the willingness and ability to pay the market price.
- What is the law of demand?
- Demand varies inversely with price - lower prices make goods and services more affordable for consumers and so the demand increases.
- What is the income effet?
- A fall in price increase the real purchasing power of consumers. This allows people to buy more with a given budget. Demand rises with an increase in real income.
- What is the substitution effect?
- A fall in the price of good X makes it relatively cheaper compared to other substitute goods. This will lead to consumers switching to good X, therefore increasing its demand. However, this depends on whether the products are close substitutes or not.l
- What are the Causes of shifts in the demand curve?
- The change in price of a substitute good
- Change in price of a complementary good
- Interest rates: If interest rates are low then people are more likely to take out loans to buy houses and cars and this increases the demand of those things. If interest rates are high then people are less likely to take out loans to buy things as the interest is higher to pay back and so this decreases the demand.
- Changes in the distrubtion of income: a more equal distrbution of income can increase total demand because relatively poor consumers spend a higher proportion of their income. \n
1.2.3 Elasticity of Demand (PED,XED,YED)
What is Price Elasticity of Demand (PED)?
- PED measures the responsiveness of demand to changes in price
What is the FORMULA for PED?
- % Change in Quantity Demanded / % Change in Price
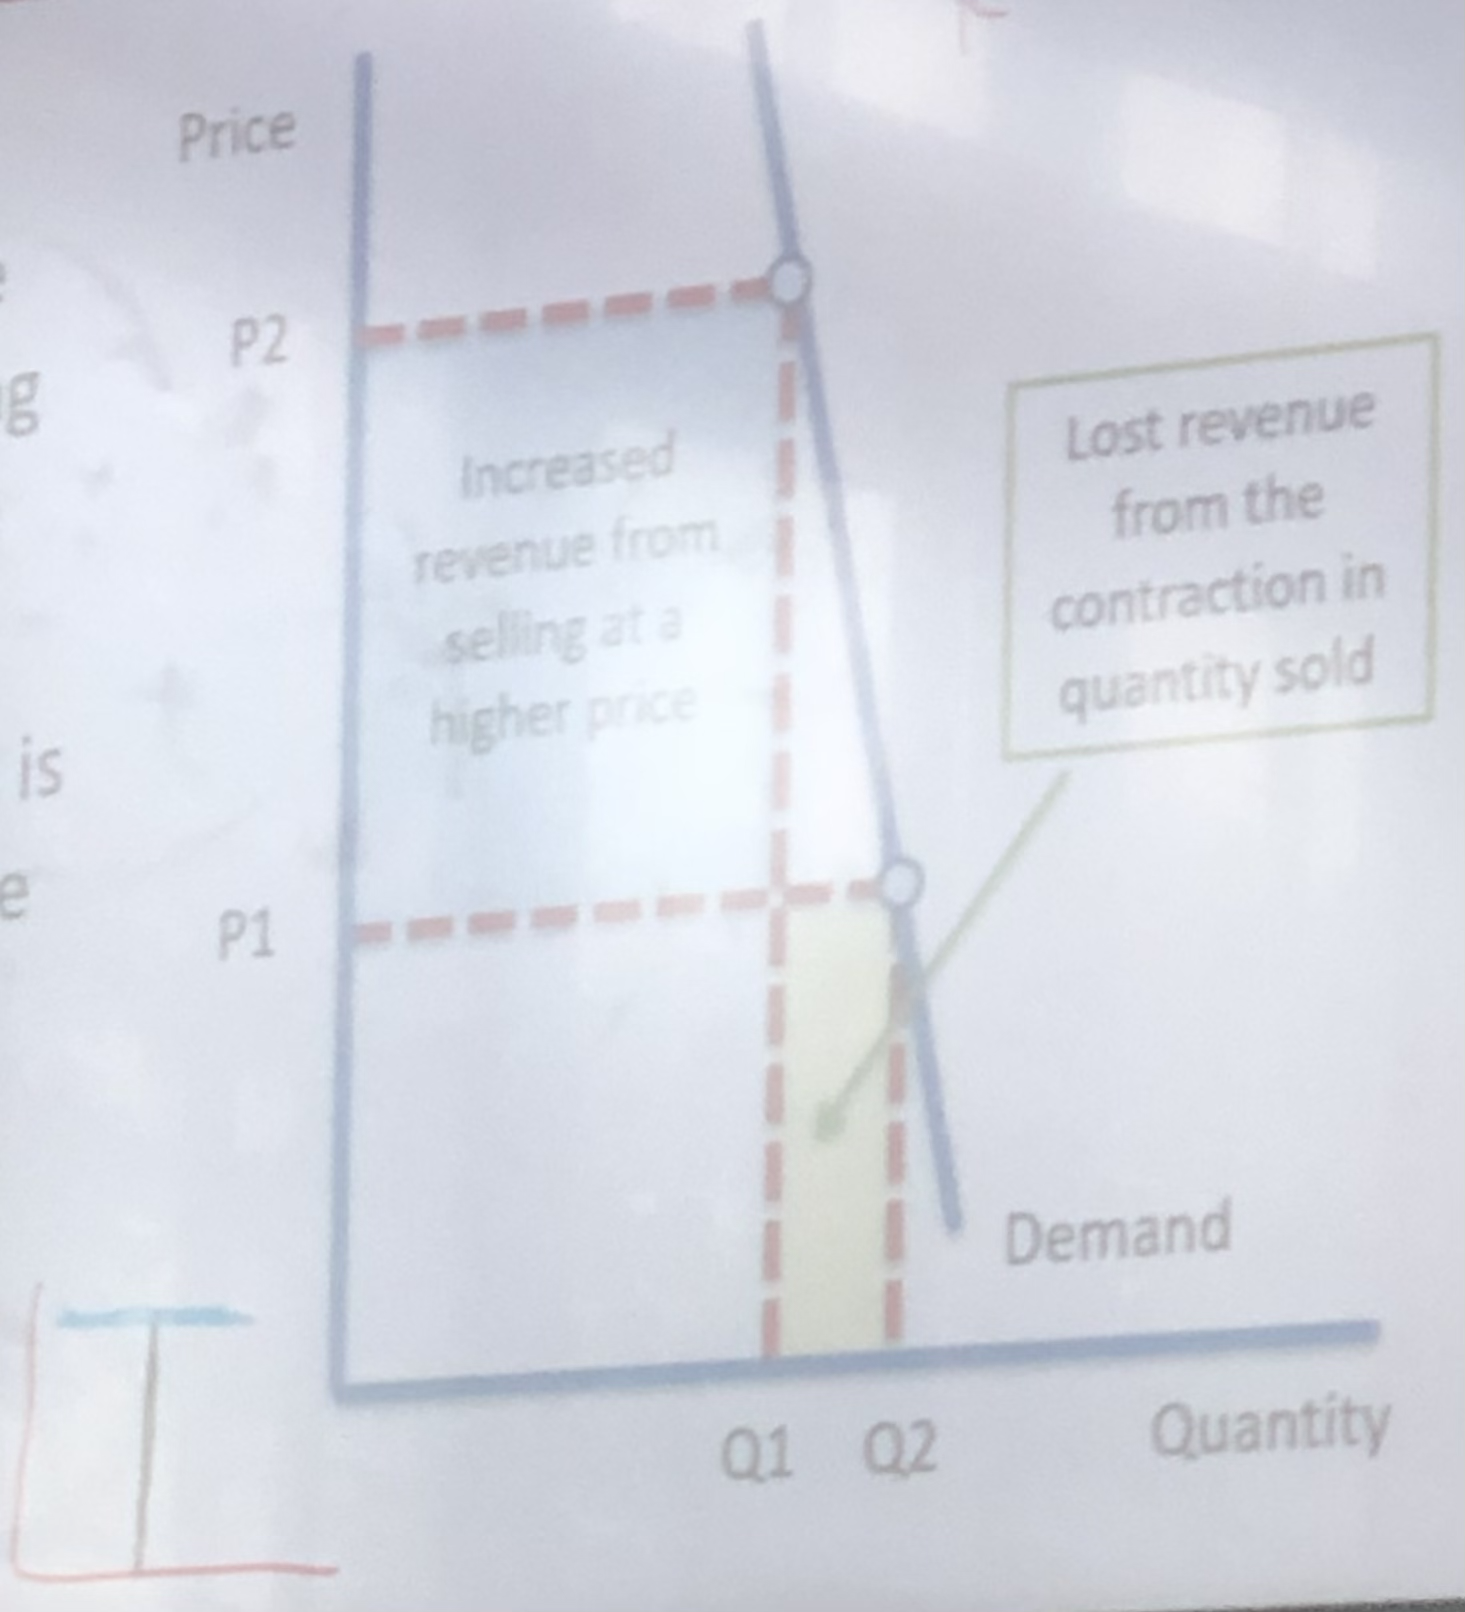
What is meant by INELASTIC demand?
- Inelastic demand means that the PED coefficient is between 0 and 1
- Inelastic demand also means that quantity demand is relatively unresponsive to a change in price
- This means that if PED for a product is inelastic and the business were to raise their prices, the business would see a rise in revenue.
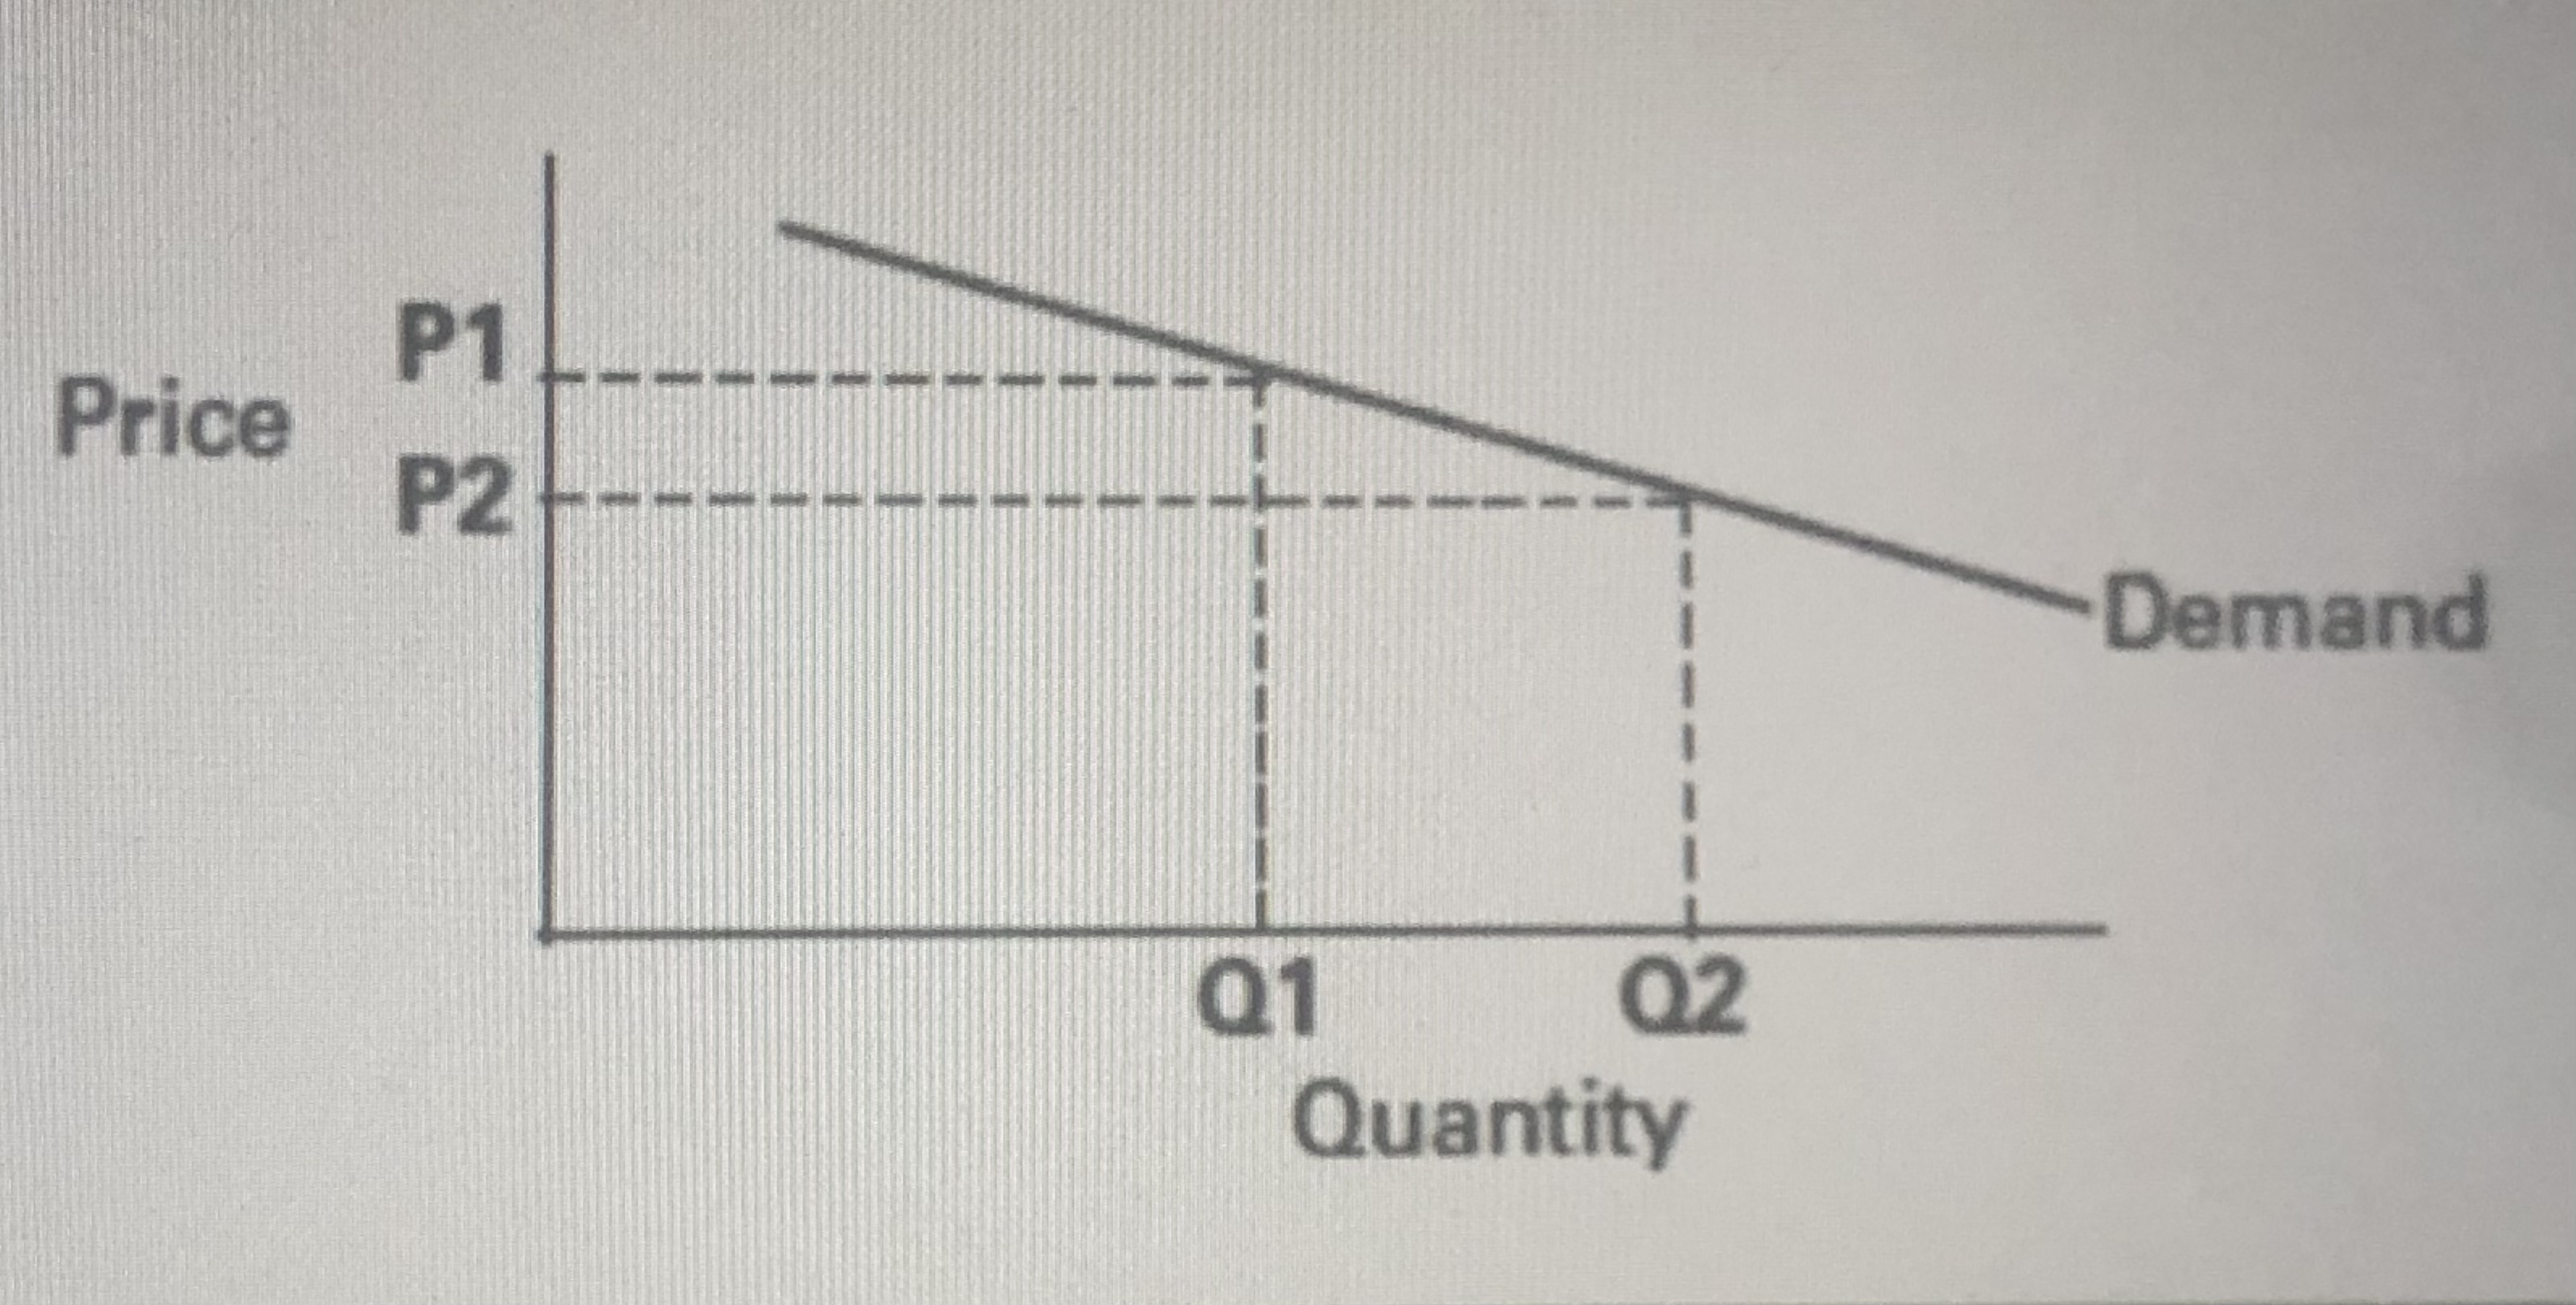
What is meant by ELASTIC demand?
- Elastic demand is when the PED coefficient is between 1 and infinity (or just greater than 1)
- Elastic demand also means that quantity demand is relatively responsive to a change in price.
- A fall in price is likely to lead to an increase in revenue for elastic demand
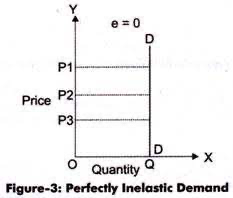
What is meant by PERFECTLY INELASTIC demand?
- Perfectly inelastic demand is when the PED coefficient is exactly 0.
- Perfectly inelastic demand also means that quantity demanded is completely unresponsive to a change in price.
- This implies that customers are willing and able to purchase the product at any price.
 \n
\n
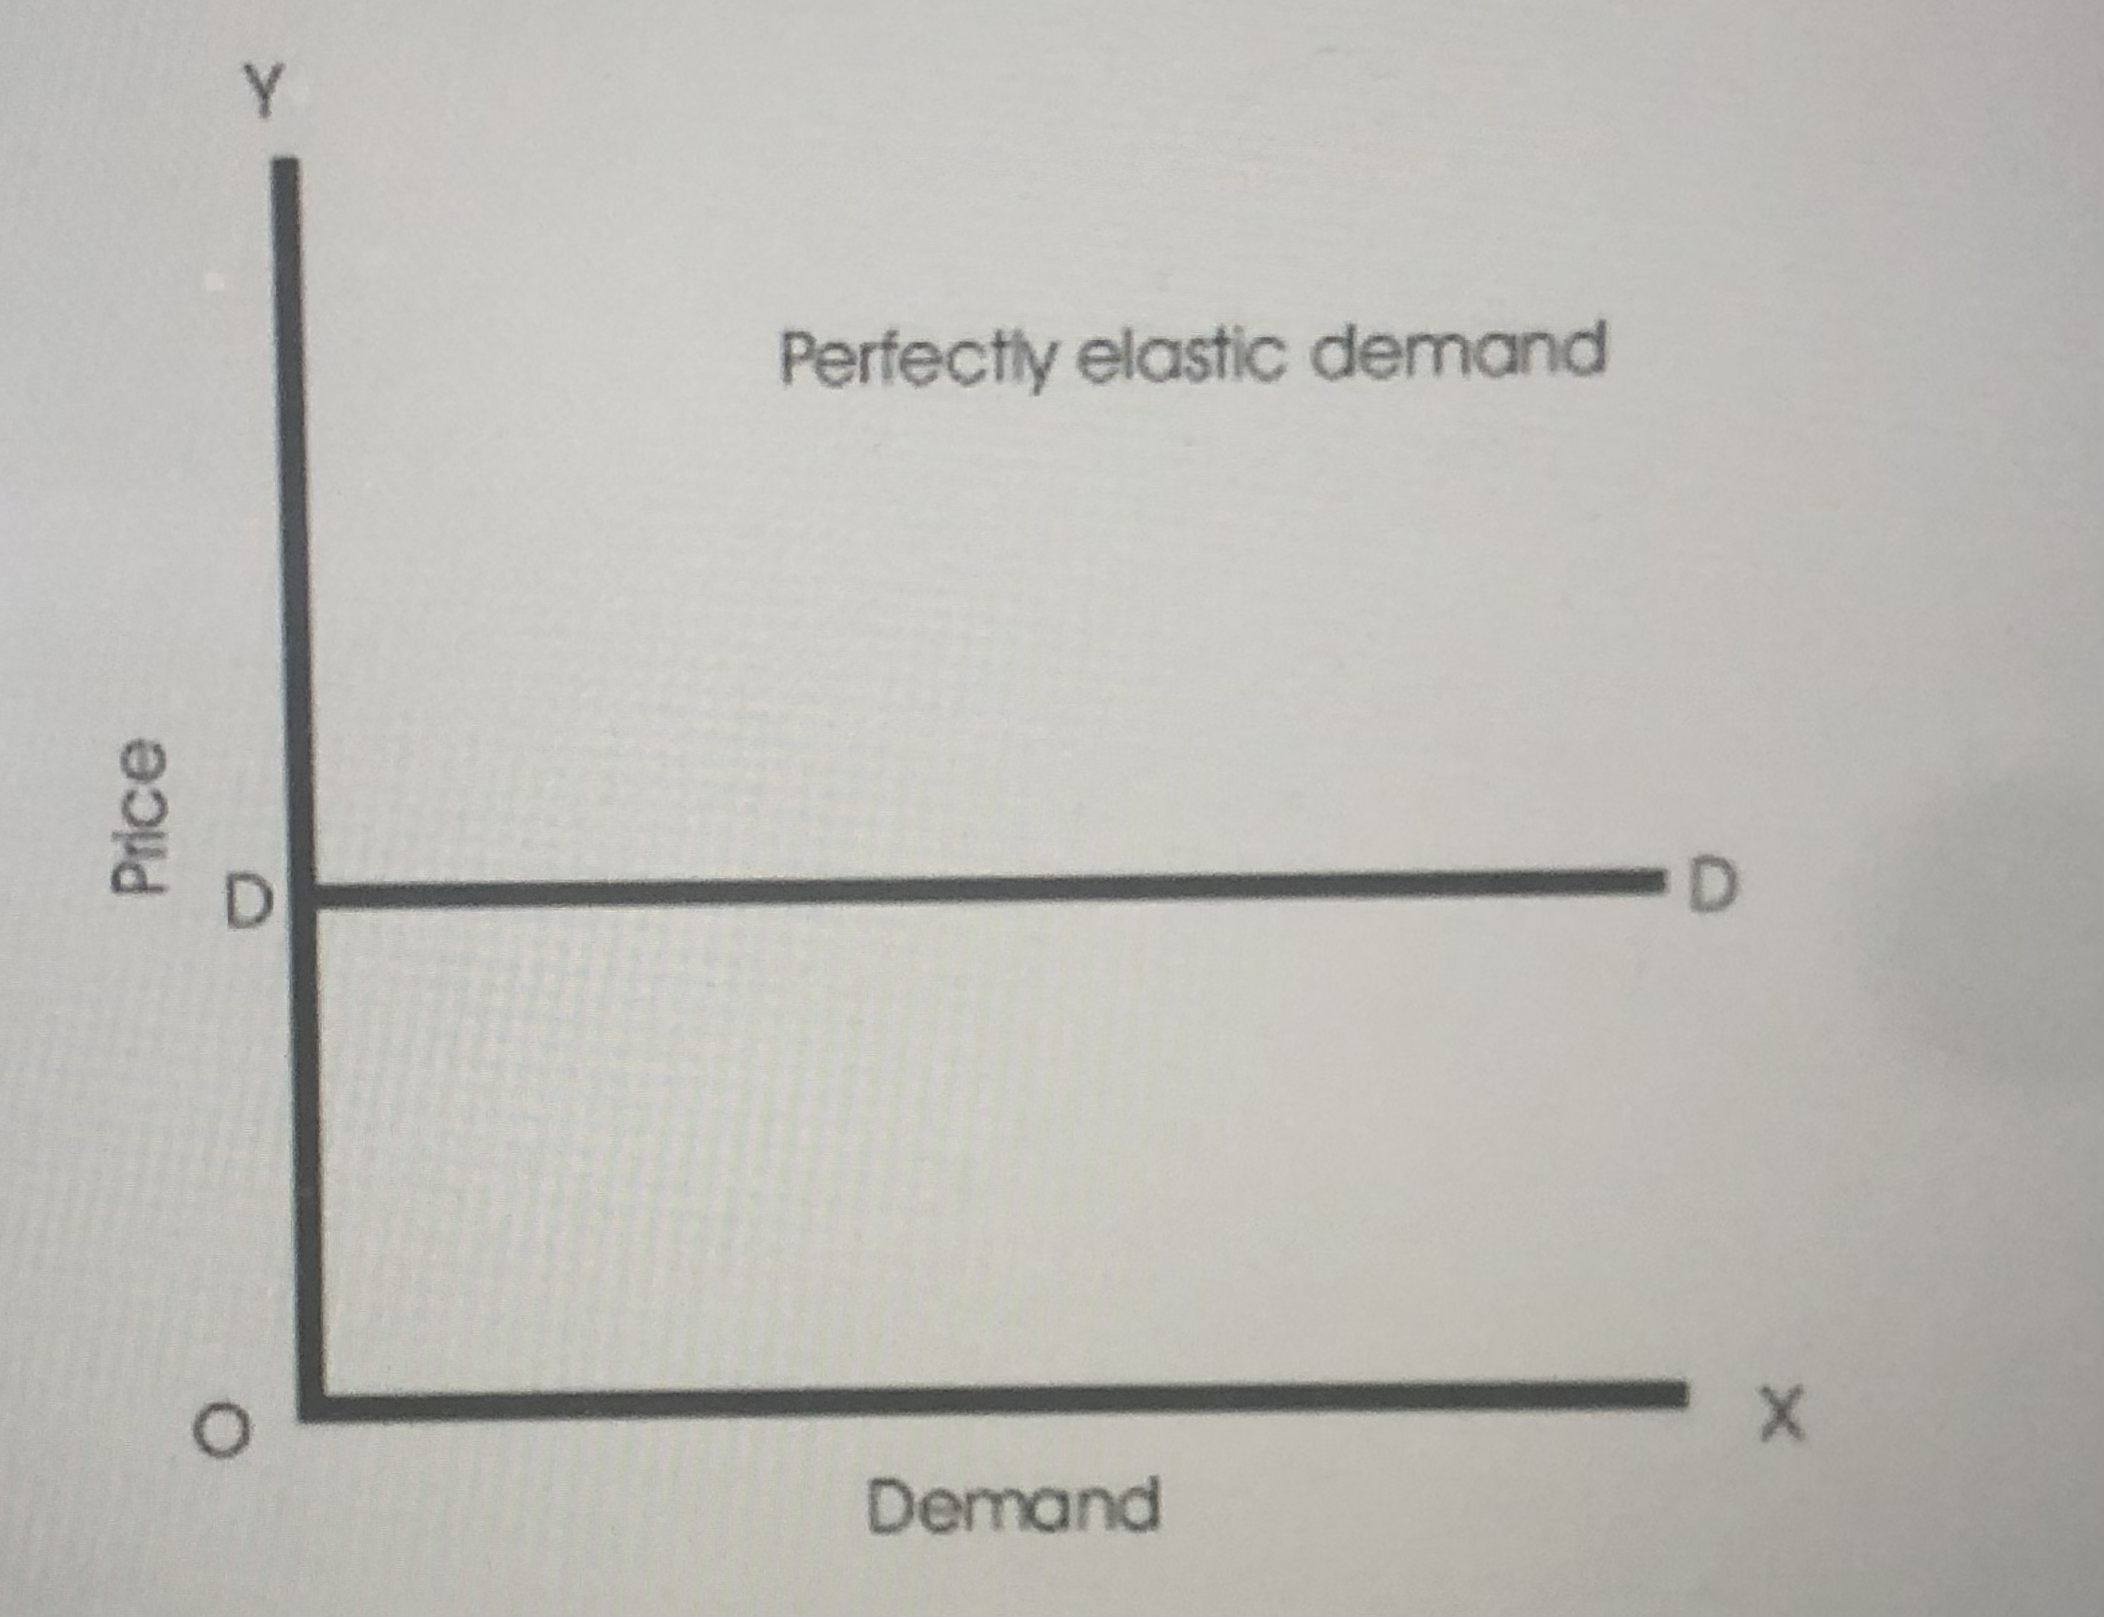
What is meant by PERFECTLY ELASTIC demand?
- Perfectly elastic demand is when the PED coefficient is infinity.
- Perfectly elastic demand also means that quantity demanded is completely responsive to a change in price.
What are the factors determine Price Elasticity of Demand?
- Number of close substitutes availble for consumers - The more close substitutes there are, the more price elastic the demand is. E.g. many brands of breakfast cereal.
- Price of the product in relation to total income - if a high percentage of income is spent on the good (e.g. a new car), demand tends to be more price elastic. However for goods that take up a small percentage of income (e.g. newspapers), demand tends to be more price inelastic.
- Cost of substituting between different products - When substitution or switching costs are high, then demand tends to be more price inelastic. E.g. if it is expensive to switch from one broadband provider to another, the demand for the original provider will tend to be more price inelastic
- Brand loyalty and habitual consumption - High levels of brand loyalty makes demand price inelastic. Persuasive advertising can make demand price inelastic.
- Degree of necessity/luxury - Standard assumption is that necessities are more price inelastic, where as luxuries are an optional spend and so are more price elastic.
What is Income Elasticity of Demand (YED)?
- Income elasticity of demand measures how responsive demand is to a change in real income.
What is the FORMULA for YED?
- %Change in quantity demand/ % change in real income
What is a NORMAL GOOD?
- Goods that will always have a positive income elasticity - Positive YED. As the price falls for normal goods, consumers will buy more of them. Normal goods will have a YED > 0
What is a NECESSITY?
- Goods that are necessities will always have an income elasticity demand between 0 and 1. Necessities are income inelastic, they are relatively unresponsive to a change in income. Necessities are usually things such as fruit and milk.
What are LUXURY GOODS?
- Luxury goods will always have a YED greater than 1. Luxury goods are income elastic. These products have a high and positive income elasticity of demand. These are typically high end products considered as a luxury by the relevant group of consumers.
What are INFERIOR GOODS?
- Inferior goods will have a negative YED. If a good is an inferior good, then, following an increase in income. less of the good will be demanded. However, when real incomes are falling during a period of recession or if wages are rising more slowly than prices, the demand for inferior goods will rise. Inferior goods are usually things such as pot noodles.
What is Cross Price Elasticity of Demand (XED)?
- Cross price elasticity of demand measures the responsiveness of demand for good X after a change in price of related good Y.
What is the FORMULA for XED?
- %Change in quantity demanded of good X / % Change in price of Good Y
What is a SUBSTITUTE GOOD?
- Substitute goods are goods that are in competitive demand. With substitutes, an increase in the price of one good, ceteris paribus, will lead to an increase in demand for the rival good. The XED for two substitutes will always be positive.
What are COMPLEMENT GOODS?
- Complement goods are goods that are in joint demand. A fall in the price of one product, ceteris paribus, will lead to an increase in demand for the complementary good. The XED for complementary goods will always be negative.
What happens when two goods are CLOSE SUBSTITUTES?
- Close substitutes have a highly positive XED coefficient. E.g. a small change in relative price causes a big switch in consumer demand
What happens when two goods are CLOSE COMPLEMENTS?
- Close complements have a highly negative XED coefficient. For example, a console and a console game.
What happens when two products are UNRELATED GOODS?
- Unrelated products have a XED coefficient of 0.
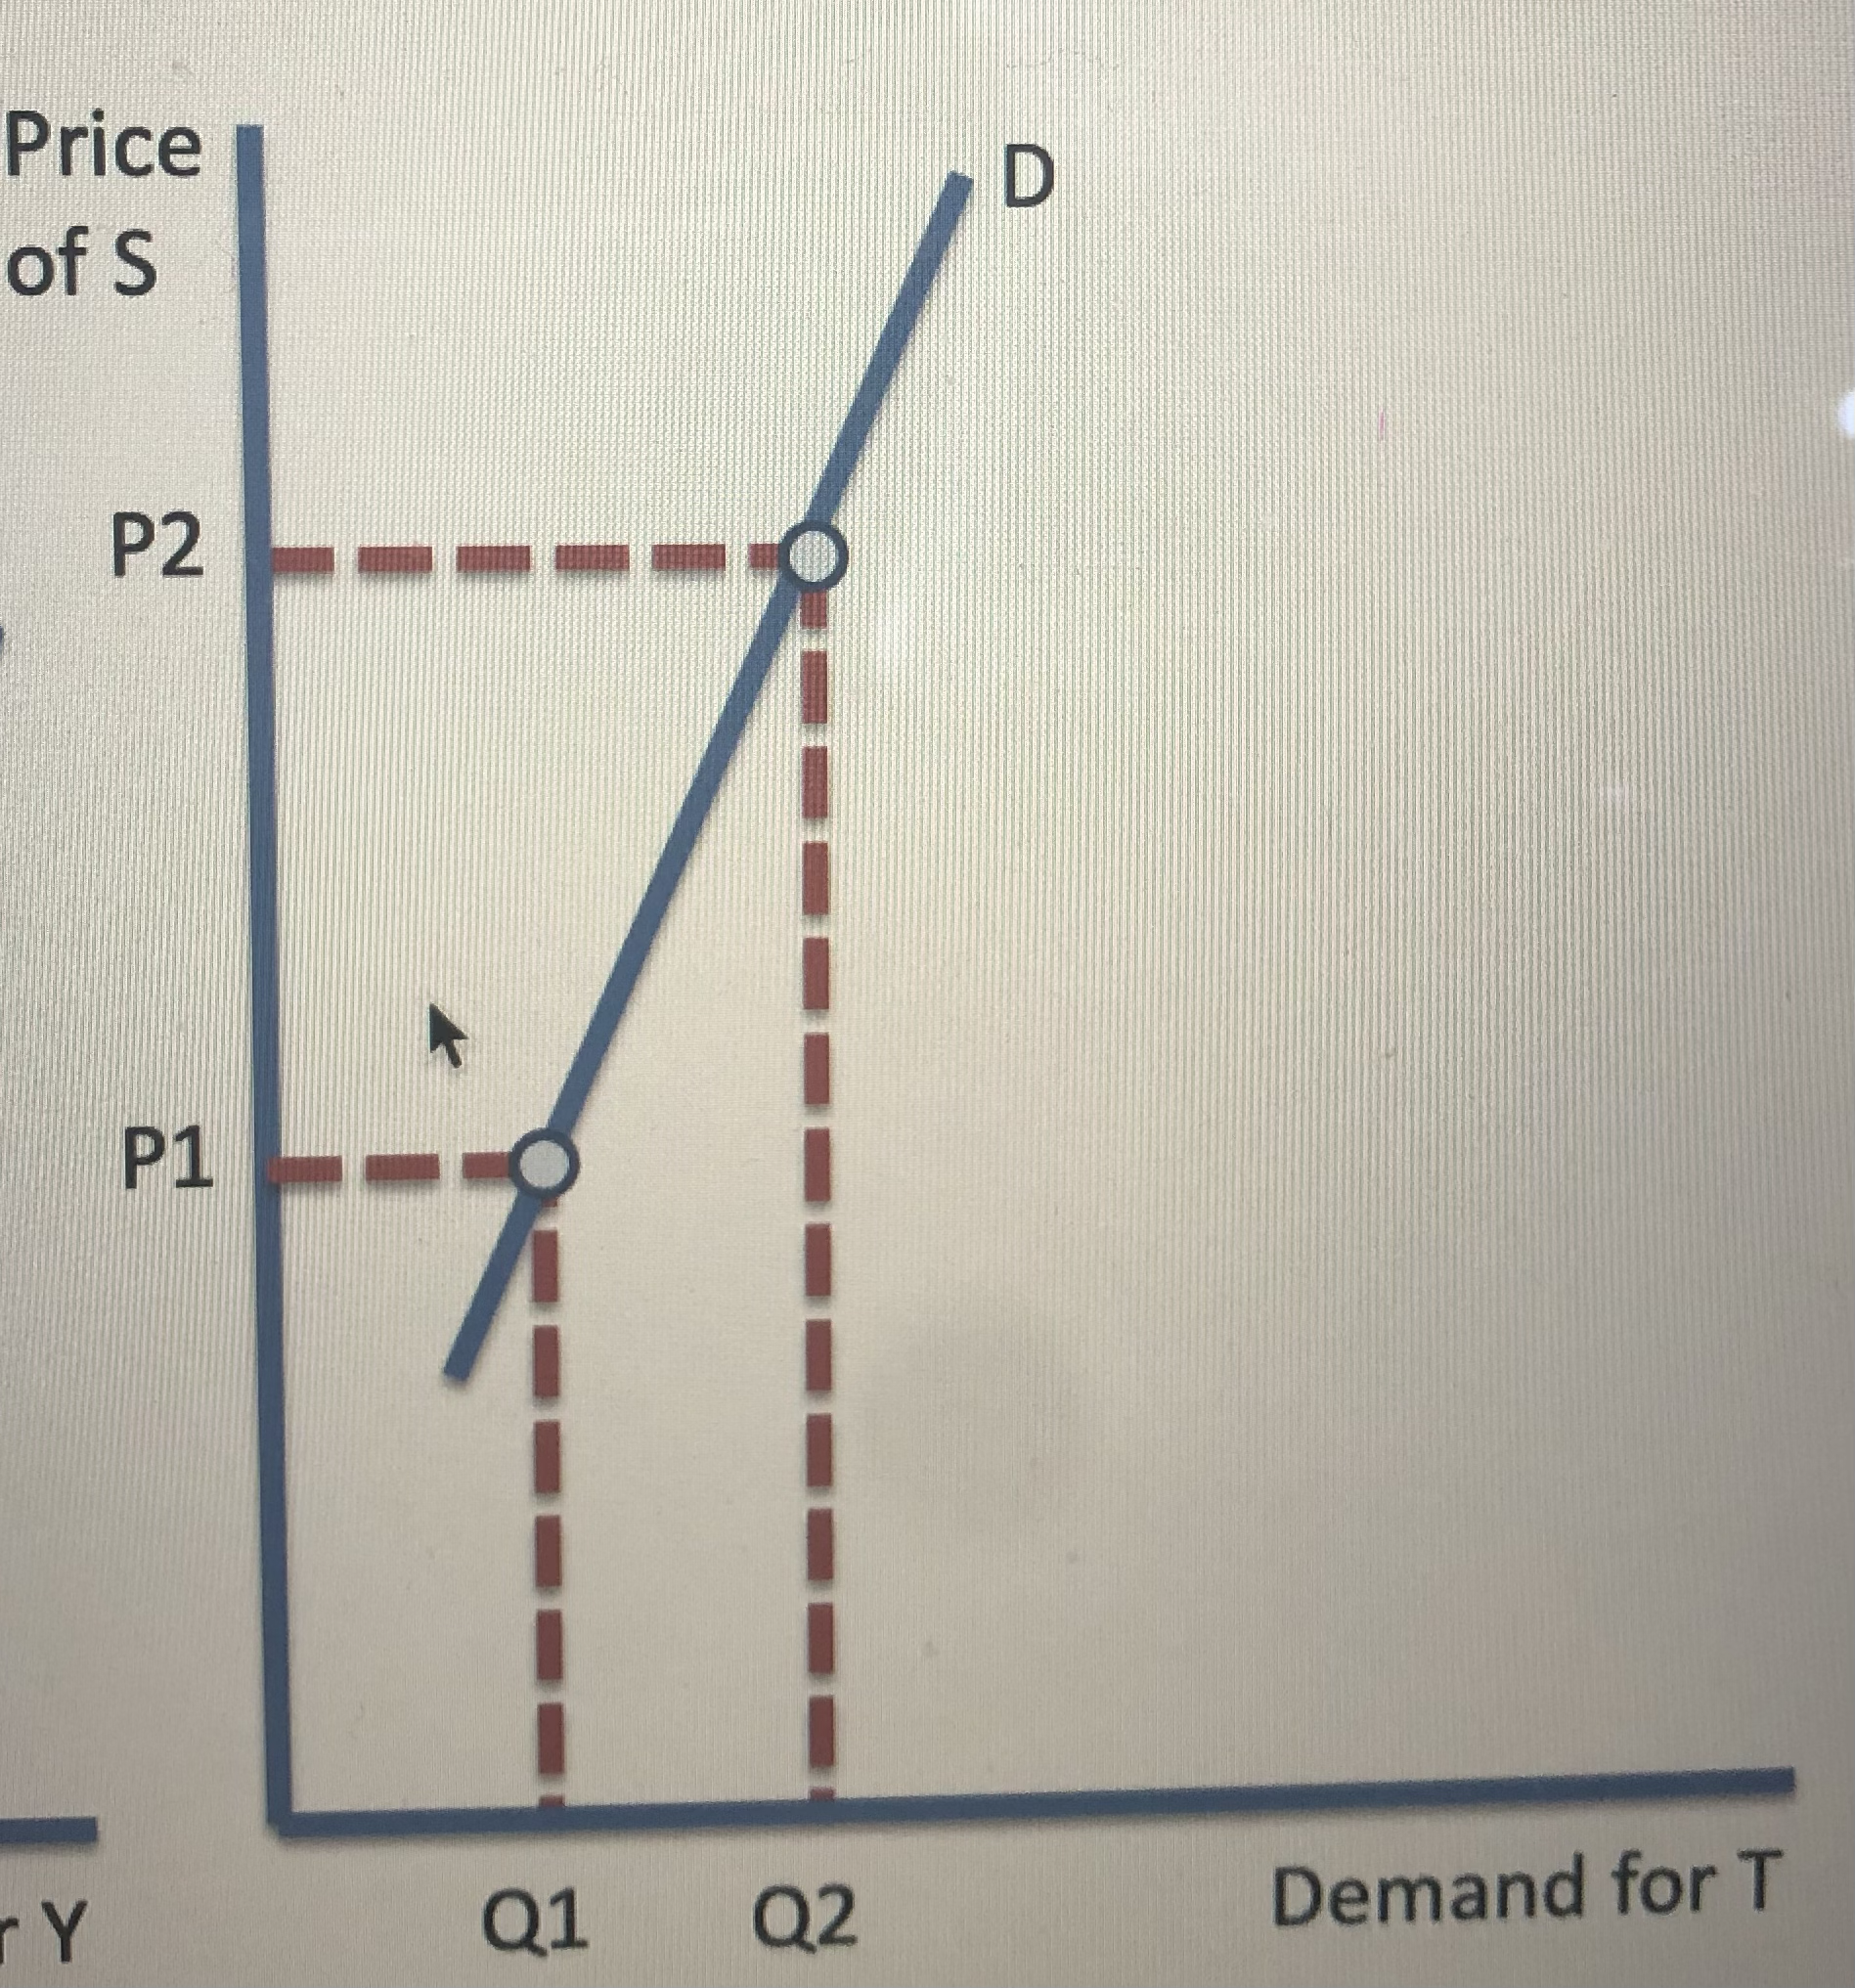
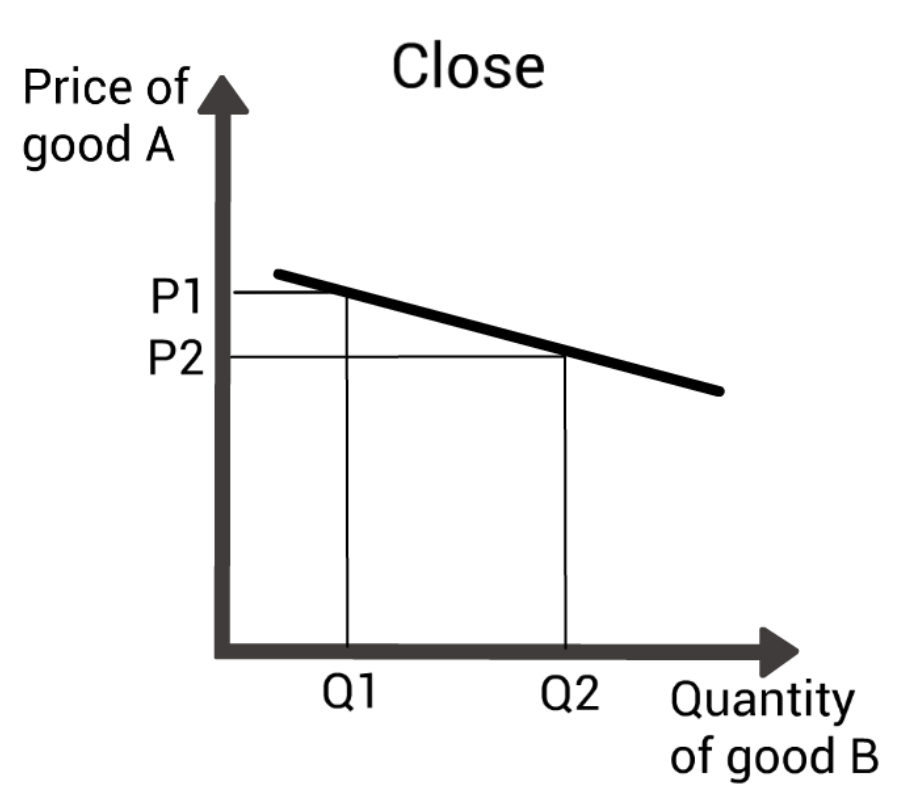
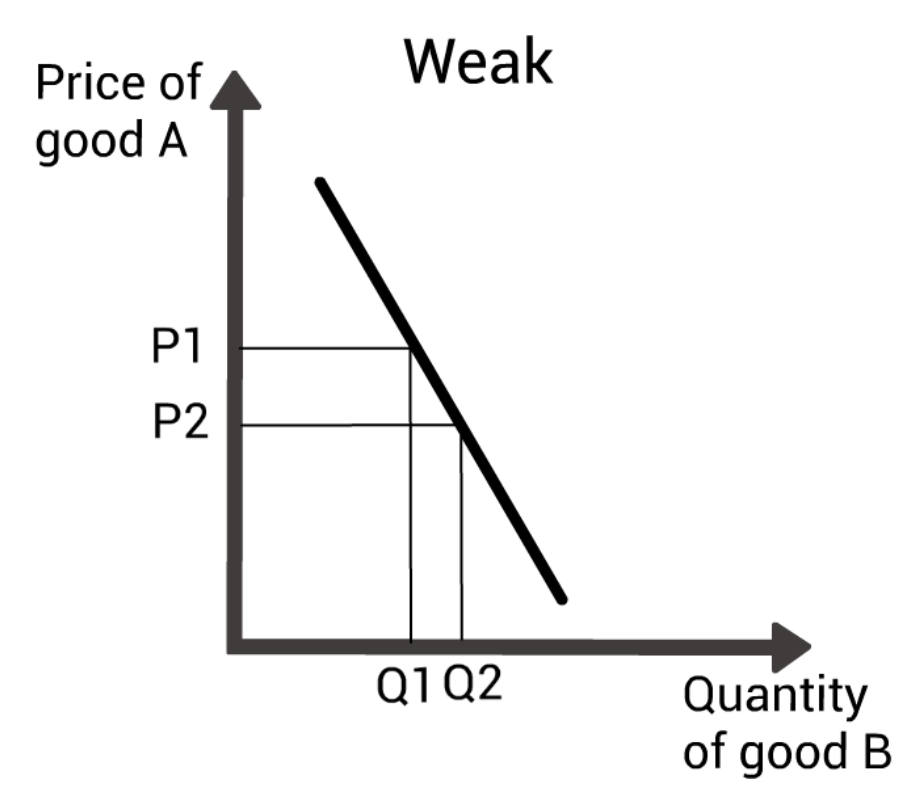
Close and weak substiute and close and weak complement diagrams
Close substitutes - a small rise in price of X will cause a large rise in demand for Y
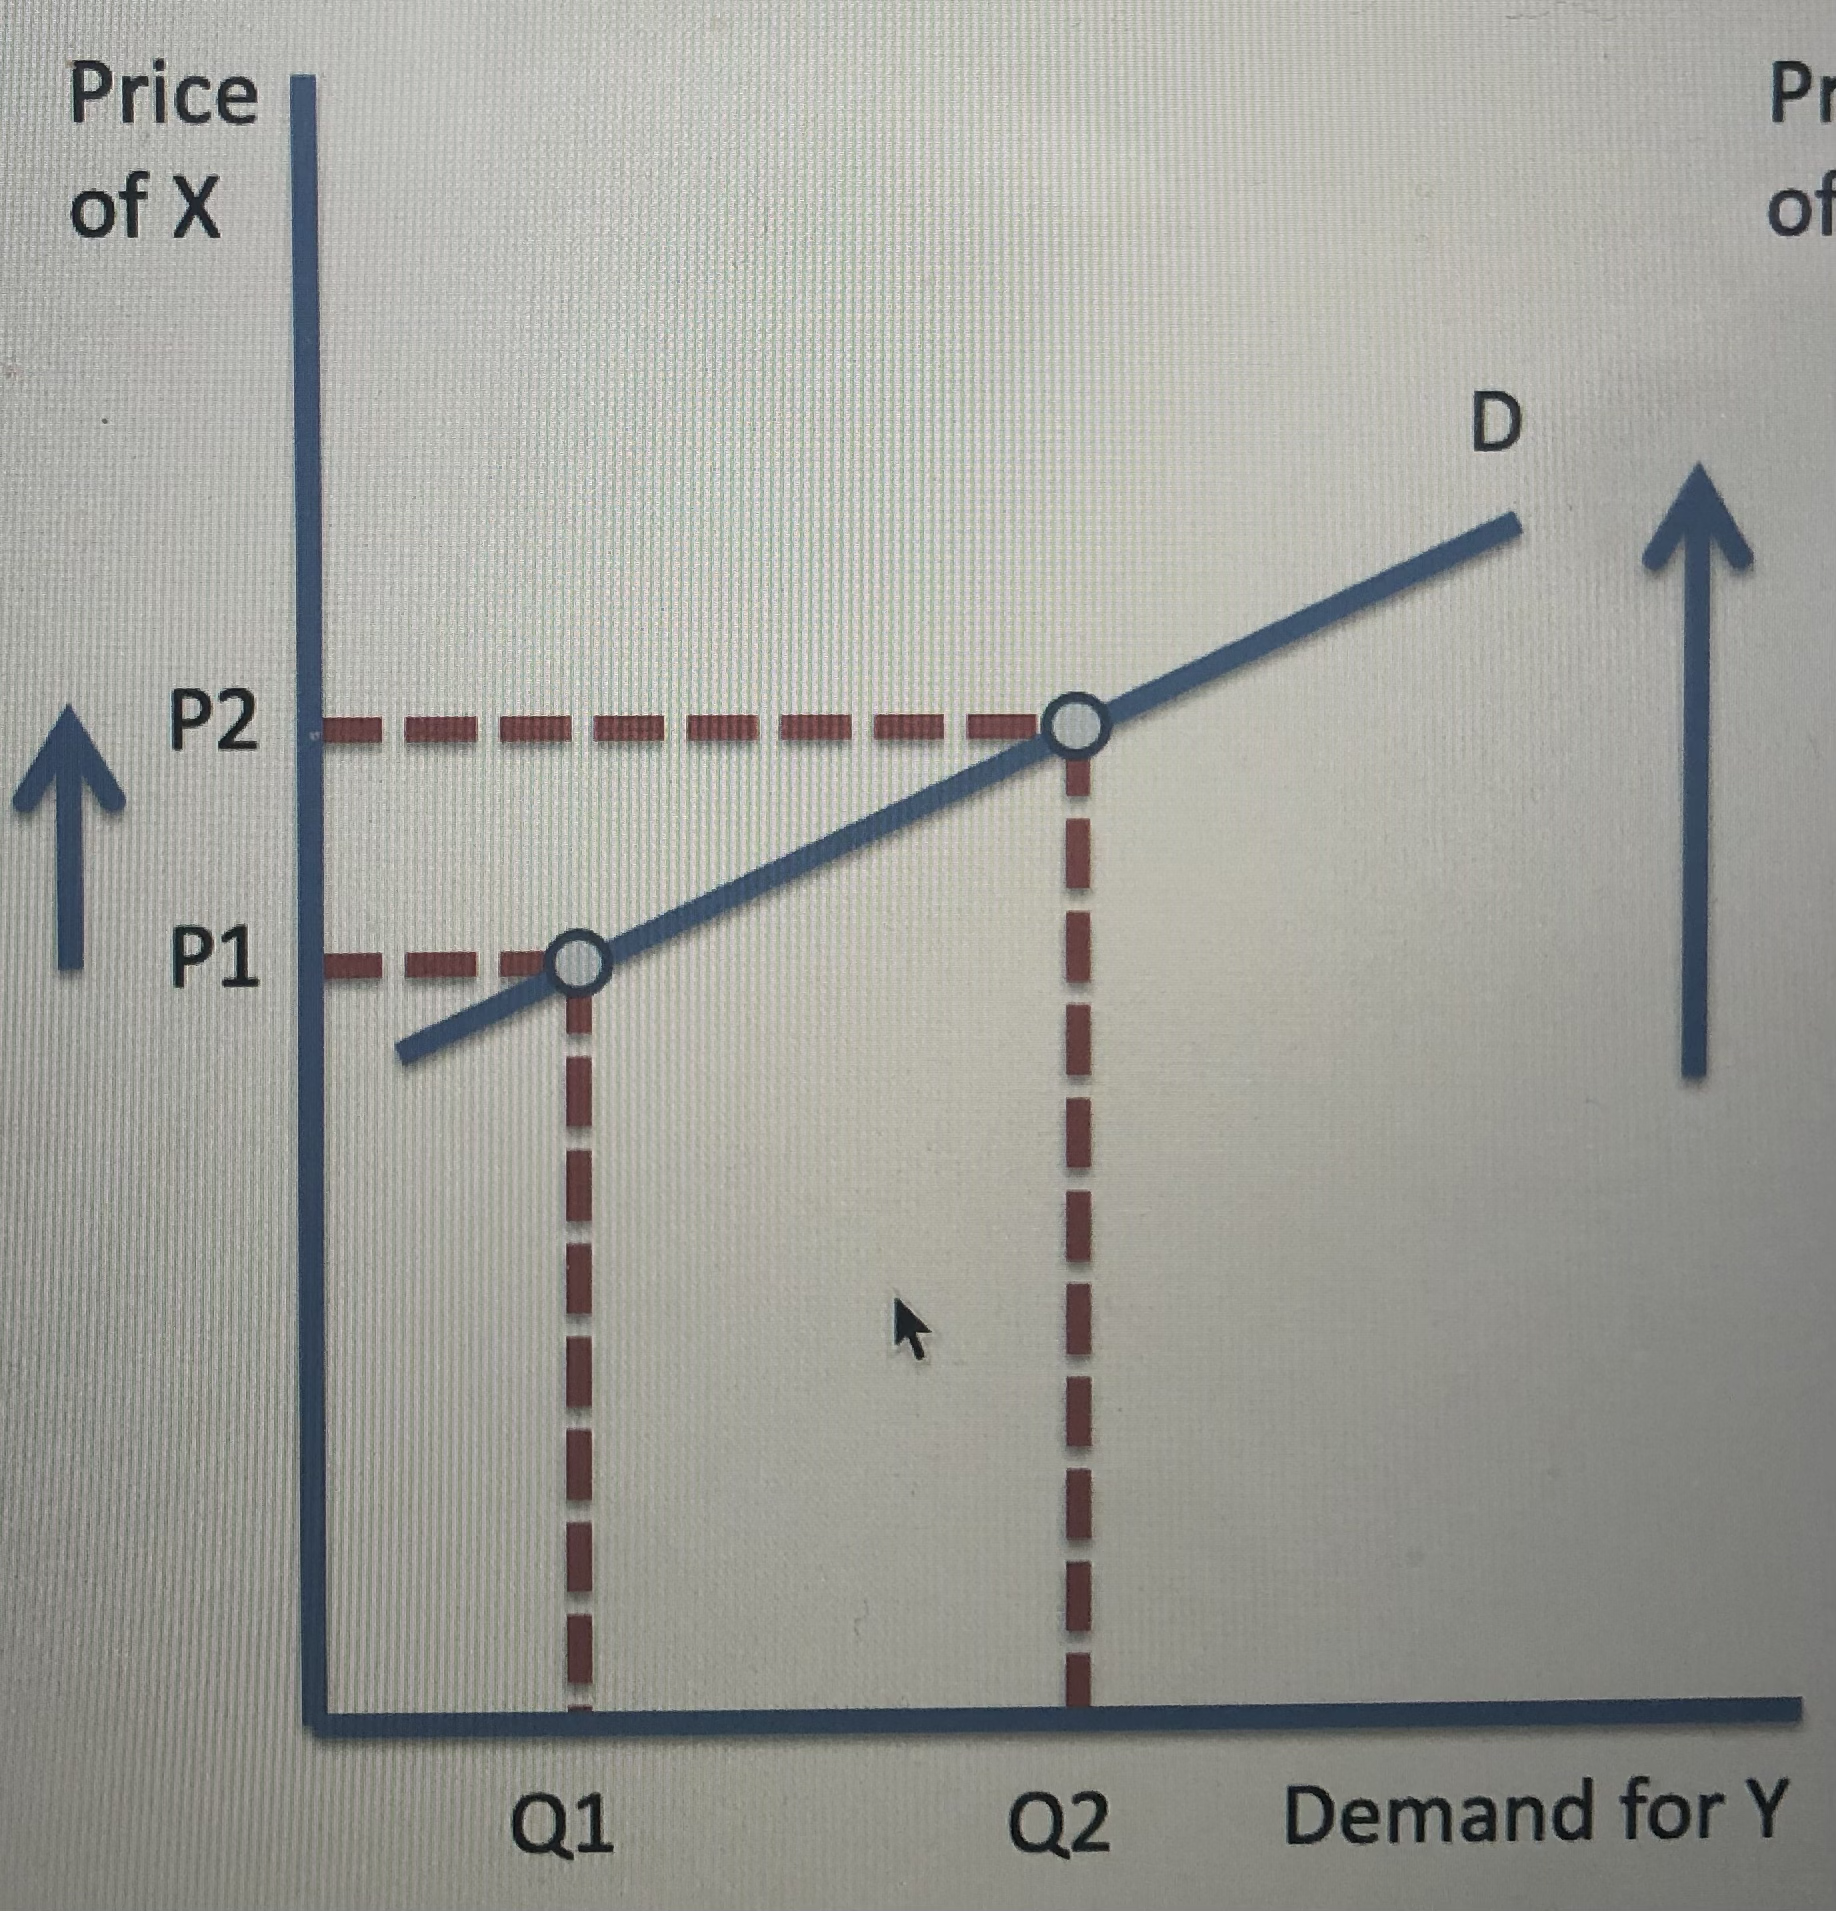
Weak substitutes - a large rise in the Price for S will lead to a small rise in the demand for T
Close complements - a small fall in the price of Good A will lead to a large rise in demand for Good B
Weak complements - A large drop in the price of A will cause a small rise in the demand for B
1.2.4 Supply
- What is MARKET SUPPLY?
- Supply is the quantity if a good or service that a supplier is willing and able to supply onto the market at a given time in a given time period.
- What is the BASIC LAW OF SUPPLY?
- The basic law of supply is that as the price of a product rises, businesses will expand supply of that product to the market.
- What does a SUPPLY CURVE show?
- A supply curve shows the relationship between market price and how much a firm is willing and able to sell.
- What are the reasons WHY A SUPPLY CURVE IS DRAWN UPWARD SLOPING?
- The profit motive - If the market price rises following an increase in demand, it becomes more profitable for businesses to increase their output in the short run.
- Production costs - when output expand, a firm’s production costs are likely to rise and so pass on the extra costs of production by charging the consumers a higher price, to cover the extra costs of production.
- New entrants coming into the market - Higher prices creare an incentive dfor other businesses to enter a market leading to an increase in total supply.
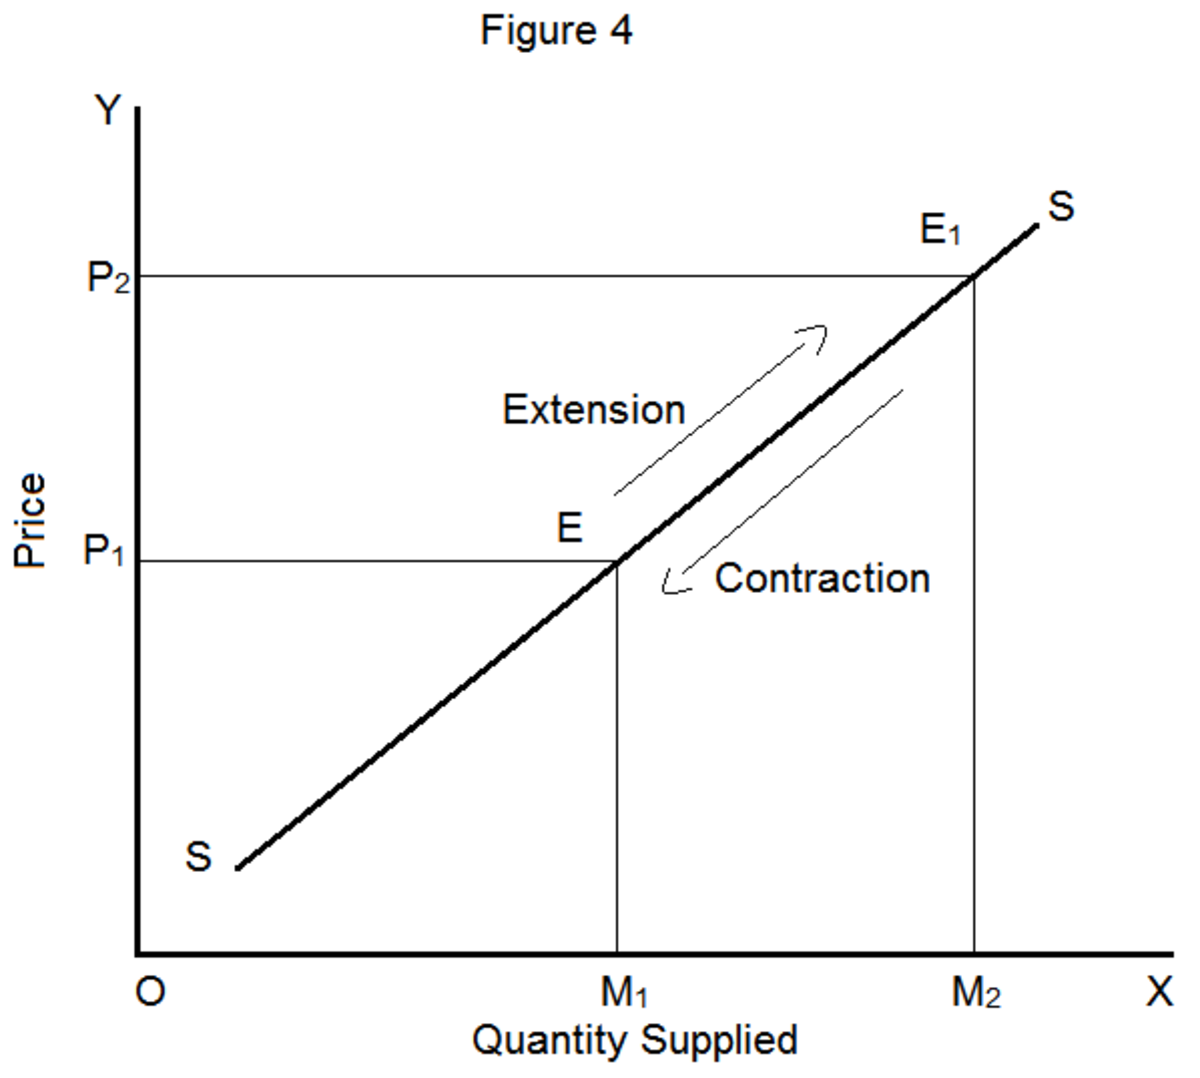
- When is there A MOVEMENT ALONG THE SUPPLY CURVE?
- There is a movementy along the supply crve for a good only when there is a change in its price. A rise in price causes an extension of supply,_and a fall in price causes a contraction in supply._
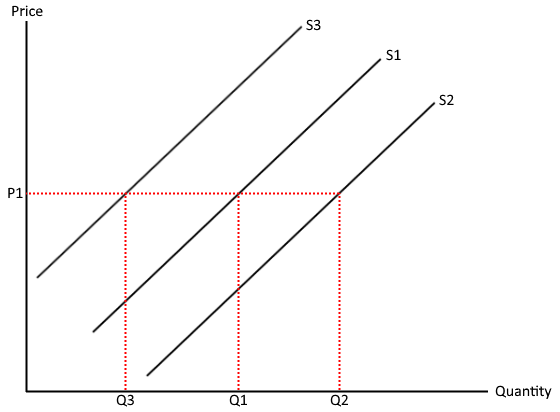
- What causes SHIFTS IN THE MARKET SUPPLY CURVE?
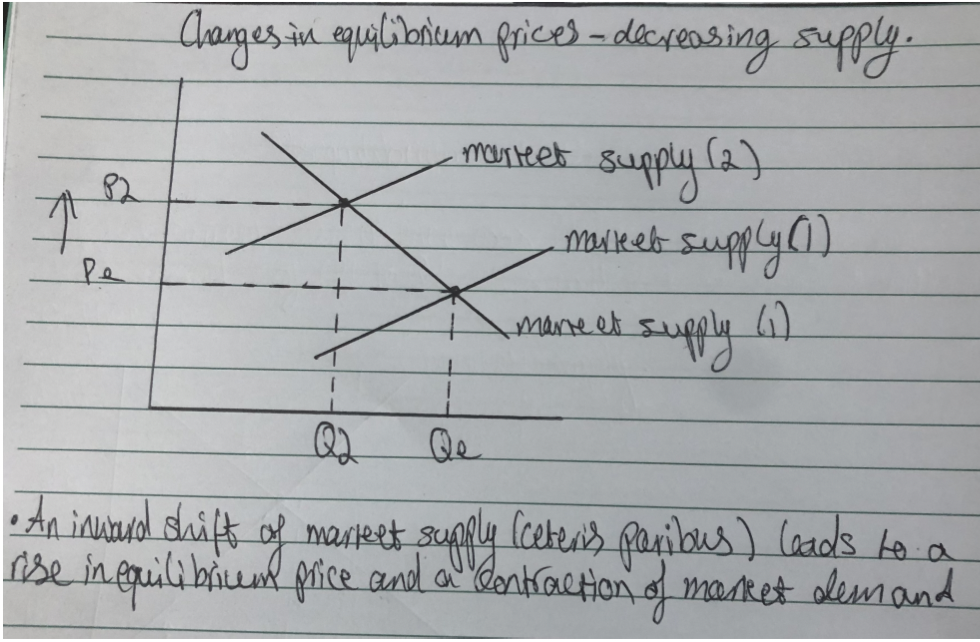
- An increase in supply refers to the whole supply cirve shifting outwards to the rights at every price level. A decrease in supply refers to the whole supply curve shifting inwards to the left at every price level. Increases or decreases in supply occur due to other factors apart from the goods own price.
- Changes in the unit costs of production - lower unit costs of production mean that a business can supply more at each price level which will lead to higher levels of productivity and so an outward shift in supply.
- Advancements in production technologies - advancements in production technologies will cause an outward shift in supply as they will either make the production process cheaper or more efficient
- Favourable weather conditions - for agricultural products, good weather means more supply as more of the product is produced. Bad weather means less supply as less of the product is produced.
- Taxes, subsidies and government regualtions - taxes will causes an inward shift in the supply curve as the firm will be taking less of the profit, and so it will become less profitable for them to continue supplying at that level. Subsidies will cause an outward shift of the supply curve as the government gives the producer money to continue producing the products and so lowers the cost of production that the producer faces, and so is able to supply more at each price level. Government regulations will cause an inward shift on the supply curve as the producer will have to do more inspections on their production process and products to see if they meet the regualtions, thus reducing productivity and increasing the costs of production that the firm will face and so decreases the amount that the producer will supply at each price level.
- What is JOINT SUPPLY?
- Joint Supply is where an increase or decrease in the supply of one good leads to an increase or decrease in the supply of a by product.
- Example - An expansion in beef production will lead to a rising market supply of beef hides.
1.2.5 Elasticity of Supply
- What is PRICE ELASTICITY OF SUPPLY (PES)?
- Price elasticity of supply measures the responsiveness of supply to a change in price
- What is the FORMULA for PES?
- %Change in quantity supplied/%Change in price
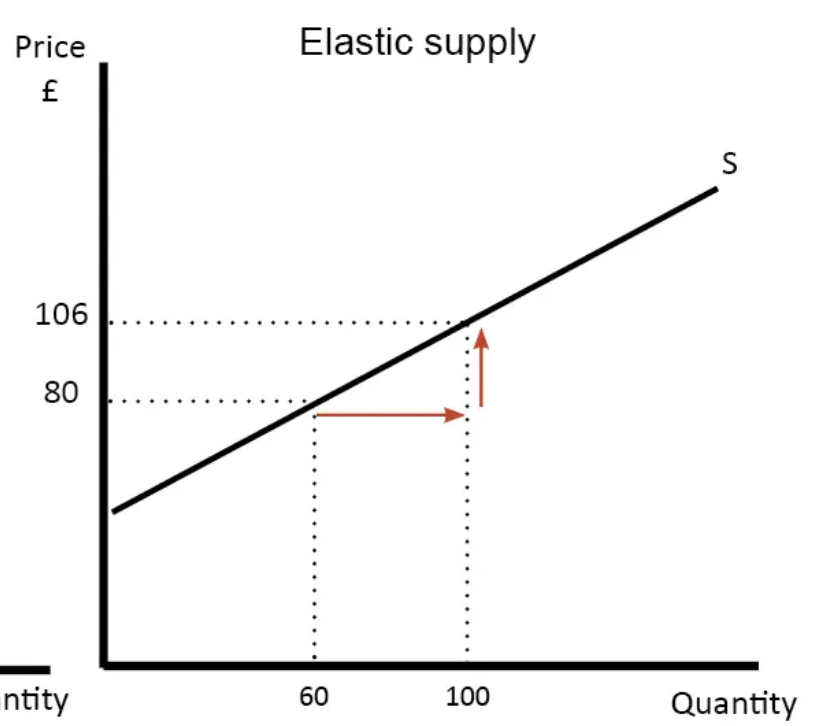
- What happens IF SUPPLY IS ELASTIC?
- If supply is price elastic, producers can increase their output without a rise in cost or time delay
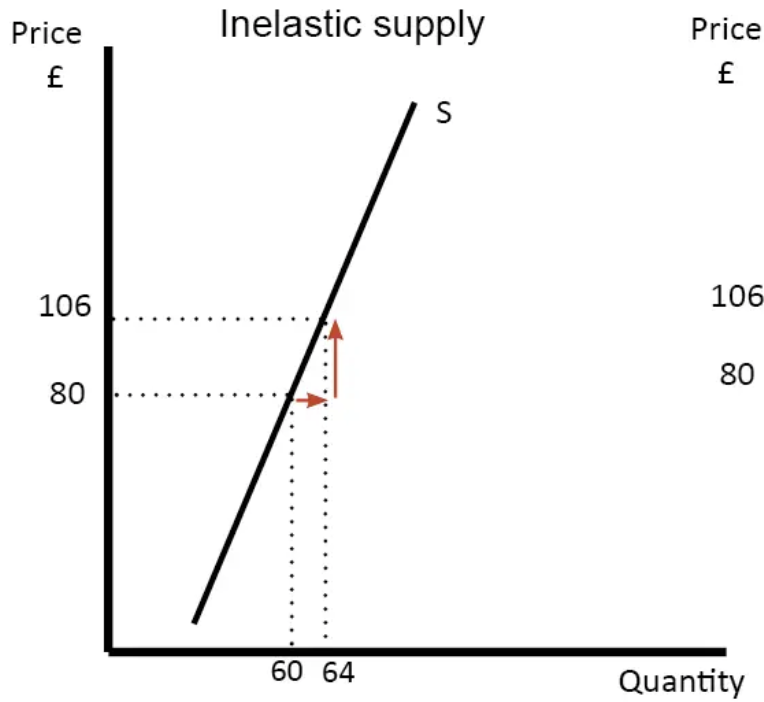
- What happens IF SUPPLY IS INELASTIC?
- If supply is price inelastic then producers will find it hard to change their production in a given time period.
- What happens WHEN PES IS GREATER THAN 1?
- When PES is greater than 1, then supply is price elastic. Change in demand can be met without a large rise in price.
- What happens WHEN PES IS BETWEEN 0 AND 1?
- When PES is between 0 and 1, the supply is price inelastic. Supply is relatively unresponsive to a change in demand.
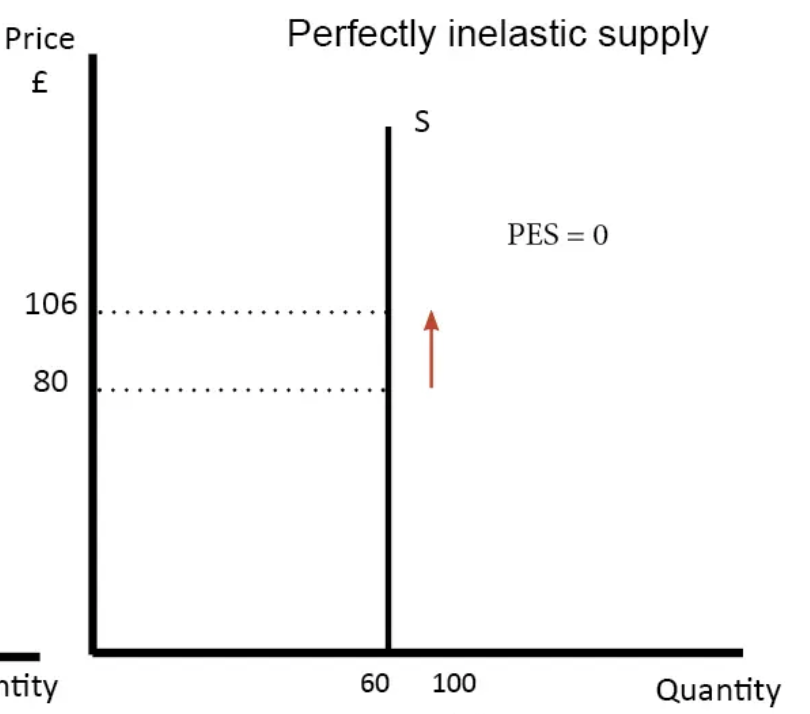
- What happens WHEN PES IS 0?
- When PES is 0, supply is perfectly price inelastic. Supply is fixed and cannot respond to a change in market demand
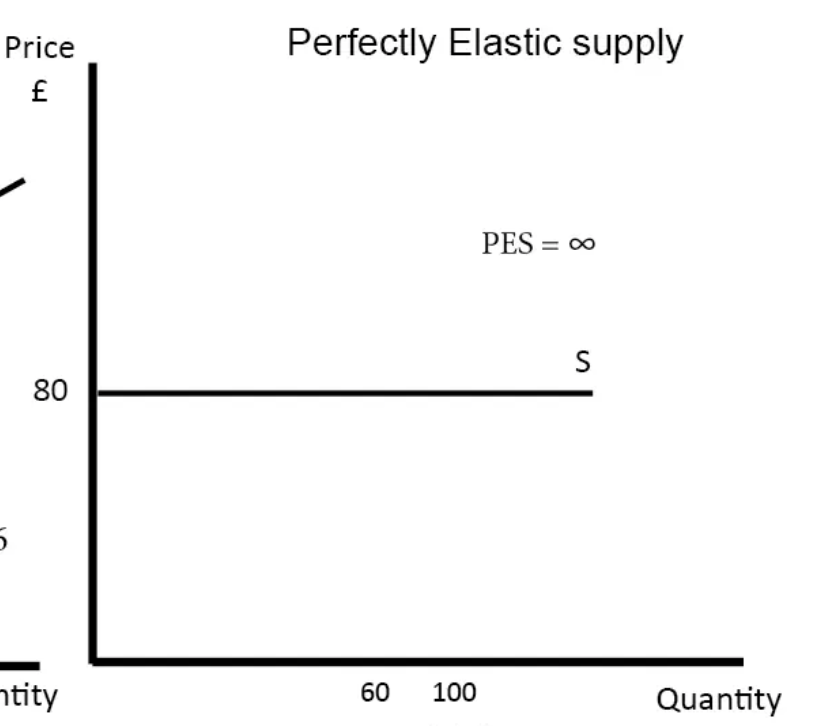
- What happens WHEN PES IS INFINITY?
- When PES is infinity, supply is perfectly elastic. An increase in demand can be met without any change in market price
1.2.6 Price
Determination of Equilibrium market prices
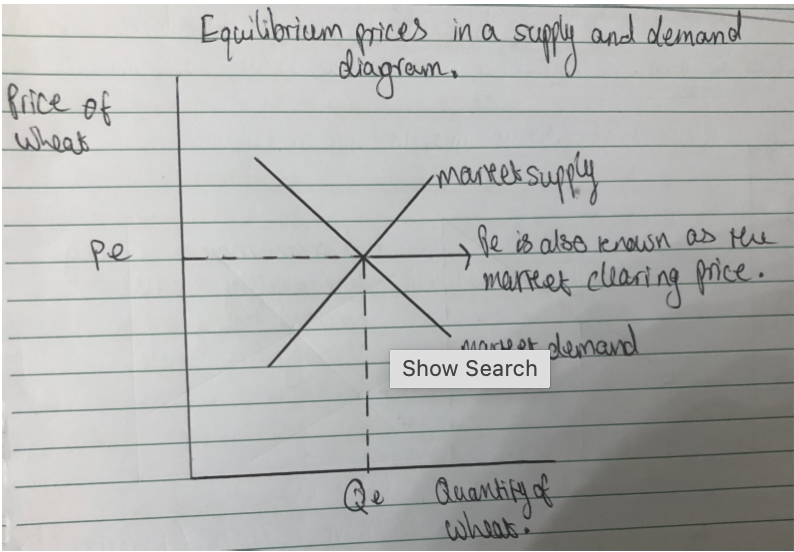
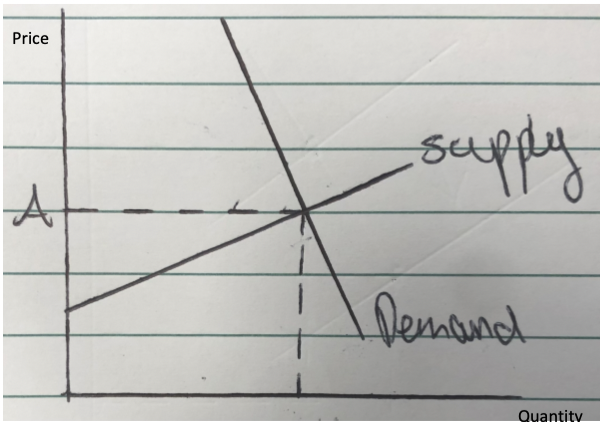
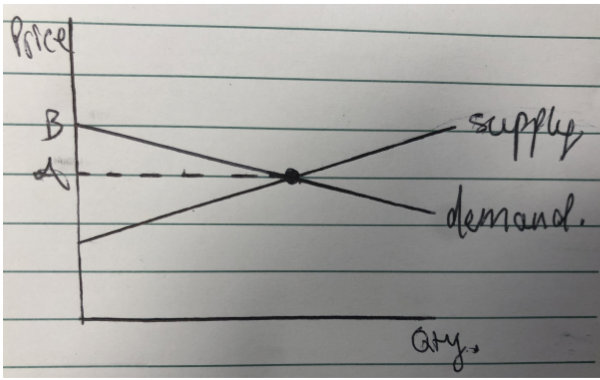
- What is meant by EQUILIBRIUM?
- Equilibrium is a state of equality or balance between market supply and demand.
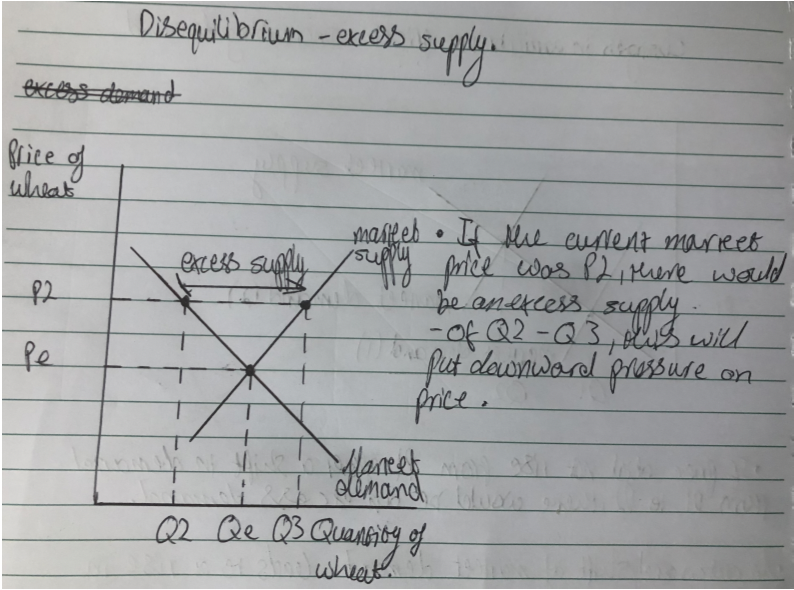
- What are POINTS OF DISEQUILIBRIUM?
- Points of disequilibrium are prices where demand and supply are out of balance.
- Equilibrium diagram
- Disequilibrium diagram - EXCESS SUPPLY
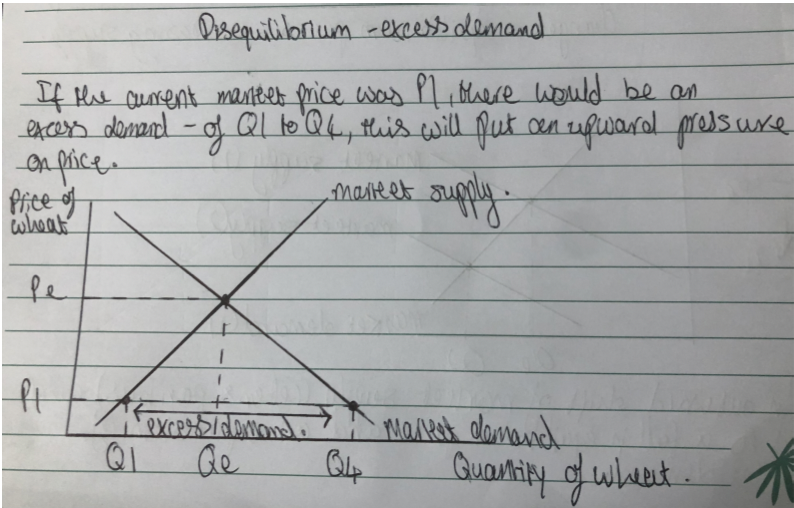
- Disequilibrium diagram - EXCESS DEMAND
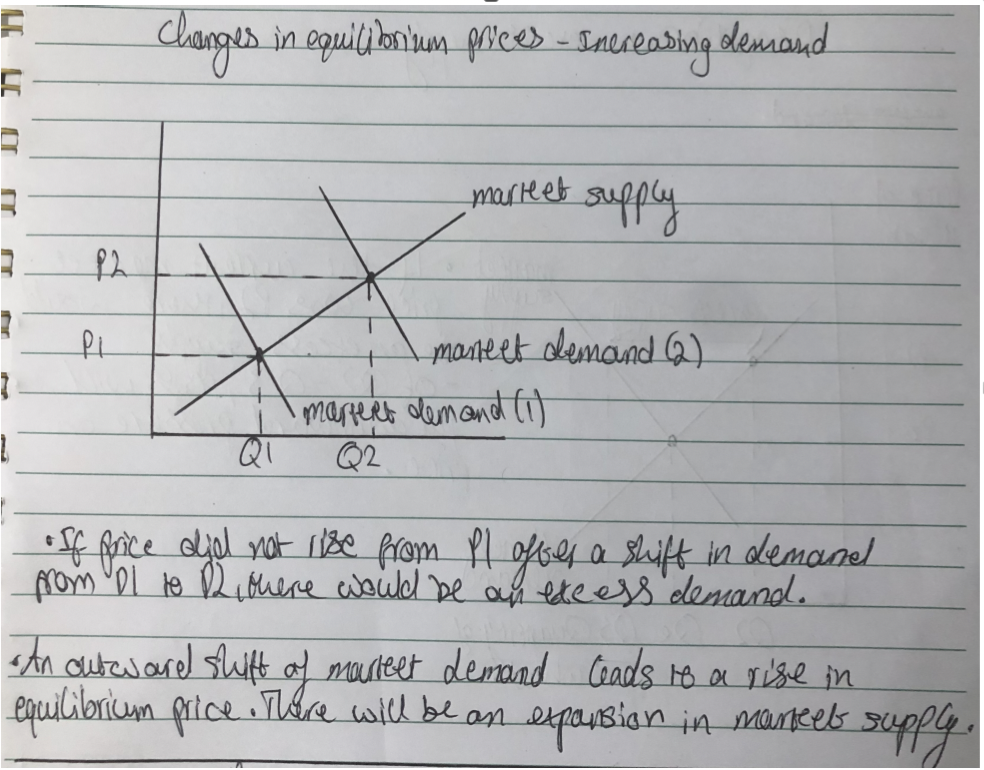
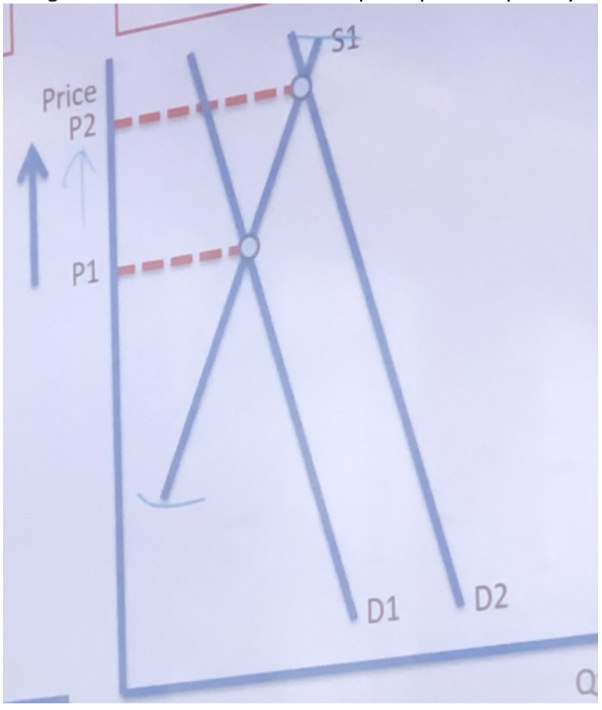
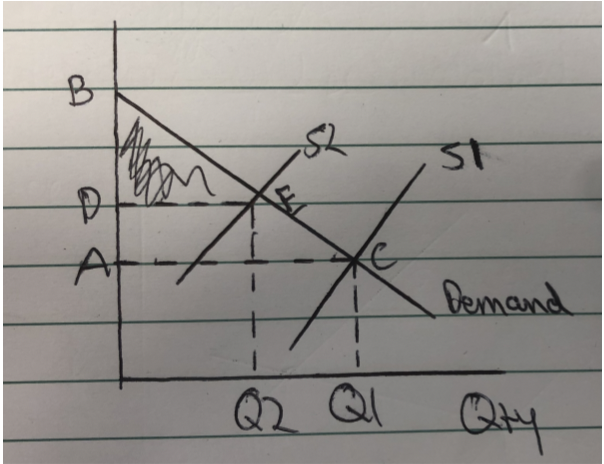
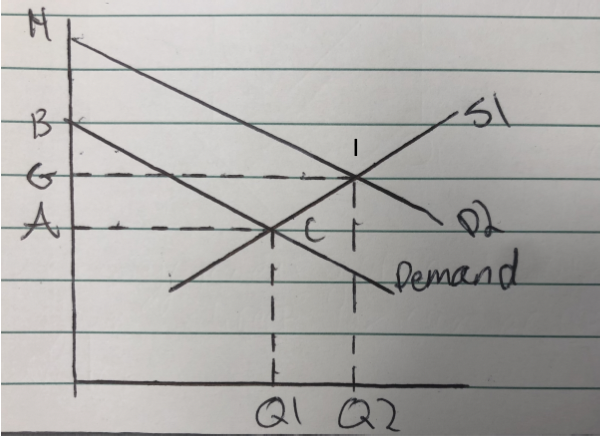
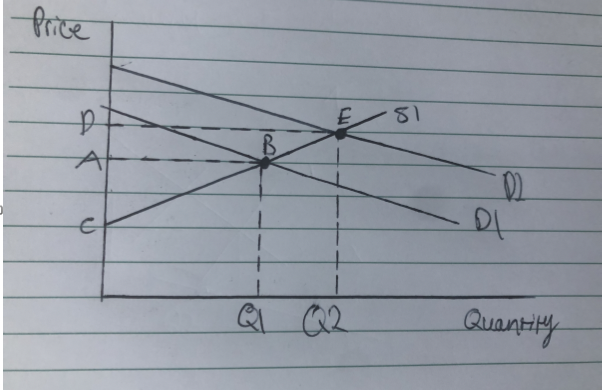
- Changes in EQUILIBRIUM prices - INCREASING DEMAND
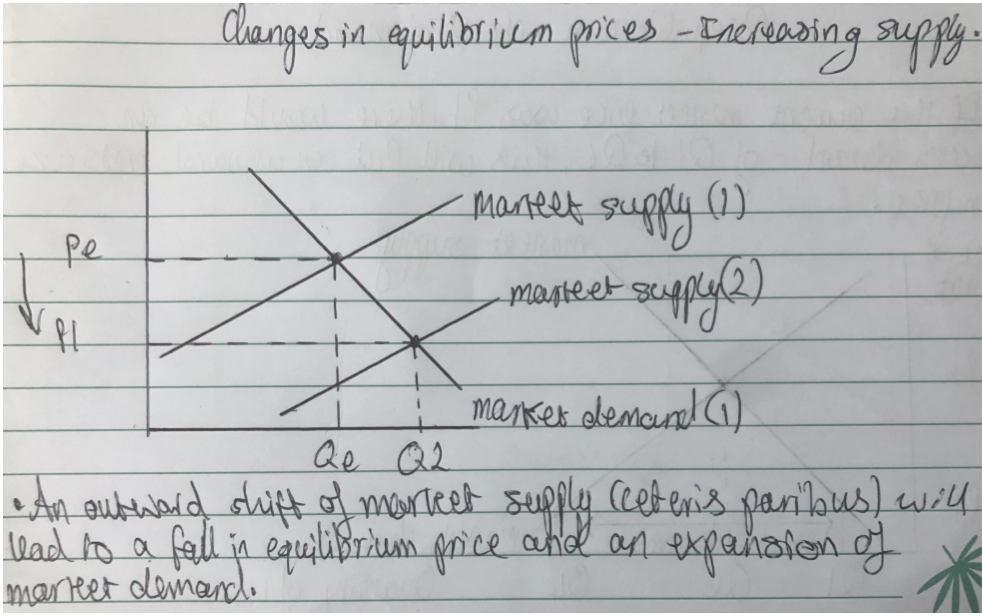
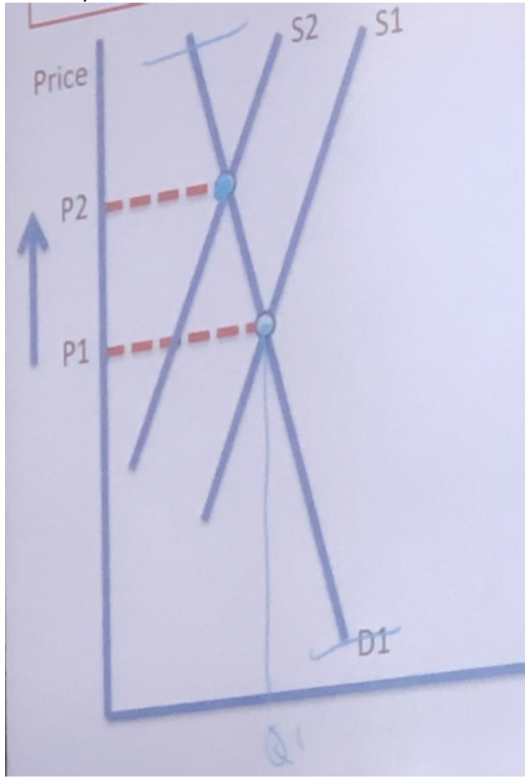
- Changes in EQUILIBRIUM prices - INCREASING SUPPPLY
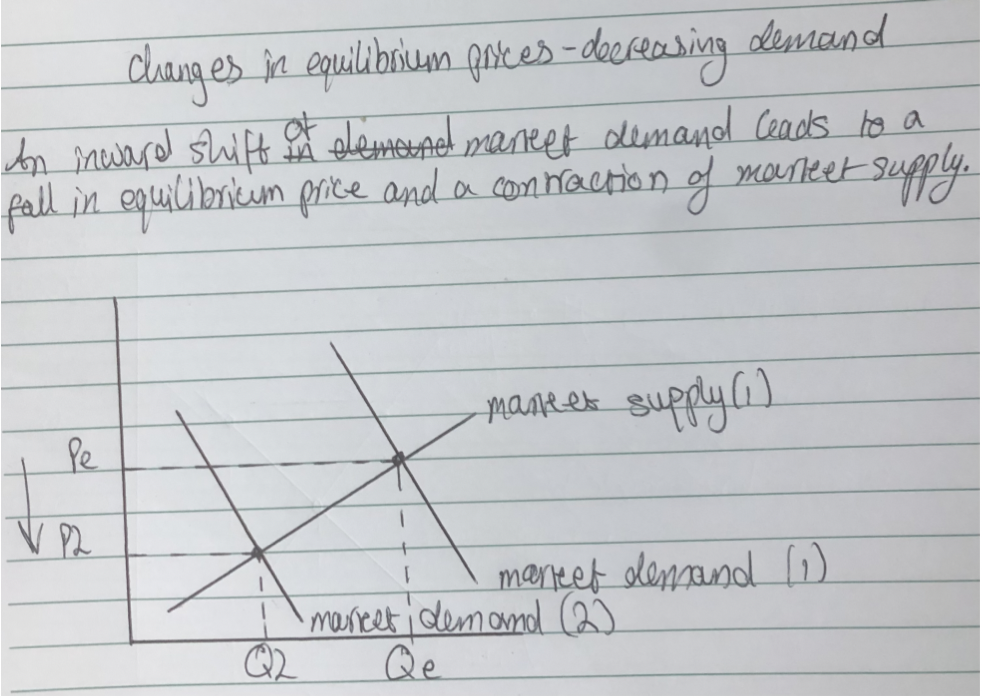
- Changes in EQUILIBRIUM prices - DECREASING DEMAND
- Changes in EQUILIBRIUM prices - DECREASING SUPPLY
1.2.7 Price Mechanism
- What is the PRICE MECHANISM for?
- The price mechanism is used to alloacte scarce resources (CELL) within the market.
- What are the 4 MAIN PRICE MECHANISMS?
- Signalling - Prices adjust to demonstrate where the resources are required and where they are not. For examples, when fidget spinners were trending and many people were buying them (demand for them was high), toy businesses put their resources into making fidget spinners, leading to an increase in price. The increase in price will then signal consumers to stop spending. Producers will see the demand for the product and this will signal them to either increase or decrease price and to either increase or decrease the supply.
- Incentives - When the price of a product rises, producers are likely to respond by increasing the supply that product due to the profit incentive so they can earn more money from the increasing price of the product. Producers that are already supplying the product will increase the price of the product and will then increase supply of the product. E.g. furniture companies may throw away spare wood shavings, however, if the price of wood shavings increases, the furniture companies will be incentivised to start selling their wood shavings.
- Rationing - The price system is a way of rationing goods because when price increases, some people will no longer be able to afford to buy the product and others may no longer have the desire to buy the good. The limited resources can be rationed and allocated to the people who are able to afford them and those who value them most highly.
- Allocate - allocating scarce resources (CELL) among competing uses.
Price mechanism in the context of different markets: Local, national Global
- Local - The coronavirus pandemic has disrupted supply chains across the planet, and many countries have blocked imports to prevent the spread of the virus. For example, British supermarkets are importing less from other countries meaning that there are fewer goods on supermarket shelves. As the demand for food is high, but supply is low, the price of food rises to ration off the excess demand so that only the consumers who value the food highly can buy them. This is an example o the rationing function.
- National - Housing prices differ in the UK from low in the north and high in the south. London, not only is the capital, is the second largest financial centre in the world and also has many tourist attractions. As the population of London is high, relative to the rest of the UK, house prices will rise to ration off excess demand and only provide houses to those that can afford the new price. The new, higher, house prices in London will also act as an incentive for firms to allocate resources to the production of more houses as there is profit to be made for them. This is an example of the rationing function and incentive function.
- Global - In 1973 the Organisation for Petroleum Exporting Countries proclaimed a restriction on the supply of oil, due to geopolitical factors regarding Amerca and the Middle East. This sent the price of oil at record-breaking levels across the world, as oil was invaluabe as a resource to countries. This is an example of the ratioing function as the disequilibrium of supply and demand meant that the high prices detered consumers (countries) who didn’t value oil as much as the others or couldn’t afford the new price, which left the market open only to those who either valued valued oil or could oay the new price of oil.
CAUSES of PRICE VOLATILITY - supply and demand analysis.
- An adverse supply shock can cause market prices to rise sharply especially when PES is inelastic (PES between 0 and 1)
- Rising market demand can also cause price spikes - especially when PES is low (inelastic, between 0 and 1)
1.2.8 Consumer and Producer surplus
What is CONSUMER SURPLUS?
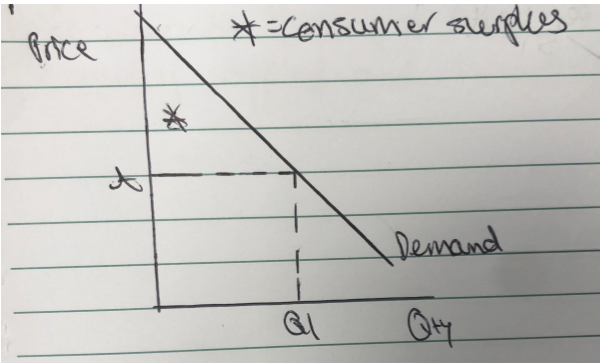
- Consumer surplus is the difference between the total amount that consumers are willing and able to pay for a good/service (which is shown by the demand curve) and the total amount they actually pay (the market price)
- Consumer surplus is indicated by the area uder the demand curve and above the market price.
Consumer surplus and CHANGES IN MARKET PRICE
- The level of consumer surplus changes as the market price for a good or service changes.
Consumer surplus and PED
- When demand is inelastic, there is a greater consumer surplus becuase there are some buyer willing to pay a very high price to continue consuming the product.
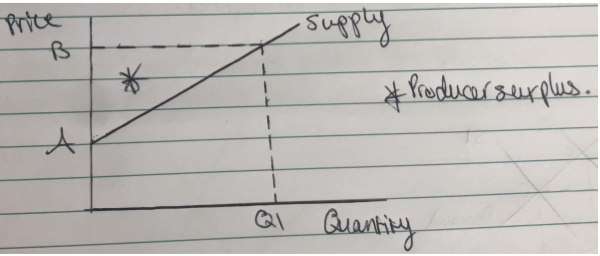
What is PRODUCER SURPLUS
- Producer surplus is the difference between the price producers are willing and able to supply a good/service for and the price they actually receive.
- Producer surplus is shown by the area above the suppky curve and below the current market price.
PRODUCER SURPLUS and CHANGES IN MARKET PRICE
- the level of producer surplus changes as the market price for a good/service changes.
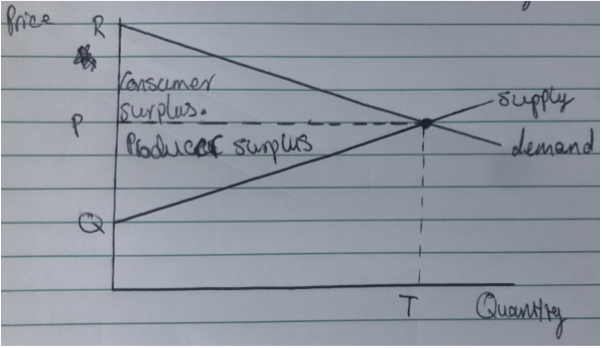
What does CONSUMER AND PRODUCER SURPLUS ON ONE DIAGRAM look like?
1.2.9 Indirect Tax and Subsidies
What is INDIRECT TAX?
- Indirect tax is a tax that is imposed by the government and is levied on goods and services.
- The amount of tax is always shiwn by the vertical distance between the two supply curves.
What happens to SUPPLY BECAUSE OF INDIRECT TAX?
- Because of the indirect tax, less can be supplied at each price level as they would be earning less profit.
What is THE RESULT OF AN INDIRECT TAX?
- The result of an indirect tax is an increase in the market price and a contract in demand to a new equilibrium output.
Is SPECIFIC TAX set as ‘set tax per unit’ or a percentage?
- Specific tax is set as a set tax per unit. For example - £5 tax per unit sold.
Is an AD VALOREM TAX set as a ’set tax per unit’ or a percentage?
- Ad valorem tax is set as a percentage tax. For example - 20% tax in the unit price.
- Examples of Ad valorem tax - VAT standard rate of 20%
What happens when INDIRECT TAX when PED = 0 (Perfectly Inelastic)
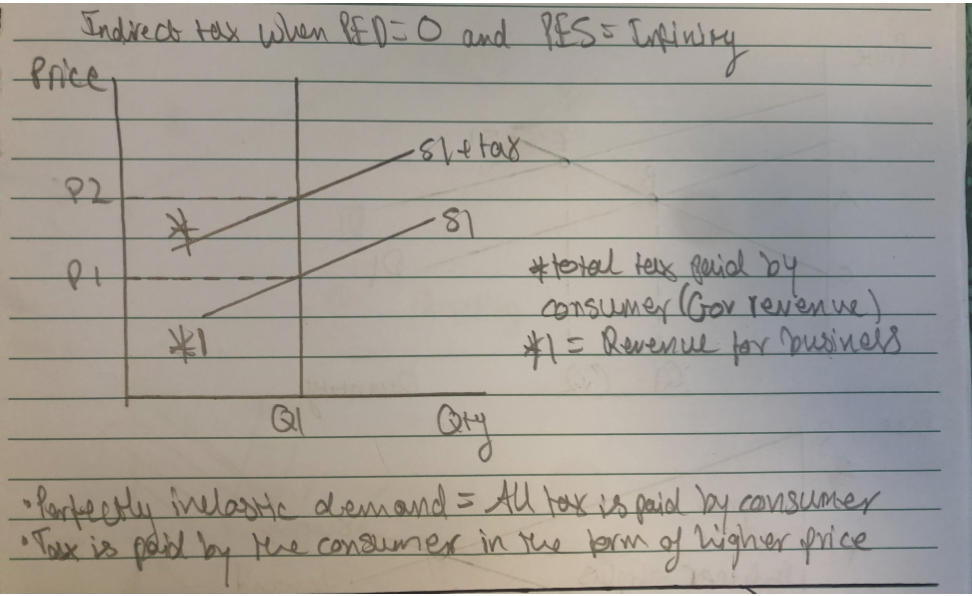
- * = Total tax paid by the consumer
- *1 = Total revenue for the business/firm
- What happens when an INDIRECT TAX is imposed and DEMAND IS INELASTIC? - All of the tax will be paid for by the consumer through paying a higher price
What happens with INDIRECT TAX when PES = INFINITY
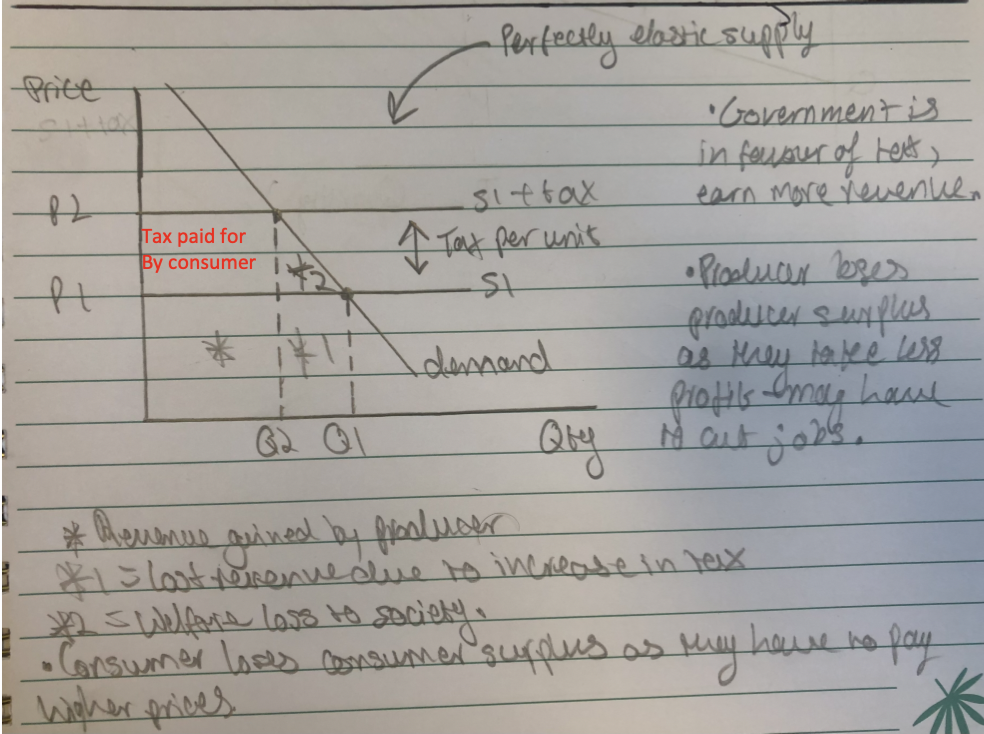
- The government is in favour of the tax as they will increase their tax revenue, where as producers lose producer surplus as they take losses of profit and may result in the producer cutting jobs.
- *= Revenue gained by producer
- *1 = Lost revenue due to increase i tax and loss of consumers
- *2 = Welfare loss to society
What happens when INDIRECT TAX when PED is GREATER THAN 1 (demand = Elastic)
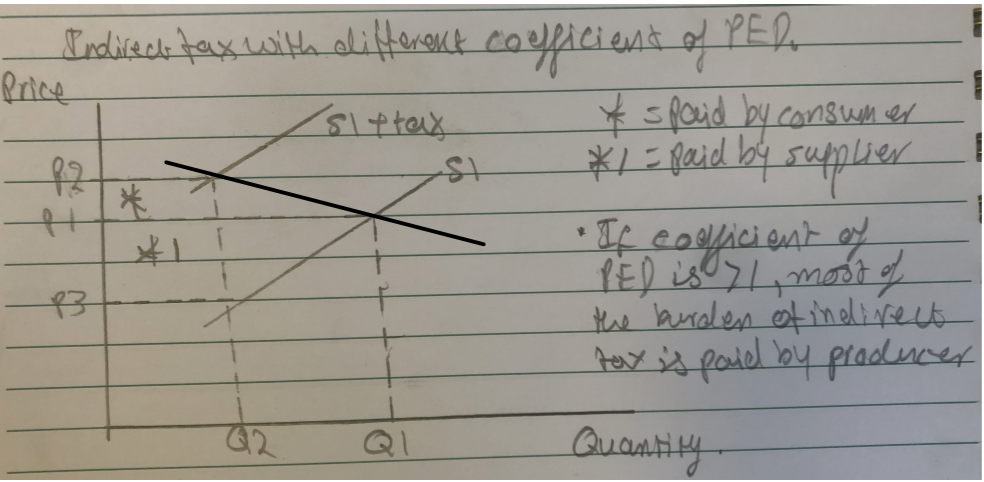
- If the coefficient of PED is greater the 1 (demand is elastic), most of the burden of the tax will be paid for the by producer.
- * = Paid by consumer
- *1 = paid by producer.
What happens with INDIRECT TAX when PED IS BETWEEN 0 AND 1 (Demand is INELASTIC)
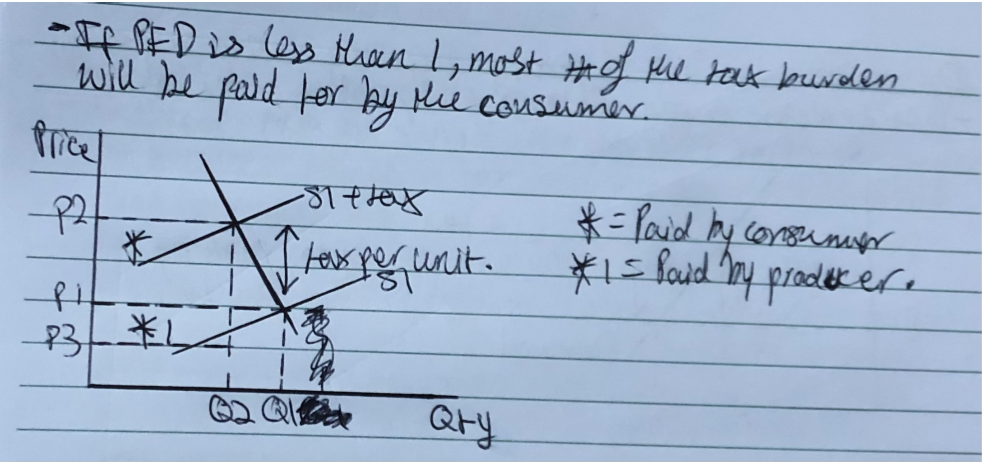
- If PED is between 0 and 1 (Demand is inelastic) then most of the tax burden will be paid for by the consumer through paying a higher price.
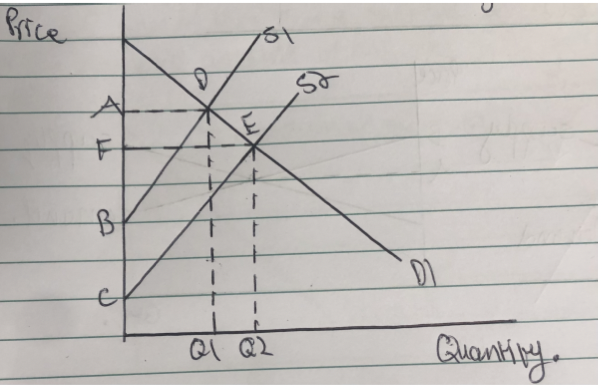
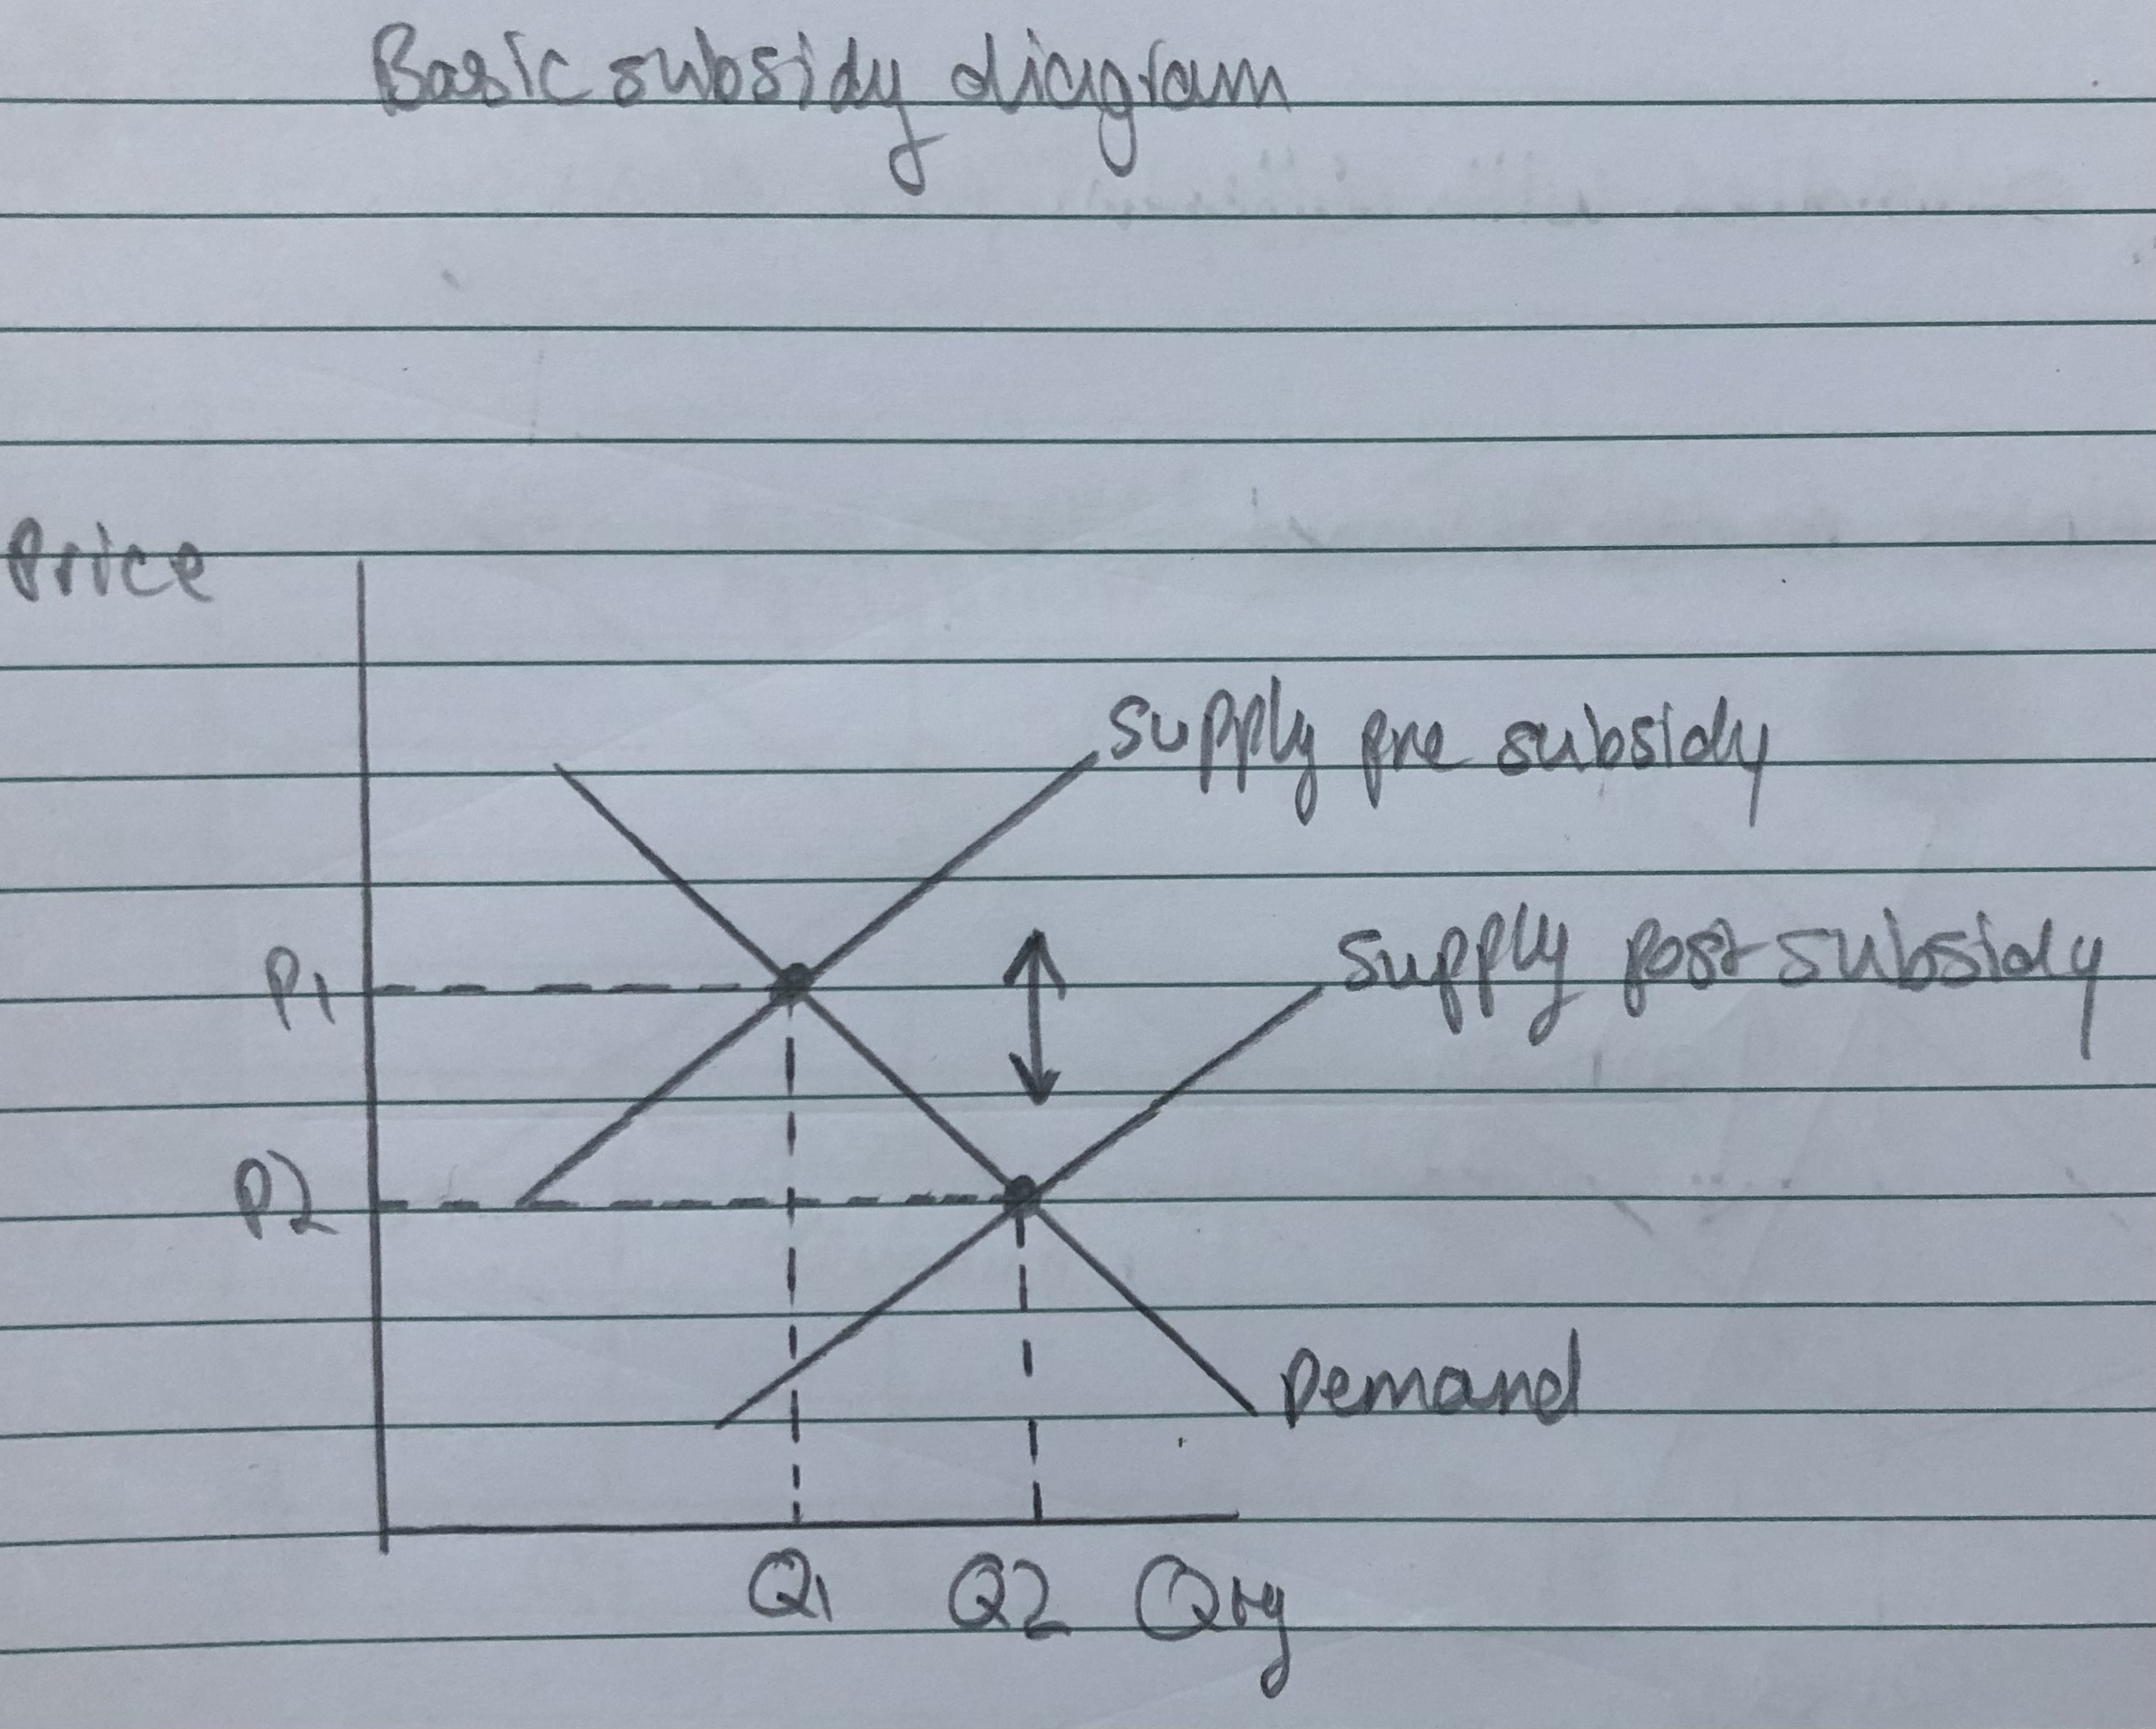
What is a SUBSIDY
- A subsidy is any form of financial support from the government that is offered to producers to increase the supply of a good/service.
- Agovernment subsidy to producers causes an outwards shift of the market supply curve leading to a lower equilibrium price and an increase in the equilibrium quantity traded.
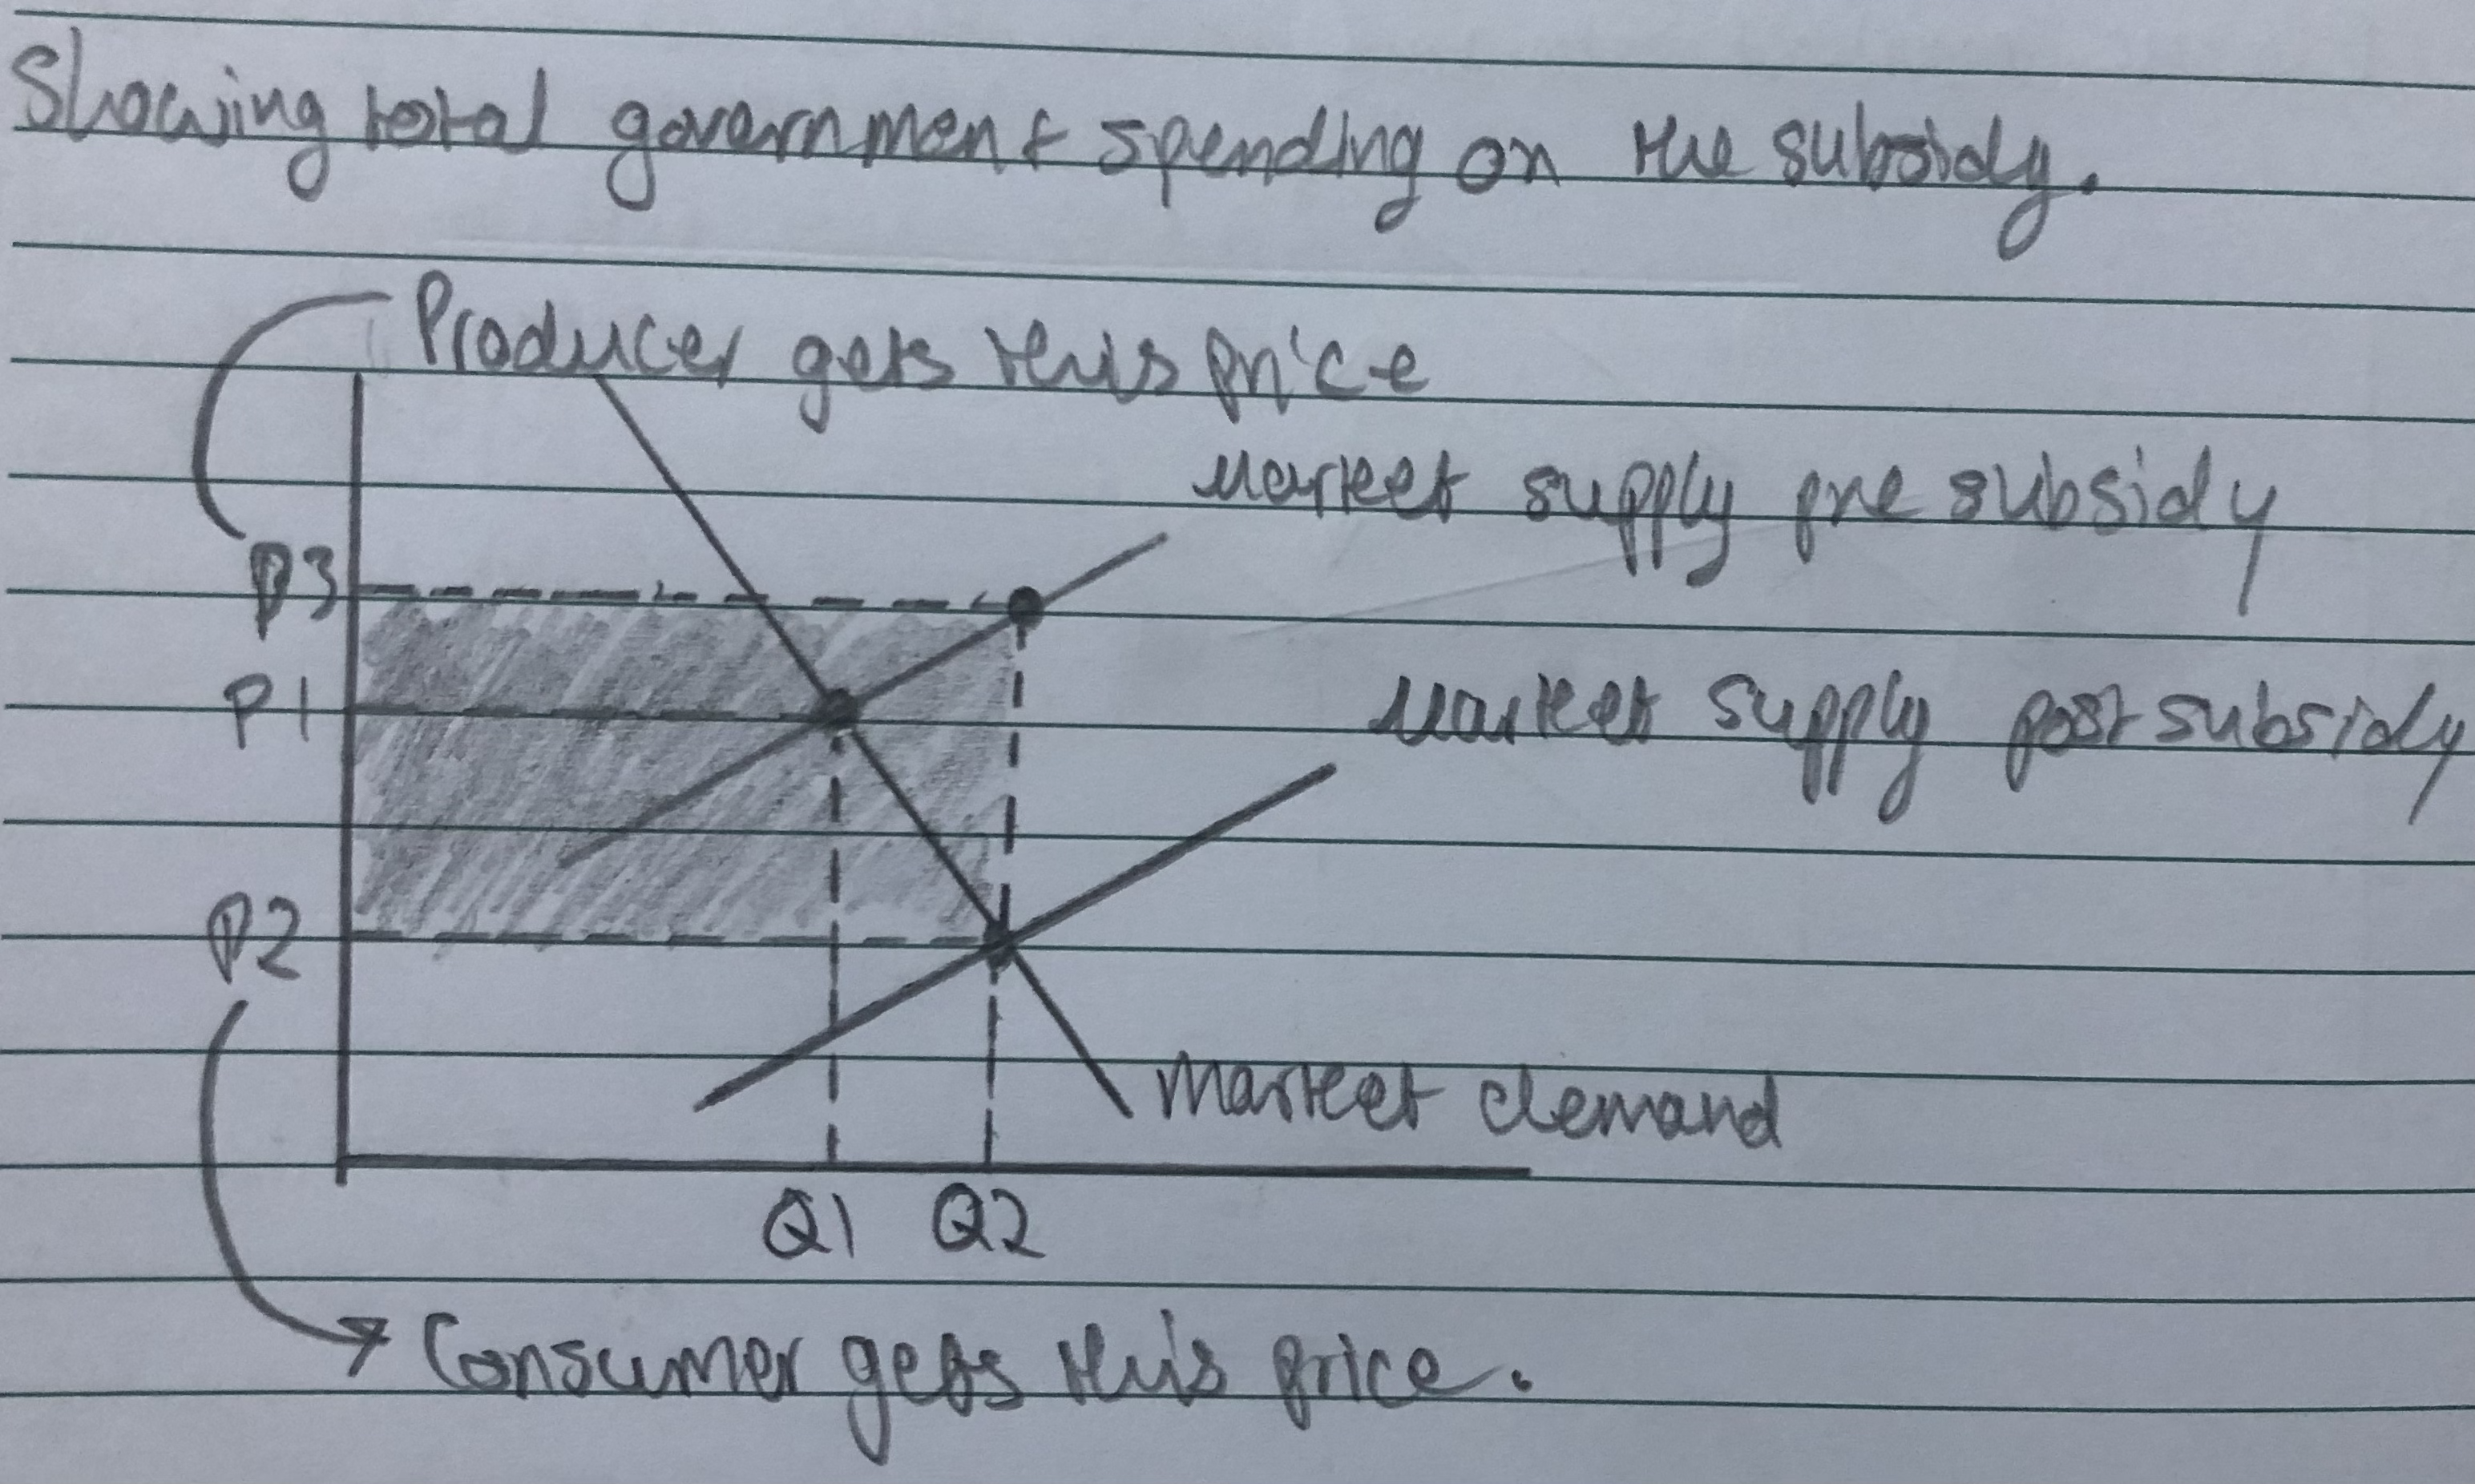
Where is TOTAL GOVERNMENT SPENDING on the subsidy diagram?
What is the effect on EQUILIBRIUM PRICE when there is a SUBSIDY and PED is INELASTIC (between 0 and 1)?
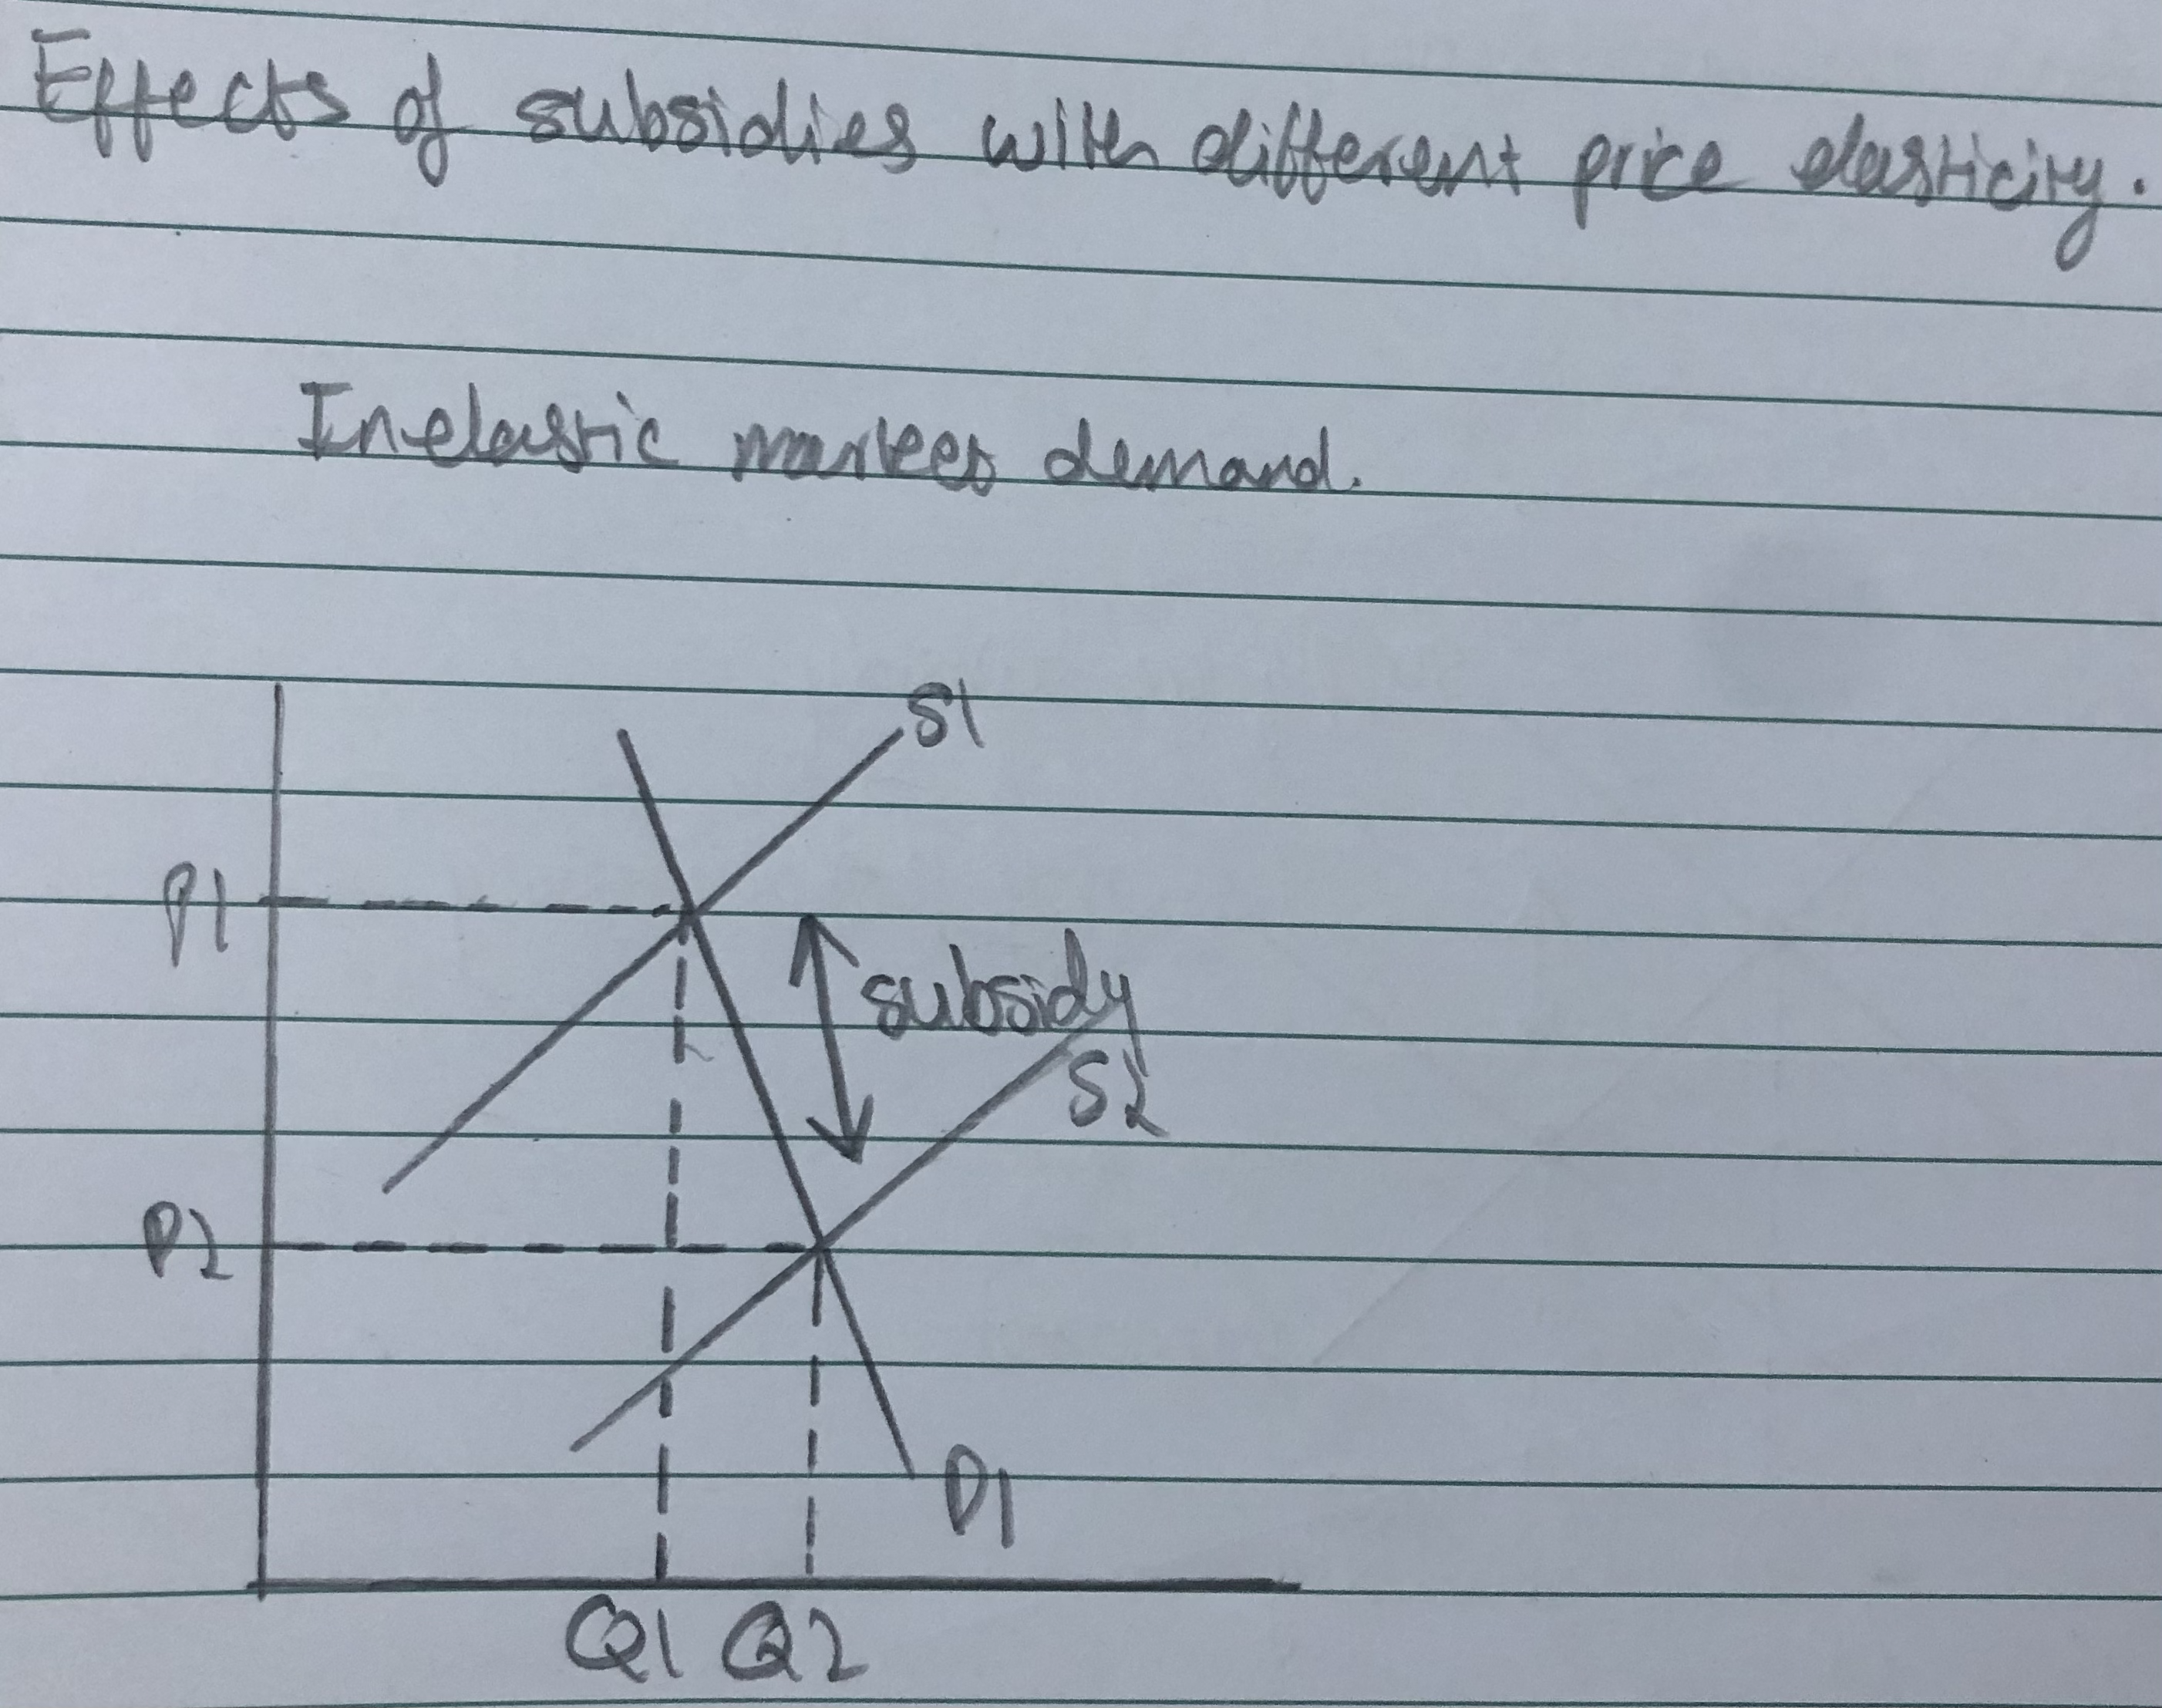
- When PED is inelastic (between 0 and 1) the government subsidy will have a greater effect on the equilibrium price and decreases the equilibrium price significantly.
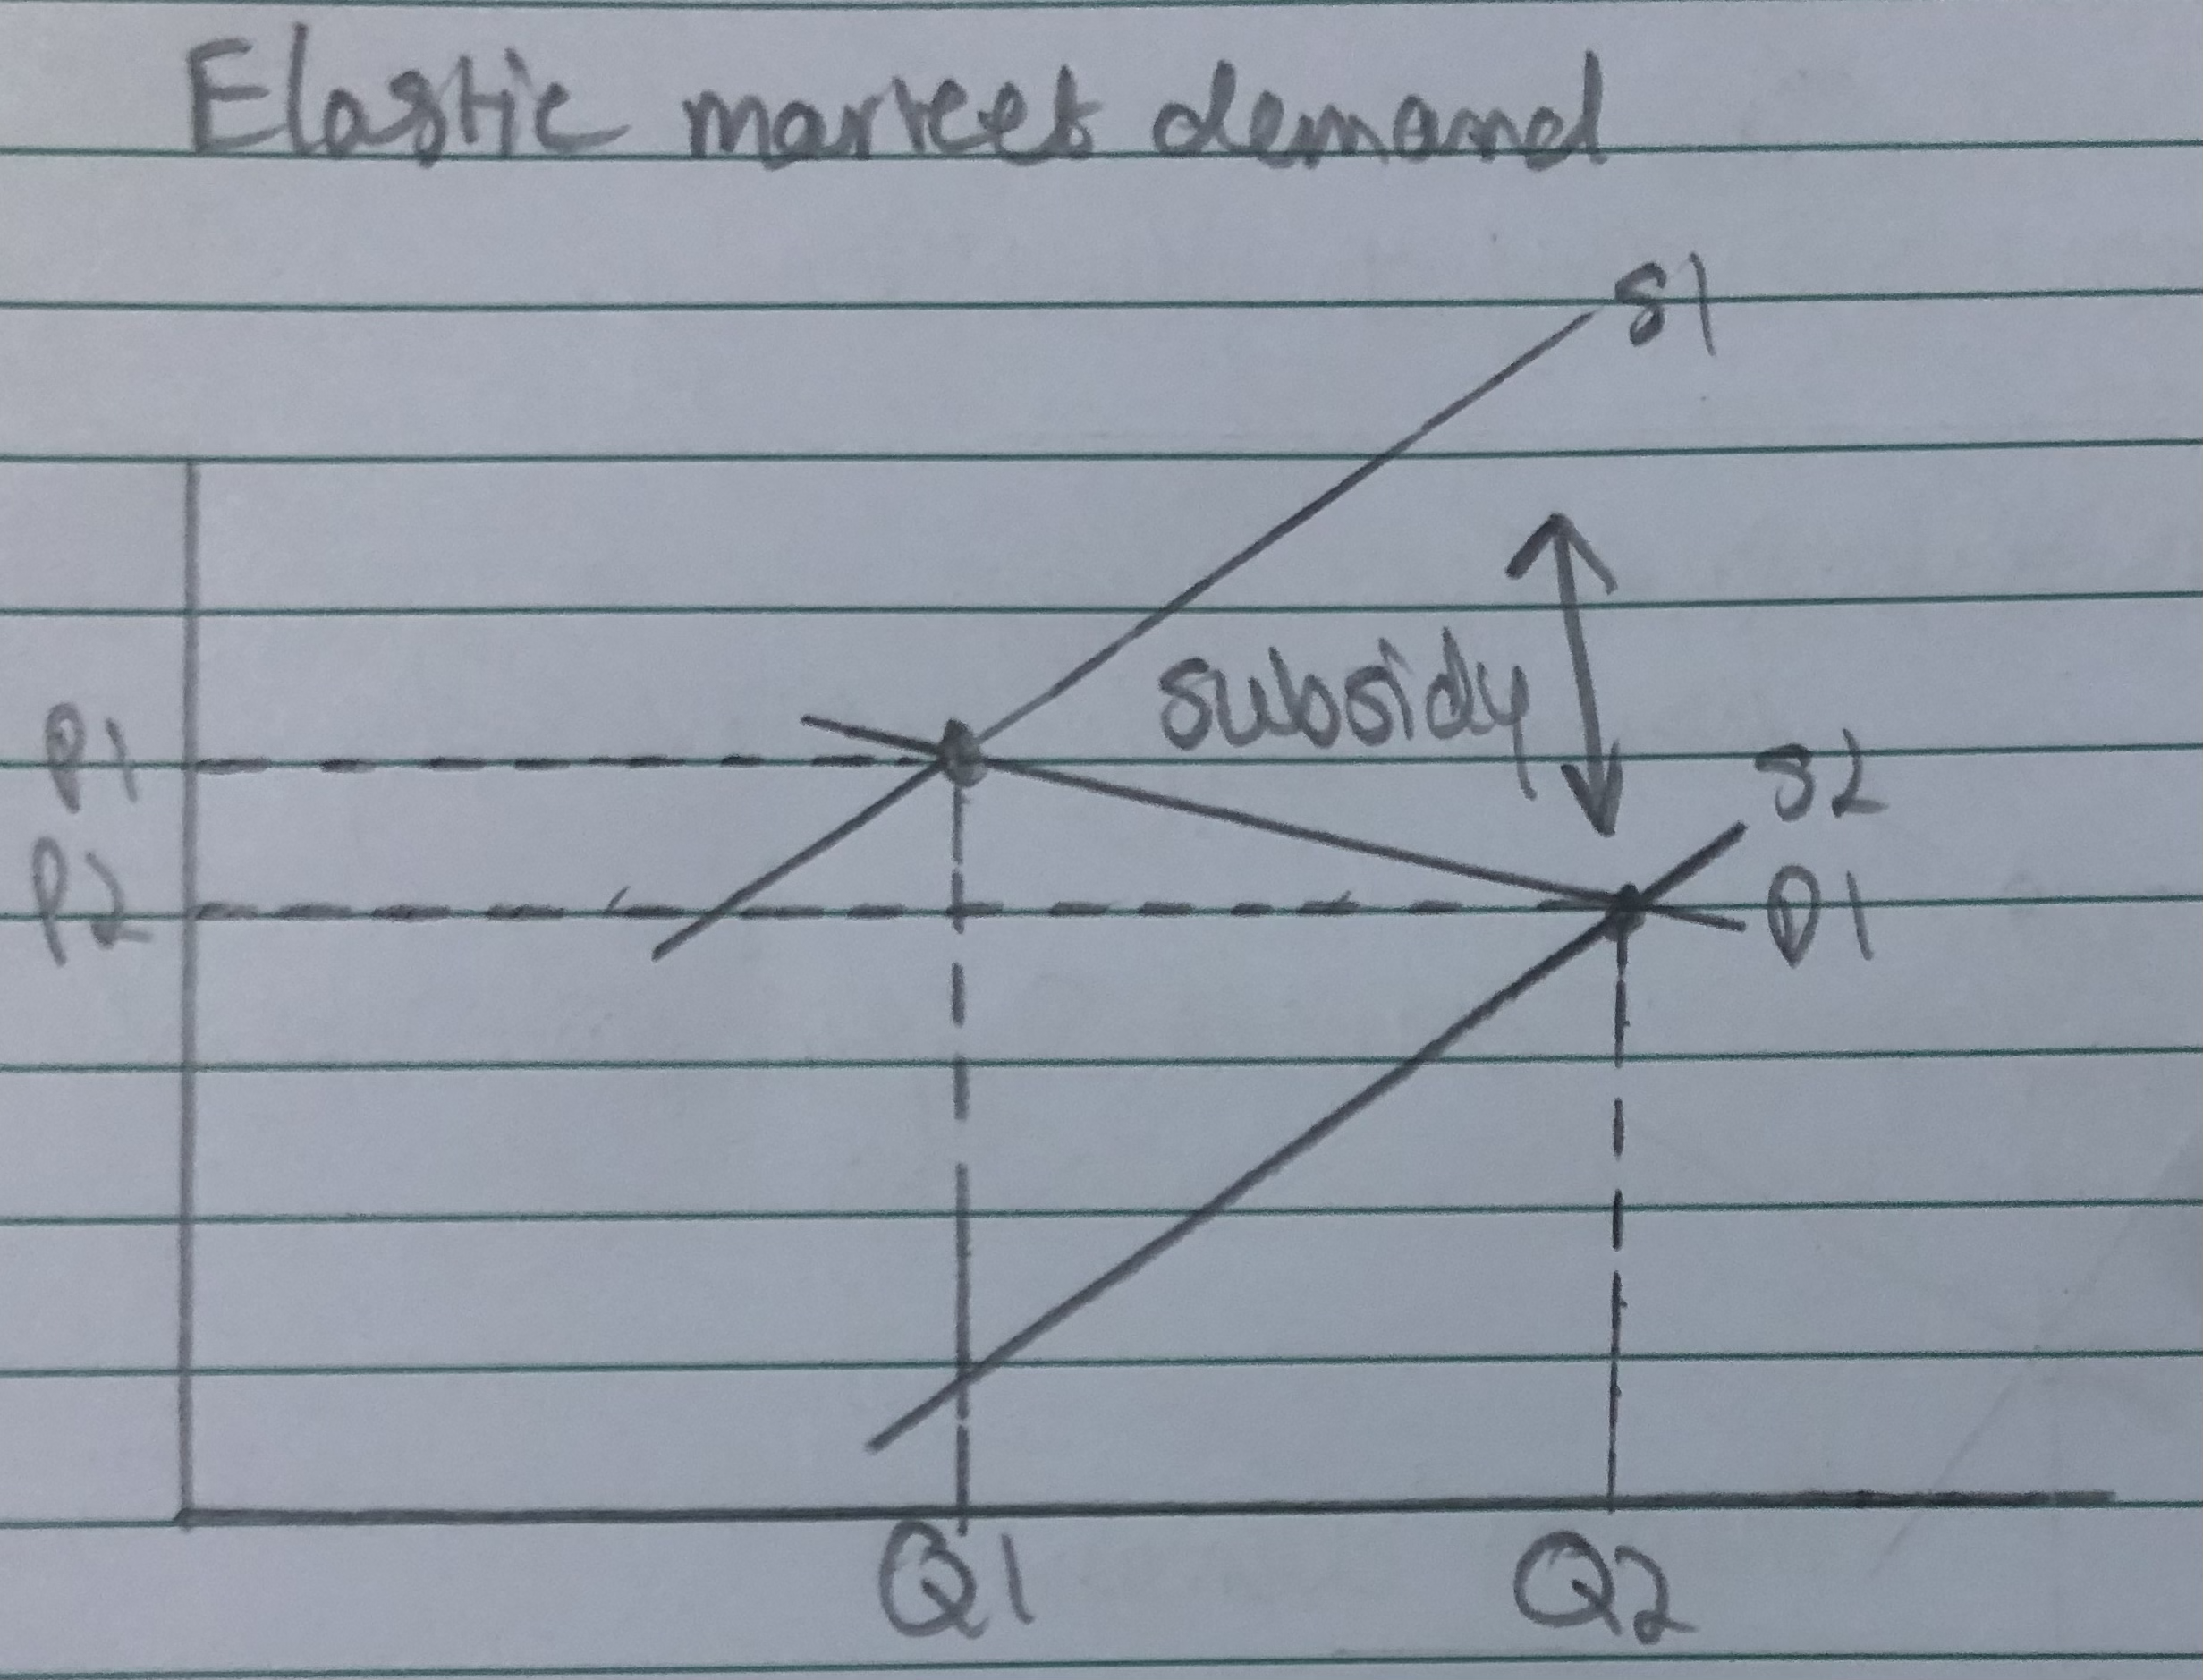
What is the effect on EQUILIBRIUM QUANTITY when there is a SUBSIDY and PED is ELASTIC (greater than 1)?
When PED is elastic (coefficient of PED is greater than 1), the government subsidy will have a greater effect on the equilibrium quantity and increase the equilibrium quantity significantly.
What are some JUSTIFICATIONS for SUBSIDIES FOR PRODUCERS?
- Government subsidies could be given out to encourage output increases and investment in declining sectors
- Government subsidies could also be given out to encourage arts and other cultural services. Pupils who are likely to do well usually have parents that can take them to events and so governments can subsidy these events and make it cheaper for consumers (oarents and students) to go to them to increase the chances of the students being successful. \n
What are some EVALUATION poitns when ASSESSING SUBSIDIES?
- One evaluation point could be - ‘Are the subsidies effective in meeting their aims? Will they achieve the desired effect which is to stimulate demand and consumption?)
- Another evaluative point can be - ‘Will the subsidy effect productivity? If so, how?’
- A third evaluative point could be - ‘Does the subsidy help to correct a market failure?’ For example - ‘Do more people find work with child care subsidies?’ \n
1.2.10 Alternative Consumer behaviour
- What does CHALLENGING RATIONALITY mean?
- Chllenging rationality is when consumers are not always rational in their decision making as other factors an influence the decions they make. For example, trends in jackets - a more popular jacket is more likley to be more expensive than a jacket that is not as popular, but because they want to fit in, they pay a higher price.
- How do SOCIAL and EMOTIONAL factors INFLUENCE DEMAND?
- Social factors - Social awareness and consumersb being aware of things such as health risks that can be caused when consuming certing goods/services can affect how many consumers demand that said good/service.
- Emotional factor____s - Emotioanl factors such as binge drinking and eating at times of personal insecurity can cause consumers to demand goods/services even more than what they usually would.
- What is BEHAVIOURAL ECONOMICS?
- Bhevaioural economics tries to mix Psychology with economics and sees thinsg through human choices, instead of economical choices (an Econ).
- What is an ECON?
- An ‘Econ’ is said to be an infinitely rational, immensely intelligent and emotionless being who can do cost-benefit analysis at will, and is never (ever) wrong.
- Most people are not infinitely rational, but rather face ‘bounded rationality’ with people adopting simple intuitive ‘rules of thumb’ instead of calculating optimal solutions for every decision they make.
- What are HEURISTICS?
- Heuristics are best described as mental shortcuts or ‘rules of thumb’ for decision making to help make quick and satisfactory decisions. Although, these decisions are not perfect.
- What does economist GERD GIGERENZER argue?
- Gerd Gigerenzer argued that hueristics can be an optimal way to respond in occasions where we lack information or time. People learn from experiences and develop many different hueristics over time.
- What is CHOICE ARCHITECTURE?
- Choice architecture describes how decisions we make are affected by the layout/range of choices that are available. For example - putting the salad bar close to the entrance of a restaurant and putting unhealthy food further away to make people more likely to consume salad.
- How are CHOICES INFLUENCED BY SOCIAL NORMS?
- Choices are influenced by social norms as our day to day behaviour is strongly influenced by what we understand to be the social norms and social customs. For example respecting seatbelt laws.
- What is HERD BEHAVIOUR?
- Herd behaviour is described as the result of consumers (customers) being herd animals and so often make decisions based in part on who is around us and the choices that they make. For example - choosing items off a menu in a restaurant based on what someone esle had ordered. \n
- What is an example of BEHAVIOURAL ECONOMICS IN ACTION?
- An example of behavioural economics in action is organ donation and the importance of its form design - people are now required to opt out of organ donating and has resulted in an increase in organ donations which shows the importance of behavioural economics in decision making. \n
- What are BHEAVIOURAL SHOVES AND NUDGES?
- Behavioural nudges are an alternative to using taxes and subsidies to influence choices
- What are some EXAMPLES OF BEHAVIOURAL
- Eliminating or restricting
- Financial disincentives to make a particular decision or to take a pafrticular course of action.
- Influencing choices.