Kruskal-Wallis H Test for Independent Samples & Friedman Test for Repeated Measures
Definition (#f7aeae)
Important (#edcae9)
Extra (#fffe9d)
Kruskal-Wallis H Test for Independent Samples:
Characteristics:
DV can be ordinal, interval, or ratio.
IV is categorical/nominal with more 2 levels/groups.
Test differences between conditions/groups.
Concept:
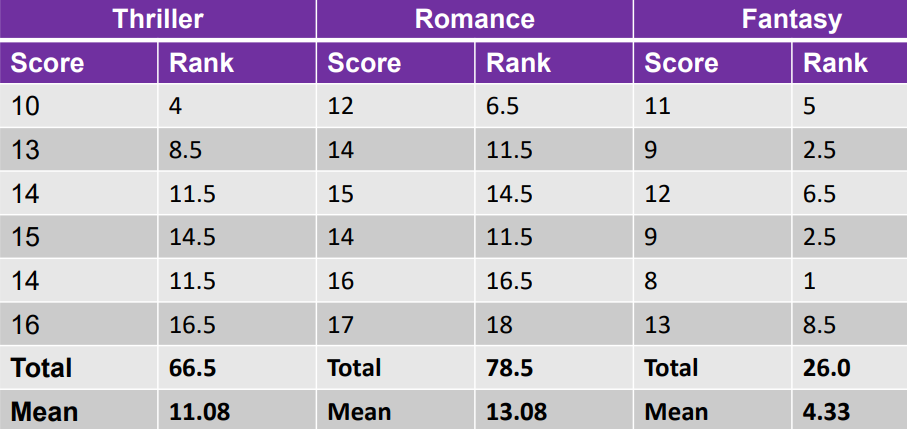
Similar to Mann-Whitney test, Kruskal-Wallis test analyses data using ranking.
Involves arranging data in ascending order, and totaling the rank for each group.
If scores of groups are clustered at either end of sequence, reflects a significant group difference.
If scores of groups are randomly distributed throughout, reflects no significant group difference.
Ex:
Amount of hours spent watching favourite genre of tv shows per week.
Analysis:
Analyze → Nonparametric Tests→ Legacy Dialogues → k Independent Samples
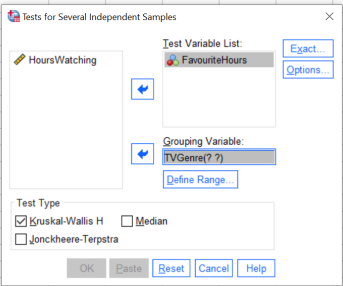
Put IV variable in “Grouping Variable” and DV in “Test Variable List”.
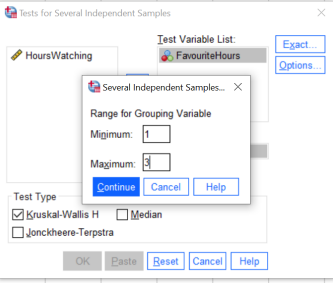
Tick “Kruskal-Wallis H” → Define Range for IV. Click “Continue” → Click “OK”.
Further Analysis:
Significant Kruskal-Wallis test shows group difference, but not which group have difference.
If significant, Mann-Whitney tests must be done to do pairwise comparison between each group.
Due to possible family-wise error, Bonferroni correction must be done.
New alpha value = 0.05 / number of Mann-Whitney test.
Template:
What test you ran & what variables were plugged in.
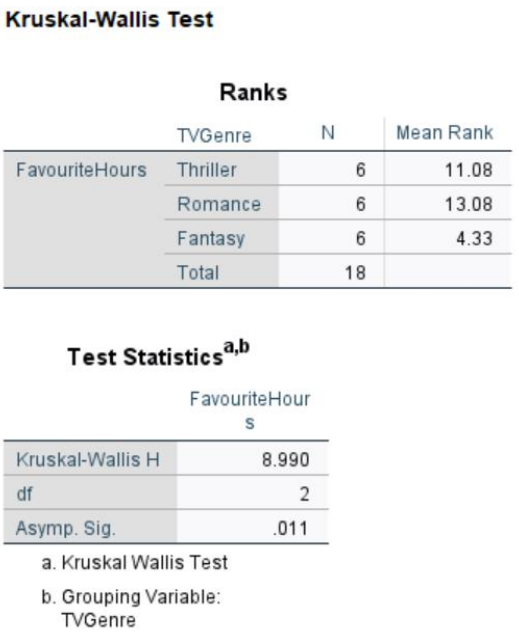
Is there a significant difference between ranking.
Report the “equation” with the values.
Interpretation:
If significant: 1 group has higher score than the other.
If not significant: Similar scores across groups.

Friedman Test for Repeated Measures:
Characteristics:
Within-subject test.
IV has more than two levels.
Variables must be ordinal, scale, or ratio.
Concept:
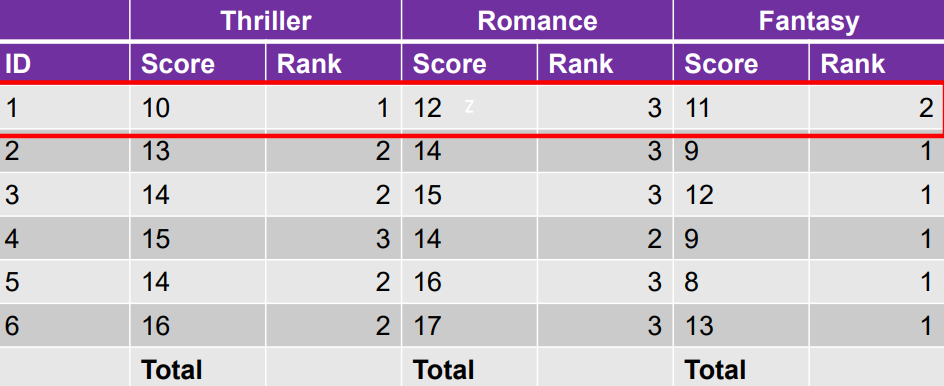
Rank each participant’s score.
Within participants across the levels.
Test the difference between the ranking of the levels.
Whether there is a systematic distribution and random distribution of ranking.
Ex:
Total amount of hours spent specific genre of tv shows per week.
Analysis:
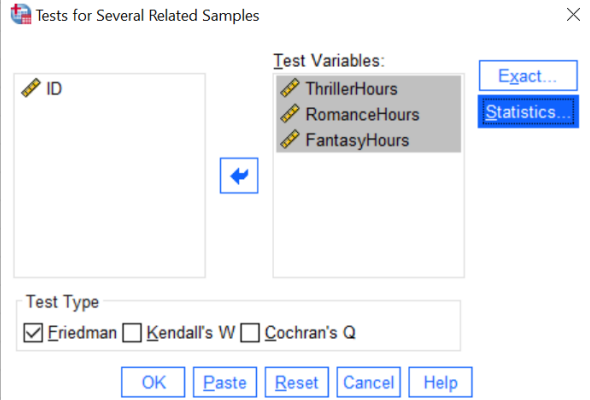
Analyze → Nonparametric Tests→ Legacy Dialogues → k Related Samples.
Put variables in “Test Variables” → Tick “Friedman” → Click “OK”.
Further analysis:
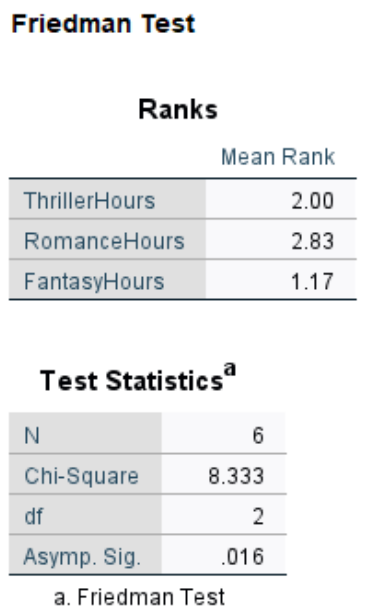
Significant Friedman test for repeated measures shows level difference, but not which level have difference.
If significant, Wilcoxon tests must be done to do pairwise comparison between each level.
Due to possible family-wise error, Bonferroni correction must be done.
New alpha value = 0.05 / number of Wilcoxon test
Template:
What test you ran & what variables were plugged in.
Is there a significant difference between ranking.
Report the “equation” with the values.
Interpretation:
If significant: 1 level has higher score than the others.
If not significant: Similar scores across levels.
