3.5: Population size and growth
Population growth
Factors controlling population size
Ecosystems are dynamic - they constantly change due to alterations in ecosystem factors, for example:
The energy flowing through the ecosystem.
Biological cycles varying the mineral availability.
Habitats changing due to succession.
New species entering and old ones leaving.
Population size at one time is determined by:
Birth rate, or natality. This refers to hatching, binary fission, etc.
Death rate, or mortality.
Immigration, organisms joining the population.
Emigration, organisms leaving the population.
Population size
Different species use different strategies for population growth:
Fugitive species are poor at competition, so instead have a large reproductive capacity and disperse well. They invade new environments rapidly, such as algae.
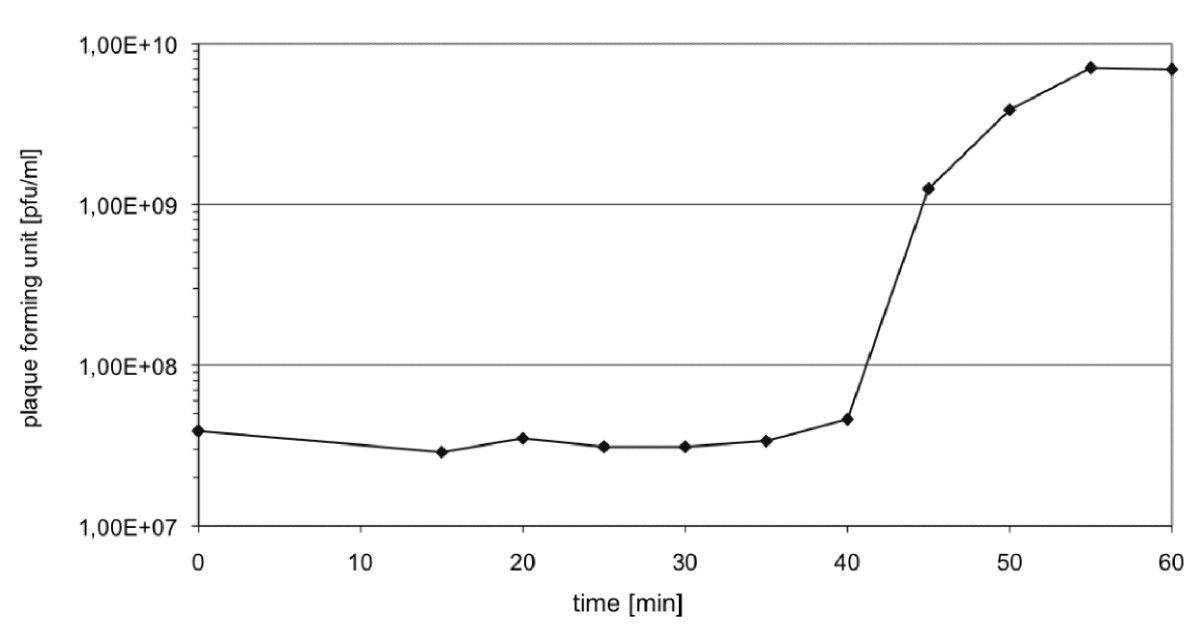
Equilibrium species control their population using competition within a stable habitat. Their pattern of growth is a sigmoid (S-shaped) curve known as the one-step growth curve.
One step-growth curve
This has 4 phases:
The lag phase - where the population does not increase, and then has a period of slow growth.
In bacteria it is a period of adaptation and growth preparation involving intense metabolic activity including lots of enzyme synthesis.
In sexually reproducing organisms, this is the time taken for individuals to reach sexual maturity, find a mate and gestate their young.
The exponential (or log) phase - where the numbers steadily increase.
As long as there are no limiting factors, more individuals soon become available for reproduction.
Bacterial cells divide at a constant rate and the population will double per unit of time. The cell number increases logarithmically, so it is also known as the log phase.
However, this is not permanently maintained due to environmental resistance including less food, increasing concentration of waste products and lack of space and nesting sites.
This causes the population growth to slow, but still increase.
For bacteria in a flask, environmental resistance factors include available food, overcrowding, competition and toxic waste accumulation.
In less artificial situations, these factors are maintained but biotic factors such as predation, interspecific competition and an increase in disease and parasites due to the population density.
Abiotic factors, such as temperature and light intensity, can also potentially affect population density
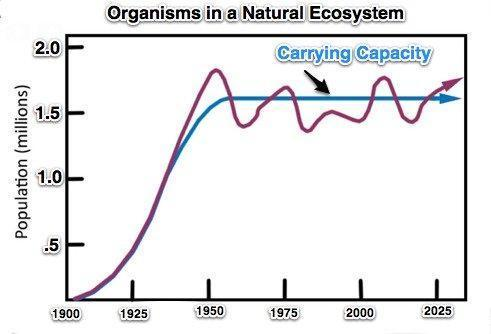
The stationary phase - where the birth and death rates are equal, causing a graph to plateau.
The population has reached its maximum size, known as the carrying capacity for that environment.
The population count itself is not constant, and fluctuates around this carrying capacity in response to environmental changes.
The death phase - The factors which slow population growth become more significant, and the population declines.
This happens when death rates are over birth rates.
Carrying capacity
This is maintained using negative feedback in the environment, an example being the predator-prey relationship.
This relationship causes both populations to oscillate:
A large number of predators consume prey, so the prey population decreases.
There is less prey for the predators, so the predator population decreases.
There is less prey being eaten, so their populations increase.
There is more prey, so more predators can eat and therefore increase.
This cycle repeats at around 10 year intervals.
Factors that regulate populations
Some factors have a greater effect if the population in a given area is larger, known as density-dependent factors.
These are biotic factors and include disease, parasitism and food depletion.
Some factors have the same effect no matter the size of the population, known as density-independent factors.
These are abiotic factors, and can be natural disasters (floods, fires, etc) or environmental changes such as temperature.
The balance between the death rate and birth rate regulates a population size, but this fluctuates.
Although these are not often large or erratic fluctuations.
Negative feedback is used to maintain this at the set point (carrying capacity):
When the population increases above the set point, a density-dependent factor increases mortality or reduces breeding to decline the population.
When the population decreases below the set point, environmental resistance is temporarily relieved to allow the population to rise again.
Abundance and distribution
Biogeography is the study of species abundance and distribution.
Wallace was the first person to model biogeographic regions, defining 6 around the world. He also found that:
Rivers and mountain ranges marked the boundaries of many species of birds and vertebrates ranges.
He noted different animals in similar habitats, opposing the notion that all organisms were created to suit a particular environment.
This contributed to his understanding of natural selection.
New habitat
When a new habitat is assessed, abiotic features are first described as they determine the organisms present.
Animals in a habitat also depend on the plants present.
Measuring abundance
This is determined by how many individuals exist in a habitat.
Animal abundance can be assessed by:
Capture-mark-recapture experiments, using the Lincoln index calculation.
Kick sampling in a stream and counting aquatic invertebrates.
Plant abundance can be assessed by:
Quadrats to calculate the mean number of individuals.
Estimate percentage cover of plants which are difficult to split into individuals.
Estimating percentage frequency.
Measuring distribution
This describes the area or volume where an organism is found.
If it is a uniform habitat, positions of the outermost plants can be marked on a map and measured.
Small areas can indicate this plant is under threat of extinction, and botanists can lobby to protect these areas.
If it not uniform, transect can be used to measure the variation and correlate it with abiotic factor/s.
This is a line across which abundance is assessed.
A belt transect shows data for a given area at measured distances along the transect, where quadrats are placed and readings given for chosen species density, percentage frequency of chosen species, and percentage area cover of all species.
Kite diagrams are often used to represent this.
Ecosystems
Communities are comprised of many species living and interacting together.
This interaction between these organisms and the abiotic factors around them comprises an ecosystem.
Biotic and abiotic factors are linked by energy flow and nutrient recycling.
Ecosystems can be small (the large human intestine and it’s community of microorganisms) or large (oceans cover 70% of the Earth’s surface area). Some even consider the planet one big ecosystem.
Energy
This is the ability to do work, and no changes can happen without energy changes.
Ecosystem functioning can be thought of as a series of energy changes, where energy flows through the components of an ecosystem.
Energy sources can be geothermal, electrical and chemical:
It is likely that unequal proton distribution provided energy for non-living systems in alkaline hydrothermal vent cavities to make the transition into living systems.
Early organisms used energy from chemical reactions to make carbohydrates by chemosynthesis. The electrons needed to reduce carbon dioxide or methane to sugar were derived from oxidation of inorganic molecules such as hydrogen.
Some archaea and bacteria still do this, but they tend to inhabit marginal ecosystems.
The most significant energy source currently is light energy radiating from the sun, as it is the energy source for photosynthesis.
Biotic ecosystem components
Habitats
This is a ecological or environmental area inhabited by a living organism.
It provides means of survival, such as food, water, temperature, pH, soil, etc.
It is not necessarily a geographical area, as part of one organism can be a habitat for another, such as the human duodenum for tapeworms.
Microhabitats are small areas that differ from their surroundings and have features that make it suitable for a particular species, such as moth larva only feeding on the lower leaves of cabbages.
Communities
Members of a species living and interacting together in a habitat form a populations.
Populations interact to form a community.
Community ecology studies interactions of the species, related to their distribution and abundance, and their genotypic and phenotypic differences.
It considers food web structure and predator-prey relationships.
Biomass transfer
Photosynthetic organisms convert sunlight into chemical energy which passes from organism to organism through a food chain.
The study of this is known as ecological energetics.
Energy available at trophic levels contribute to the biomass of organisms.
Food chains can be thought of as means of transferring biomass.
Food chains
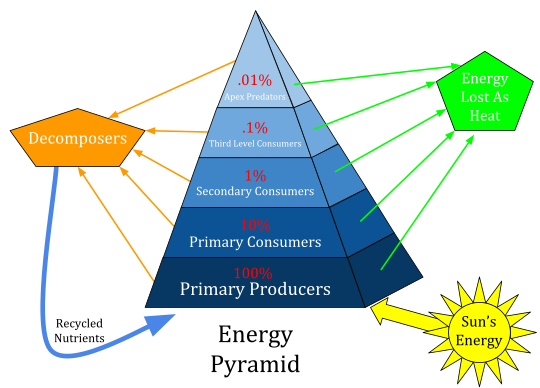
Green plants, cyanobacteria and some Protocista are known as producers as they convert the light energy from the sun into chemical energy.
They use this energy to make carbohydrates, which are the energy source for successive organisms in the food chain.
Only a small proportion of the total energy that reaches the plant as light is incorporated into plant tissues.
Herbivores are primary consumers.
Carnivores are secondary, tertiary and higher consumers.
Each group operates at a feeding or trophic level, and passes on its energy to the higher trophic level via consumption.
This energy is incorporated into the molecules of the consumer.
There is a loss in energy at each level.
As energy is lost, energy flowing through the ecosystem reduces and ultimately the energy leaves the ecosystem as heat.
Decomposers
When producers and consumers die, their energy remains in the organic compounds they leave behind.
Detritivores and decomposers are saprobionts - they derive their energy from dead and decaying organisms, and contribute to the recycling of nutrients.
Detritivores are organisms which feed on small fragments of organic debris known as detritus (remains of dead organisms and fallen leaves).
Examples are earthworms, woodlice and millipedes.
Decomposers are microbes that obtain nutrients from dead organisms and animal waste. They complete the decomposition process.
Examples are bacteria and fungi.
Food chains and their length
Food webs show how organisms in a community interact through the food they eat
A food chain is a linear sequence of these organisms.
‘a grazing food chain‘ with three consumers looks like:
1st trophic level - producer.
2nd trophic level - primary consumer (herbivore).
3rd trophic level - secondary consumer.
4th trophic level - tertiary consumer.
At each link, energy is lost.
For this reason, chains are normally limited to four or five levels, although many other factors can affect this:
The more energy that enters at the first trophic level, the longer the overall chain.
Tropical food chains tend to be longer than arctic ones due to the constant high light.
More efficient energy transfer between levels.
Larger ecosystems.
Three-dimensional environments (aquatic systems and forest canopies) have longer food chains than two-dimensional environments (grasslands).
Photosynthetic efficiency
Energy throughout the food chain originates from solar energy.
Around 60% is not absorbed due to it being the wrong wavelength, reflected by the leaf and transmitted straight through the leaf.
Photosynthetic efficiency (PE) is calculated by:
Quantity of light incorporated into the product(s)/quantity of light falling on the plant x 100.
In wild plants, this can be as low as 1%. In crop plants, which have been selectively bred for high production, this can be 7-8%.
Therefore, efficiency depends on a plant’s genotypes and environmental factors such as light intensity and temperature.
Primary productivity
Primary productivity is the rate producers convert energy into biomass.
Gross primary productivity (GPP) is the rate of chemical energy production via photosynthesis in a given area in a given time, so units are kJ m-2y-1
A substantial portion of this is used for plant respiration, for processes such as protein synthesis.
Energy left is net (or nett) primary productivity (NPP) and this represents the energy in the plant’s biomass.
This is the food available to primary consumers, or the yield that can be harvested in crop plants.
Energy flow through food chains
Secondary productivity is the rate at which consumers accumulate energy from consumed biomass (food) in their cells and tissues.
This occurs in heterotrophs.
As energy is passed along the chain, it is lost due to:
Energy remaining in egested molecules.
For example, in cows cellulose remains are passed out in faeces, which contain a high proportion of undigested material.
Around 60% of intake is lost to waste products.
However, this energy is not lost from the ecosystem as it is available to decomposers.
As carnivores have a protein-rich diet, it is more readily and efficiently digested.
Around 20% of intake is lost to waste products.
Energy lost as heat due to respiration-fueled processes, such as muscle contraction.
Around 60% is lost this way for secondary consumers (carnivores).
Around 30% is lost this way for primary consumers (herbivores).
Energy remaining in uneaten parts of an organism, such as plant roots and animal bones.
Conversion efficiency - how much energy is converted into biomass - is around 10% in herbivores
Carnivores have a higher conversion efficiency, around 20% due to their easily digestible food.
Calculating the efficiency of energy transfer
The equation is:
energy incorporated into biomass after transfer/energy available in biomass before transfer x 100.
The first part includes energy passed on to the next consumer, and energy given to decomposers.
The second part is the total energy consumed.
Ecological pyramids
This is a diagram that shows a particular feature of each trophic level in an ecosystem.
Producers are at the bottom and successive trophic levels are drawn above.
Bars are used to give it a pyramid shape.
The bars are proportional to the units they represent
They are useful for describing ecosystems, they do not take account that some organisms can operate at multiple trophic levels.
This is a specific issue with omnivores, such as humans.
There are three types.
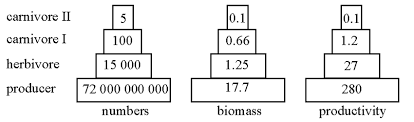
Pyramids of number
These are relatively easy to construct but have many issues:
Organism size is not accounted for.
Juveniles and adults are grouped together.
Number ranges may vary so much they are hard to draw.
The pyramid can become inverted as previous trophic level has less organisms than the one above.
This can occur if the producer is trees, as few of these can feed many organisms such as caterpillars.
Pyramids of energy
This is the most accurate way of representing feeding relationships, as it shows the energy transferred between trophic levels per area per unit time.
There is no chance of inversions as energy is always lost between conversions
It is made easy to compare energy transfers between trophic levels between communities.
Pyramids of biomass
Energy is incorporated into the macromolecules that make up the biomass of an organism.
Therefore, more biomass = more energy flowing through an ecosystem.
Therefore, this is closely related to energy flows through an ecosystem.
These again have many issues:
Biomass is hard to accurately measure.
Does not indicate productivity or the amount of energy flowing through an ecosystem.
They may be inverted.
Trophic levels may seem to contribute more to a higher trophic level than they actually do.
This is due to organisms containing inedible structures, such as bones and beaks.
Species with similar biomass may have different lifespans, so a direct biomass comparison is misleading.
Inverted biomass pyramids
Phytoplankton are major producers in aquatic ecosystems. They reproduce extremely quickly, and are eaten quickly.
This means their standing crop (mass of individuals at a given time) is lower than the biomass of the zooplankton, which eat them.
Communities and succession
Ecosystems are dynamic and change over time, due to environmental or population changes.
This change over time is known as succession, and occur over decades or even millions of years.
New species invade and replace existing ones, until a stable community - a climax community - is established.
Primary succession
This is the sequence of changes following introduction of a species into a habitat that has never had a community, such as bare rock.
This sequence of communities over time is a sere, and each stage is known as a seral stage.
A sere in a very dry environment is known as a xerosere.
Each seral stage alters the environment, making it more suitable for other species.
This happens as new species immigrate and outcompete those already present.
An example is in the UK, after the last ice age bare rock underwent a xerosere succession to forests:
The first species to colonise are algae and lichens - known as pioneer species and form a pioneer community.
The rock is weathered, eroded by lichens and accumulates dead and decomposing organic material.
This leads to the formation of a primitive soil, and animals (ants, spiders, mites) can survive when there is enough food.
Wind-blown spores than allow mosses to grow, and eventually grasses and other small plants outcompete mosses.
Well-dispersed species with lots of seeds that can germinate in direct sunlight are favoured.
Tall grasses allow shade-tolerant species to become established, allowing the community to become more complex.
These plants and animals decay and die, thickening the soil with more minerals. This increases humus (organic material formed from dead/decaying matter) quantity, allowing more water to be held.
This allows for deeper rooted plants to develop, such as shrubs and trees.
The soil continues to deepen, and humus and minerals increase.
Over large periods of time, large trees such as oak outcompete shrubs and small trees.
These form a stable, self-perpetuating climax community which has a large species diversity, complex food web and is dominated by long-lived plants.
The species of this community will rely largely on the climate, so this is also known as the climatic climax community.
Animal diversity is at its highest, including invertebrates and vertebrates.
However, plant diversity decreases due to the tree canopy limiting light reaching the woodland floor.
The community has equilibrium between:
GPP and total respiration.
Energy used by sunlight and released by decomposition.
Nutrient uptake from soil and return via organism decay.
New growth and decomposition.
As a xerosere progresses, it increases in:
Soil thickness.
Availability of water, humus and minerals.
Biomass.
Biodiversity.
Resistance to invasion.
Stability against environmental disruption.
Secondary succession
This is the recolonisation of a habitat previously occupied by a community, but disturbed, for example due to a flood or deforestation.
This happens rapidly by a succession of organisms.
The actual species depends on the conditions prior to disturbance, such as soil content and thickness.
Seeds and spores can remain in the soil.
This is much more commonly observed and studied than primary succession.
Dis-climax
Human interference can interfere with the development of the climatic climax community. Examples are:
Livestock grazing maintains grassland and prevents trees and shrubs from growing.
Land farming removes all non-farmable plants.
Deforestation removes large tree communities.
An example of managing succession is in heather moors, done to maintain ideal hunting grounds for birds such as grouse.
The birds feed on young heather shoots, so every 12 years in autumn or winter the plants are burned.
This leads to a secondary succession of heather shoots, with the pioneer phase (first growth phase) being better for grouse to consume and the building phase (second phase) providing the best nest shelter.
Without management, heather shoots reach the final degenerate phase and conditions would be unsuitable for grouse.
Factors affecting succession
Migration
Spores, seeds and animals immigrating into communities is vital for succession.
They alter the community by changing food webs, and the soil by both consumption and decomposition.
Competition
In all communities, competition is necessary for resources.
For plants, this is light, space, water and nutrients in the soil.
For animals, this is food (vegetation and other animals), shelter, space and reproductive partners.
There are two types of competition:
Intraspecific - Competition between individuals of the same species.
This is density-dependent, as it increases with the species population. As more individuals exist, more fail to obtain food, water, etc.
This is necessary as populations produce more offspring than the carrying capacity, and this is regulation.
Those with the most beneficial alleles, such as camouflage for hunting or longer roots, reproduce and survive better than other members of the populations - natural selection.
Interspecific - Competition between individuals of different species.
Species may have common needs, such as water, but they also have individual requirements.
This is known as a niche - occupying a specific place and having a particular role within a community. This is the total description of an organism’s way of life.
Competition occurs at all seral stages, and outcompeting is how succession progress - herbs outcompete mosses, and then are outcompeted by shrubs.
Outcompetition happens as two species cannot occupy the same niche in a specific habitat, the one with a competitive advantage will win.
An example of this is Gause’s experiment into two bacterial species who consumed yeast.
When cultured separately, they showed typical one-step growth curves.
When cultured together, the faster growing and smaller species outcompeted and killed the other species.
This lead Grouse to formulate the ‘competitive exclusion principle‘ - when two species occur in one habitat with the same species, one will outcompete the other.
Facilitation
The association between individuals of two species is known as symbiosis.
There is a range of interdependence, in some cases this is long-term and largely depend on each other, in others the association is loose.
Ecology looks at two types of interactions:
Negative interactions, such as predation and competition.
Positive interactions, known as facilitation. This is increasingly significant in complex communities.
It provides better resource availability and refuge from stress, predation and competition.
There are two types of facilitation:
Mutualism - An interaction between species which is beneficial to both. Examples in a xerosere are:
Highly inter-dependent reactions between fungi and algae or cyanobacteria in lichens.
Mycorrhizae - the close association between fungi and plant roots.
Relationships between flowering plants and pollinators, such as bees and horse chestnut trees.
A loose association between birds that eat insects off deer.
Commensalism - A loose interaction between members of two species, where one is benefited and one is unaffected.
Squirrels in a climax oak tree is protected from predators and sheltered, but the tree is unaffected.
Nurse plants make a canopy that protects other species, such as allowing seeds to germinate. While they are growing, the nurse plant is unaffected, but when it is done they may compete with one another.
Over time, relationships between species can change.
For example, human gut bacteria provide humans with vitamin K, which can also be provided from the diet so a human is unaffected.
However, if the diet does not produce enough vitamin K, the relationship is mutualistic.
Recycling nutrients
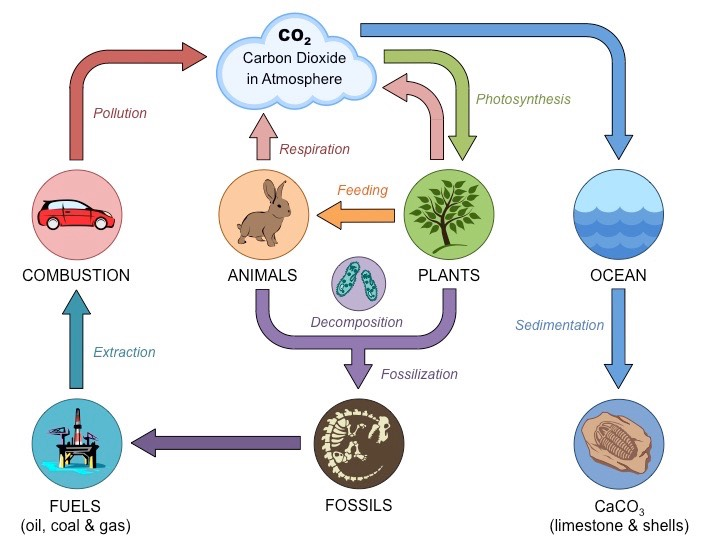
Carbon cycle
Carbon is a component of carbohydrates, fats, proteins, etc.
It is necessary in respiration, photosynthesis and combustion.
On land
This starts with CO2 in the air.
This is then taken in by plants, which can either:
Respire it into the air.
Be eaten by consumers.
Die.
Consumers, can either:
Be respired.
Eaten again.
Die.
When dead, they are either:
Respired by decomposers.
Have decomposition prevented, and therefore form fossil fuels.
Aquatic
CO2 is soluble in water and forms HCO-3.
It is taken in by plants, and can either:
Respire into air.
Be eaten by consumers.
Die.
In consumers, it can either:
Respire into air.
Be eaten again.
Die.
Be incorporated into magnesium and calcium carbonate in shells and exoskeletons.
After death, this sinks and forms components of chalk, limestone and marble.
When dead, they are either:
Respired by decomposers.
Have decomposition prevented, and therefore form fossil fuels.
Human impact
Deforestation
This increases CO2 concentration in two ways:
Less trees=less photosynthesis=less CO2 taken in.
Trees are cut down, then burned or left to decay, which releases CO2 into the atmosphere.
Climate change
Increases in CO2 has changed temperature, rainfall and wind patterns. There are two major reasons for this:
Burning fossil fuels accounts for most of this increase.
This is worse in industrialised countries, and increases with industrialisation and more global transport.
Deforestation. Nature Conservancy estimates human activity has reduced global forest area by 40%.
Greenhouse effect
This is caused by greenhouse gases, known as they act like glass in a greenhouse. This includes carbon dioxide, methane, nitrous oxide, CFCs, ozone and water vapour.
These gases allow high energy, short wavelength solar radiation to pass through Earth’s surface.
Most of this is absorbed by the Earth, which warms up and re-radiates (emits) lower energy, longer wavelength infrared radiation.
The gases re-radiate this energy in all directions by trapping it from escaping the Earth.
This warms up the planetary surface and atmosphere.
This is a natural process, without this the Earth’s temperature would be around -20 degrees - too low to sustain life.
Global warming
This is the term given to the enhanced greenhouse effect caused by greenhouse gases.
Climate scientists estimate that even if all emissions stop, temperatures will still rise by 1.5 degrees over 100 years.
If the concentrations continue to rise, the average temperature could rise by 6.5 degrees over 50 years.
Consequences of this include:
Polar ice melting and flooding coastal areas.
Increases in extreme weather conditions, such as hurricanes, cyclones and droughts.
Increased frequency of forest fires.
In tropical areas, low water availability leads to the formation and expansion of deserts.
Evolutionary adaptation is slow, meaning animals must move to more suitable environments, and plants can only do this through seed dispersal.
If this is not fast enough, they are driven to extinction, alongside the animals that eat them. This could cause entire ecosystems to collapse.
Fishing and farming areas may move with climate changes, as higher temperatures and droughts may harm the plants.
Increased crop yields, alongside increased pesticides.
World food production may decrease, especially in North America and Central Asia.
This could have major economic and political implications.
Increased CO2 in the ocean can decrease the pH. This can:
Harm mucus secreted on fish gills for protection, and therefore stop gas exchange.
Harm external skeletons of coral reefs, as these are made largely from calcium carbonate, which is soluble in acid.
Agriculture
This is majorly affected due to the extreme weather and low water availability.
Agriculture has many global warming related issues:
Carbon dioxide is produced due to decomposition of soil organic matter. This could be improved by:
Conservation tillage - Leaving crop residues on the soil to reduce erosion, improve water use and add organic matter to the topsoil.
Cover cropping - Using another plant, such as clover, to cover soil to protect and improve it to improve crops. This enhances soil structure and adds organic matter to topsoil.
Crop rotation - Reduces pest numbers and mineral depletion.
Methane is produced due to livestock digestion and decomposition in wet soil. This could be improved by:
Reducing intake of dairy and meat products.
Cows’ diets having more high-sugar grasses, oats, rapeseed and maize silage to reduce methane output.
Growing rice that requires a drier environment.
Growing rice with higher yields.
Adding ammonium sulphate to fields, as this favours non-methane producing microorganisms.
Nitric oxide and nitrous oxide is produced by waterlogged and anaerobic soils. This could be improved by:
Improved drainage.
Low, fluctuating water supplies caused by low rainfalls and high temperatures. This could be improved by:
Drought-tolerant crops, such as in Kenya with drought tolerant cowpea increasing yields.
Raised sea levels cause cultivated land to be covered by sea water. This could be improved by:
Growing salt-tolerant crops, such as salt-tolerant potato.
Carbon footprint
This is a way of measuring a contribution to greenhouse gases, and can be a product, person or a service within a year.
It can include all greenhouse gases, not just CO2.
Crops incur indirect sources of greenhouse gases:
Production of farming tools.
Production of insecticides, herbicides, fungicides and fertilisers.
Farm machinery is powered by fossil fuels.
Transport of produce, crops can travel 100s of miles to processing plants pre-distribution.
The 3Rs are recommended to reduce greenhouse gas output; reduce, reuse, and recycle. These emerge for the first Earth Day celebration in 1970, and recommend:
Recycling packaging.
Driving less.
Using less AC and heating.
Eating less meat due to methane, transport, packaging and the highly processed content.
Avoid food waste.
Plant trees in deforested nations.
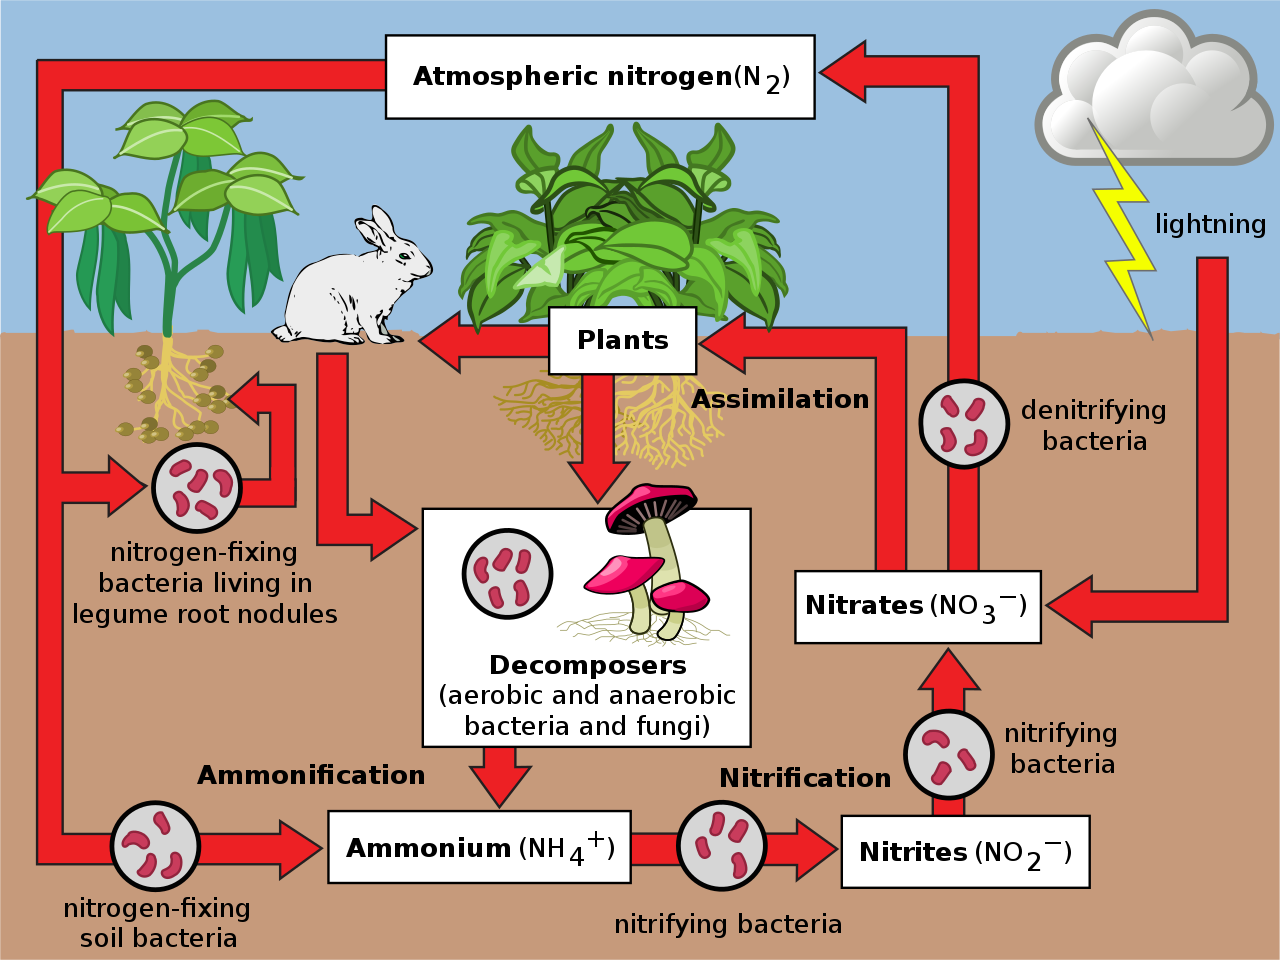
Nitrogen cycle
The flow of nitrogen atoms between organic (with carbon), inorganic and atmospheric gas.
Nitrogen is needed to make amino acids, proteins, nucleic acids, etc.
It has four main processes, each requiring a bacteria:
Nitrogen fixation - The removal of nitrogen from the air and conversion into ammonium. Very few organisms are able to use nitrogen, even though it makes up 79% of air, as it is difficult to break the triple bonds between molecules.
It is done in 5 steps:
N2 is reduced, using the enzyme nitrogenase, which requires ATP and therefore aerobic conditions.
This makes NH4+.
This is turned into organic acids.
This is turned into amino acids.
Then finally converted into bacterial proteins.
There are two ways this is done:
From the air to the soil, using the bacteria Azotobacter. This is most of nitrogen fixation.
From the air to plants, specifically legumes (peas, beans, etc.). This is done by mutualistic bacteria, such as Rhizobium.
Nitrogen gas is diffused in via the legume root nodule.
This is a reduction reaction, and is poisoned by oxidising conditions. Therefore, legumes produce leg-haemoglobin which binds molecular oxygen to protect the oxidation reactions. This makes the nodules pink.
Some of the produced amino acids and ammonium ions are diverted into the vascular strand connected to the plant, making this a mutualistic relationship.
New legumes do not have Rhizobium, and so their radicle and Rhizobium secrete chemo-attractants.
This causes the radicle to grow towards Rhizobium cells, and the Rhizobium cells to use their flagella to move towards the radicle.
The cells then invade the cortex and multiply rapidly, causing the swelling known as the root nodule.
Ammonification, or putrefaction - The converting of proteins into ammonia.
This is done by decomposers in the soil, which secrete enzymes to decay dead organisms.
Deaminases remove the NH2- group from amino acids and reduce them to ammonium ions NH4+.
Proteases digest proteins to amino acids.
Nitrification - Addition of nitrites and nitrates into the soil.
Ammonium ions, NH4+, are converted to nitrites, NO2-, and then nitrates, NO3-.
Nitrites are made using Nitrosomonas bacteria.
Nitrates are made using Nitrobacter bacteria.
These are oxidation reactions, as hydrogens are lost, therefore aerobic conditions are required.
Denitrification - Loss of nitrate from the soil.
Done by Pseudomonas bacteria in the soil, especially waterlogged soils as it is an anaerobic bacteria.
This converts nitrate to nitrogen, allowing it to enter the air.
Human impact
Agricultural nitrogen usage
There are many methods to improve nitrogen circulation within agricultural soils:
Ploughing improves soil aeration, favouring:
Aerobic bacteria, such as Nitrobacter, Nitrosomonas, Azotobacter and Rhizobium.
Plant aerobic respiration, allowing for ATP and therefore more active transport.
Land drainage, harming anaerobic bacteria that would denitrify the soil.
Artificial nitrogen fixation, such as the Haber process, converts nitrogen to fertilisers.
These compounds largely contain ammonium and nitrate ions, and bacteria is used to improve these concentrations.
There are four fertilisers:
Animal waste can be used as ‘brown‘ manure.
It contains nitrogen and other nutrients essential for plant growth.
Soil structure is improved, becoming more able to store nutrients and water, and more fertile.
Microbial activity is encouraged, producing more ammonium and nitrate ions.
Nitrogen is released slowly, over a prolonged period.
It is transported in large containers via road.
Slurry is made from manure and water, using more intensive livestock-rearing systems with concrete and slab over straw bedding.
It is usually stored in a tank or lagoon before usage.
Pig slurry is usually injected due to its repulsive smell, and alternative pig feed is being produced to reduce this issue.
Herbivore manure has a milder smell due to less protein.
Treated sewage sludge, known as ‘biosolids‘, is a sustainable alternative to organic fertilisers.
Fields of legumes enhance nitrogen fixation.
Legumes are ploughed back into the soil as ‘green‘ manure after death, due to its high nitrogen content.
Effects of fertilisers
Upland streams are oligotrophic (they have very few minerals dissolved in them).
As water flows over rocks, minerals are dissolved and their concentration increases.
Water enriched with minerals is known as eutrophic.
Water with too high a mineral concentration is known as dystrophic.
This increases the salt concentration of lakes and rivers, which would normally reach equilibrium, causing eutrophication.
Eutrophication is the process of fertilisers artificially raising the mineral concentration of these areas, as fertilisers are leached from agricultural land. This occurs in 5 steps:
Nitrate is a fertiliser, and algae respond creating an algal bloom. The water then becomes green and light is unable to penetrate.
Plants in deeper regions cannot photosynthesise and die.
The short-lived algae also die, and saprobiontic fungi decompose them.
They are aerobic organisms, and create a biochemical oxygen demand (BOD).
Water in all but the upper layers is deoxygenated, killing all oxygen-requiring species, such as fish.
Anaerobic bacteria in the water which reduce nitrate to nitrite flourish.
Some species release gases with characteristic smells such as hydrogen sulphide.
In soils, excess nitrate can reduce species diversity as grass and nettle growth is increased, shading out smaller plants.
To avoid this, farmers must comply with strict legislation to reduce nitrate quantity released:
Fertiliser applied to soil is restricted.
Fertilisers can only be applied when crops are actively growing, so it is readily used and not able to be leached away.
A strip at least 10m wide must be left next to watercourses, so nitrate cannot directly enter waterways.
Drainage ditches are dug. Minerals concentrate in the drainage ditches, which undergo eutrophication to protect the natural watercourse.
Water flows slowly in these and they accumulate landfill.
This lowers invertebrate biodiversity and species diversity in adjacent grasslands.
However, rare species have been reported growing in drainage ditches due to their unusual conditions.