Biol 414 Exam 2 Short/Long Essay Practice
Section H
Question: Mark-recapture techniques can be used to
estimate populations of mobile animals. For
mark-recapture describe:
1. A simple definition.
2. The equation used, including labeled
variables.
3. An example using this math
4. At least 2 assumptions of MR and how
violations of each would bias the outcome
Answer:
Mark recapture is a method that can be used to estimate the size of a population based upon the numbers of captured and tagged individuals at two different times
M/N=m/n
M-the number of indivudlas tagged at T1
N-estimate of the population
m-number of indivudulas aptured at T2 and tagged at T1
n-number of individulas captured at T2
For example, 20 individulas were captured, tagged at T1, and realsed. At T2, 10 individulas were captured that had been tagged at T1 and 8 individulas were captuted that had not yet been tagged. From the data, the population would be Mn/m=(20)(8)/(10)= 16
One assumption is that all individulas of the population are equally liktley to be captured. If individuals ineqaully likely to be caputred this could lead to the lowering or raising of the estimate depend if they are more or less likely to be trapped.
Another assumption it that none of the individuals that were marked are lost. If some of the marked were lost, this could lead to an overestimate.
A third assumption is that the populatio has not increased by biths or immigation between markinga nd recapture. This could lead to an underestimate of the population size.
Section I
Question: Explain what a cohort life table and fecundity schedule are? Make up a
simple combined cohort life table and fecundity schedule, with
between 5 and 8 rows in it. Fill in all the necessary columns and
numbers to get to the reproductive growth rate for the species, and
compute the growth rate. Make up the data that would be measured
from the field, but do actual computations for the other columns, so
the numbers should be correct, given the made-up data. Briefly explain
how one would gather the necessary data from the field. Explain the
meaning of each column and how it is computed.
Answer:
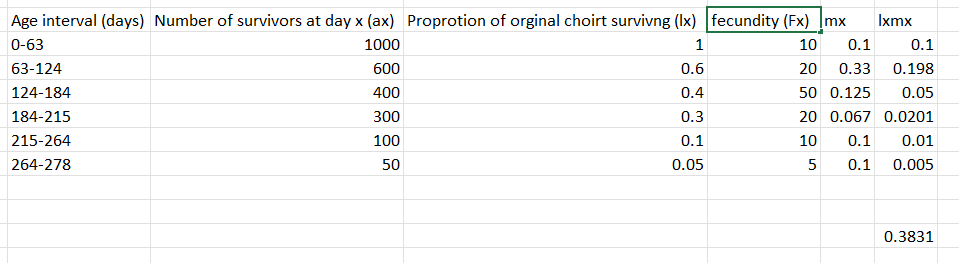
A cohort life table shows the number of suriving and passed indivudulas within a group that was born at approximately the same time. The fecundity schedule is an additiaonl column of information taht tells the number of offspirg produced between a set time.
Cohort life tabels and fecundity sechouldes are used for annual or seeilse species since it requires offlowing a set of invididulas thought their lifetime. This would be didfficult for a sepices taht moved or had a long lifetime.
The data collect form the filed would be the number of survivors from the choort for each time interval and the fecunity for each time interval (such as seeds prouced). All other values are calucted from this data gathered. The first column of the graph is the time interval. The next is nuber of the choort survivng for each time interval (ax). The next column is the proortion of hte orignal cohort surviving (lx). The fecudnity is next and is measured int eh filed (Fx). Next is the offspirng produced per invidila calcuated by diving Fecundity by the surviviors (Fx/ax). Finally the last column is calcualted by miltplying the fecunidty per invidial by prophritono of the survivng cohort. It is then added up to find the net reproductive grwoth rate or the average number of offsproing per surving individual. If it is great thatn 1 the poputian is gowing, less than one the population is shrinking.
Section J
Question: Give two examples of mathematical models as quantitative
expression of a hypothesis. Make sure to name the hypotheses and
elaborate how the models are expressing them quantitatively.
Construct your examples so the second model is a refinement of the
first. Discuss how the models facilitate exploration of the
consequences of the hypotheses, and how the first model helps build
toward a better hypothesis, which is then expressed in the second
model. Make sure to state the name and meaning of all terms in your
models.
Answer:
Model 1: dN/dt=rN
Model 2: (dN/dt)/N=r(1-(N/K))
The first equation is the equation for the expeonential grwoth model which hypothesizes taht population grow exponentailly at some rate [r] in proprotional to the current population. dN/dt is the change in population with respect to time. R, as mentioned is the intrinsic grwoth rate and N is the populatin at some time t. While this model is true at times, when the population is small and there are sufficent resouces avaliable, as teh populatin contimues tp grow inreality it will eventually reach a limit. The next model imparoves upon the original by incluidng this limit.
The second equation is an improbemtn on the first and takes into consideration the limit of the resouces of an enviroment on the number it can support. In this equation, the symbols are the same as the previous equation. The added variable K represetns the carrying capacity or the limit of how many invdivials within a population can be supprted in a specifc area. This model improves the oringail by including how population growth changes based upon how large the popultin is. A larger population has fewer resucous for each indivulas and will now gorw at as high a rate as a smaller population with more resources per individual. Growth will will being large and overtime slow until it reaches zero. This change in grwoth as a result of a grwoing popualation occurs in a linear fashion.
The seocond model can ealiy be seen as a improemvent towards a better model. Obsevation of real populations has shown that a popualtion does not forever to conutnue to grow exponentially, it is not realisitc. By adding the consideration of carrying capacty, the second equaiton shows how grwoth can be exponenital at itmes, but eveiatll slows down and is curbed by environmetnal limitations.
Question: Short answer) What is density dependence? Give an example.
Answer: the relationship between population growth rate and population density, helps to regulate population size. An example of density depenece is food limitionat. As poplutaion increases ther is less foo avaliable per indivdiual meaning fewer birhts and more daths leading to the lowering of the piopulation.
Question: Explain how and why density dependence is necessary for
population persistence. What is the link to the difference between
population limitation and regulation? Make sure your answer includes
examples of limitation and regulation that help link these concepts
with density dependence and population persistence.
Answer: Density dependence helps regultate popualtin size. Limintng factors stop populations form increasing exponentially. AN exmaple would be bad ather or natural diasters which can lead to the reduction in population. Regulating facotrs are a subset of limitng facotrs that help to bring populations back to equlilbrium. An exapmpoe woould be food limiation. When the population beings to surpass its limit, there is not enough food for all so less are born and more die. The oppostie is true for th popualtion when it is very small. For a popualtio to persit is is idaelly kept near eaulioibrium which is regulated by the facots listed above.
Section K
Question: Define “life history” as we mean it in this class
Answer: Timing and sequence of events related to survival and reproduction. It also relates to the associated suite of adaptations taht determine the life cycle and which affects the organisms’s success in producing descants.
Question: Describe one common life history tradeoff and give a specific example
Answer: Organims can procude either large offspring or many offspring, but not both. In class one exapmle used was research from plnats which showed at as seed size increased, the number of seeds produced decreased.
Question: Thoroughly discuss the key features, assumptions, and predictions of the
following two life History Classification Schemes: _____; _____; . In doing so, be
sure to clearly convey what is unique about each scheme?
Life History models/classification schemes discussed in textbook and/or in lecture:
Answer: 1. r - k selection
An r selected speices is one that has a high growth rate. It is not favor against competiotn. It shows reapid development and early reoduciton, prodcing many small offspring. An example would be fish. In contrst, K selected speaice are favored afainst competiotn. They have a low grouwth rate, develop slowly, have larger offspirng less often and fewer. An example would be elephants. These are oversimplifications but some patterns can be seen in real life.
2. Grime’s Life History Classification
Four extreme environmental types charactierized by comvinations of disturbance and stress intensity. (low/low, low/high, high/low, and high/high). Highly disturbed pants may depend on distubrance to persisit in face of compaetiton. Stress tolerant live under low/high and gow slowly, atke advantage of infrequent favorable perionds for growth/reproduction. low/low have potential to gorw well but compete iwth other species.
3. Winemiller and Rose Life History Classification
Drew attention to survivorship of juvelines, fecundity, and gernation time. Opportunitstic stragety of low juvenile survishop, lwo numbers of offspring, and early reproductuve matury maximizes colonzing ability. Equliibrium stragety combines high juvenile survivoruship, late reproductive maturity, and low offspring numbers.
4. Charnov Life History Classification
Converted life history featres into dimensionless numbers and allwoed to see similarities withing groups and their differnes. Show dfiierencse in life hisotueis between birds, mammals, and lizards. Looked at relative reproductive effort verseus realtive offspring size.
Question: Explain the main reasons for modern changes in phenology and
describe an example you have read about which illustrates changes in
phenology.
Answer: The main reason for modern change in pehnolgy comes from climate change and rising themperturs. This has led to certain phenological events to occur earlier than they once did. One example from the lecutre was japanese cheery blossoms. Since a festival is thypiclaly held each year when they bloom, there is data going back may years showing that the date of blooming is tending to come earlier.
Question: Describe the match-mismatch hypothesis, how it relates to
phenology, and what the consequences are of a mismatch
Answer: The mismatch hypthoeiss states that as modern chanes in phenology occur, evetns that once coineced and impacted each other no longer will, leading to events lingin up incorreclt or being mismatched. For exampel of things bloom ealier than typical, this may lead to a mismatch between the bloom’s avaliabliyt and the demand if it is eatne by a hibernating or migrating species.