BSNS 113 Exam 2024
Introduction to Economics
Definition of Economics
Economics is defined as the study of how society manages its scarce resources, focusing on the allocation and distribution of resources among competing uses.
It encompasses various aspects such as production, consumption, and the distribution of goods and services.
The field of economics is divided into two main branches: microeconomics, which studies individual agents, and macroeconomics, which looks at the economy as a whole.
Historical context: The term 'economics' originates from the Greek word 'oikonomia', meaning household management, reflecting its roots in resource management.
Case study: The impact of resource scarcity on economic decisions can be illustrated through the oil crisis of the 1970s, which led to significant changes in energy policies worldwide.
Economic Questions
The three fundamental economic questions are: What to produce? How to produce? For whom to produce? These questions arise due to the scarcity of resources.
'What to produce?' involves deciding which goods and services should be produced based on consumer demand and resource availability.
'How to produce?' refers to the methods and processes used in production, which can vary in efficiency and cost.
'For whom to produce?' addresses the distribution of goods and services among different segments of society, often influenced by income and wealth disparities.
Example: In a market economy, these questions are answered through the price mechanism, while in a planned economy, they are determined by government directives.
Market Structures and Economic Models
Production Possibility Frontier (PPF)
The PPF illustrates the maximum feasible amount of two goods that can be produced with available resources and technology.
It demonstrates concepts such as opportunity cost, efficiency, and trade-offs in production.
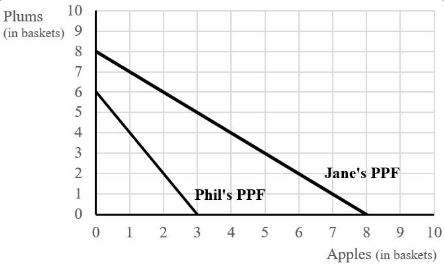
Example: If Jane can produce either apples or plums, the PPF will show the trade-off between the two, highlighting her opportunity cost for each additional basket of apples produced.
Case study: The PPF can shift outward with technological advancements or an increase in resources, indicating economic growth.
Diagram: A typical PPF curve is concave to the origin, reflecting increasing opportunity costs.
Comparative Advantage and Trade
Comparative advantage occurs when a party can produce a good at a lower opportunity cost than another party, leading to potential gains from trade.
Example: If Jane has a comparative advantage in producing plums while Phil has it in apples, they can benefit from specializing and trading.
The terms of trade must fall between the opportunity costs of both producers for trade to be beneficial.
Historical context: The theory of comparative advantage was first introduced by economist David Ricardo in the early 19th century, emphasizing the benefits of international trade.
Diagram: A graph showing the PPFs of both producers can illustrate the gains from trade and the terms of trade.
Demand and Supply Analysis
Market Equilibrium
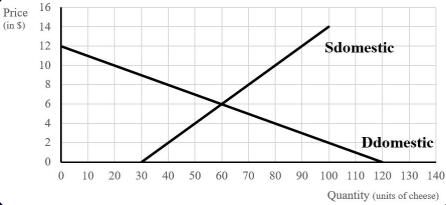
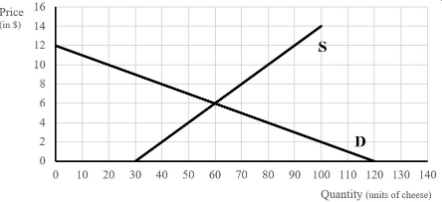
Market equilibrium occurs when the quantity demanded equals the quantity supplied at a certain price level, resulting in no excess supply or demand.
The equilibrium price is determined by the intersection of the demand and supply curves.
Example: In the cheese market, if the equilibrium price is $6 and the quantity is 60 units, any deviation from this price will create either a surplus or a shortage.
Case study: The impact of external factors, such as a subsidy or tax, can shift the supply curve, affecting equilibrium.
Diagram: A graph showing the demand and supply curves with the equilibrium point marked.
Price Elasticity of Demand
Price elasticity of demand measures how responsive the quantity demanded is to a change in price, calculated as the percentage change in quantity demanded divided by the percentage change in price.
If demand is elastic, a small change in price leads to a large change in quantity demanded; if inelastic, the opposite is true.
Example: A price increase in a luxury good may lead to a significant drop in quantity demanded, while a necessity may see little change.
Historical context: The concept of elasticity was developed in the 19th century and remains a crucial tool in economic analysis.
Formula: The price elasticity of demand (PED) can be calculated using the midpoint method for accuracy.
Government Intervention in Markets
Price Controls
Price controls, such as price ceilings and price floors, are government-imposed limits on how high or low a price can be charged for a product.
A binding price ceiling (maximum price) can lead to shortages, while a binding price floor (minimum price) can lead to surpluses.
Example: Rent control is a common price ceiling that can result in housing shortages and reduced quality of rental properties.
Case study: The introduction of minimum wage laws can create a surplus of labor, leading to unemployment in certain sectors.
Diagram: A graph illustrating the effects of price ceilings and floors on market equilibrium.
Tax Incidence
The economic incidence of a tax refers to who ultimately bears the burden of the tax, which can differ from the statutory incidence (who pays the tax to the government).
The distribution of tax burden depends on the price elasticity of demand and supply; more inelastic demand or supply means a greater burden on that side.
Example: If demand is inelastic and supply is elastic, consumers will bear a larger share of the tax burden.
Historical context: Understanding tax incidence is crucial for policymakers to assess the impact of taxation on different economic agents.
Diagram: A supply and demand graph showing the shifts due to taxation and the resulting consumer and producer surplus.
Tariffs and Quotas
Impact of Tariffs on Trade
A tariff of $2 per unit will lead to a decrease in imports, affecting consumer surplus negatively. The exact changes depend on the elasticity of demand and supply.
The options provided suggest varying impacts on imports and consumer surplus, indicating the need for analysis of market conditions.
For example, if imports fall by 30 units and consumer surplus falls by 180, this reflects a significant market distortion due to the tariff.
Tariffs can protect domestic industries but often lead to higher prices for consumers and reduced overall welfare.
Historical context: Tariffs have been used throughout history, such as the Smoot-Hawley Tariff Act of 1930, which raised duties on imports and contributed to the Great Depression.
Understanding the implications of tariffs is crucial for evaluating trade policies and their economic effects.
Quotas vs. Free Trade
A quota limits the quantity of a good that can be imported, which can lead to different outcomes compared to a tariff.
The introduction of a quota may result in some consumers benefiting while others face higher prices, leading to a mixed impact on consumer welfare.
Total surplus in the market is likely to decrease under a quota system due to inefficiencies and potential deadweight loss.
Case study: The U.S. sugar quota system has historically protected domestic producers but at a cost to consumers.
Quotas can create scarcity, leading to higher prices and reduced availability of goods, impacting overall market efficiency.
Analyzing quotas helps understand the trade-offs between protecting domestic industries and ensuring consumer welfare.
Vaccination Economics
Marginal Social Benefit of Vaccination
The marginal social benefit (MSB) of the 4 millionth vaccination can be calculated by adding the marginal private benefit and the marginal external benefit.
For the 4 millionth vaccination, the MSB is $4, indicating the value society places on this additional vaccination.
Understanding MSB is crucial for evaluating public health interventions and their funding.
Example: Vaccination programs can lead to herd immunity, benefiting the entire population beyond just those vaccinated.
Historical context: The introduction of vaccines has significantly reduced the prevalence of diseases like polio and measles, showcasing the importance of understanding MSB.
Policymakers must consider MSB when designing health policies to ensure efficient allocation of resources.
Market Equilibrium and Vaccination
In a private market equilibrium with a marginal production cost of $6, the number of vaccinations provided will be determined by the intersection of supply and demand.
The correct answer indicates that 3 million people will be vaccinated, reflecting the market's response to price signals.
This scenario highlights the importance of understanding market dynamics in public health.
Case study: The HPV vaccination program faced challenges in achieving optimal vaccination rates due to cost and awareness issues.
Policymakers may need to intervene to align private market outcomes with socially optimal levels of vaccination.
Analyzing market equilibrium helps in understanding the effectiveness of health interventions.
Market Structures and Efficiency
Perfect Competition
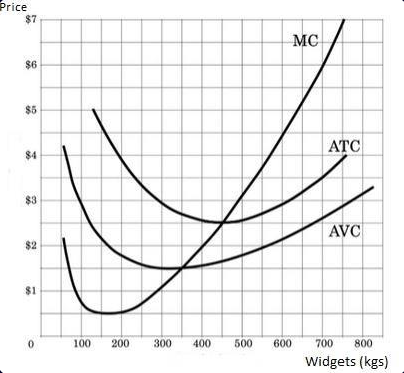
In a perfectly competitive market, firms are price takers and produce where price equals marginal cost (P=MC).
The short-run supply curve for a perfectly competitive firm is its marginal cost curve above the average variable cost (AVC).
If the market price is $6, firms will enter the industry until long-run equilibrium is restored at that price, indicating a dynamic market response.
Example: The agricultural sector often exemplifies perfect competition, with many small producers and homogeneous products.
Historical context: The concept of perfect competition is foundational in economic theory, illustrating ideal market conditions.
Understanding perfect competition is essential for evaluating real-world market structures and their efficiencies.
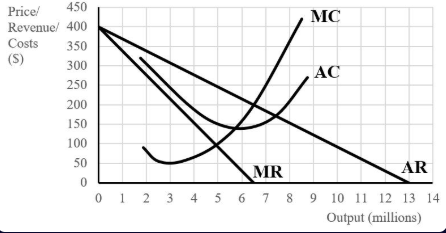
Monopoly and Market Power
A monopolist maximizes profit by setting a price above marginal cost, leading to deadweight loss in the market.
If a monopolist can price discriminate, they can capture consumer surplus, leading to different outcomes for consumer welfare and efficiency.
The deadweight loss from monopoly pricing illustrates the inefficiencies created by lack of competition.
Case study: The pharmaceutical industry often operates under monopolistic conditions, raising concerns about drug pricing and access.
Historical context: Antitrust laws were established to combat monopolistic practices and promote competition in markets.
Analyzing monopoly behavior is crucial for understanding market failures and the need for regulatory interventions.
Monopolies vs. Perfect Competition
In perfect competition, firms are price takers, leading to P = MC, which ensures allocative efficiency.
Monopolies, on the other hand, set prices above marginal cost (P > MC), resulting in deadweight loss and reduced consumer welfare.
Example: A natural monopoly, such as a utility company, may be regulated to ensure fair pricing and prevent exploitation.
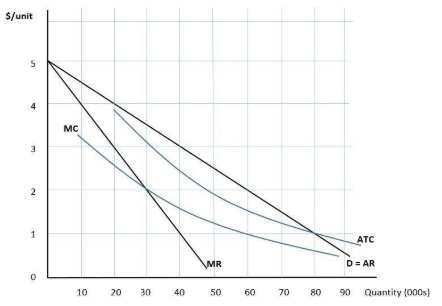
Long-Run Adjustments in Monopolistic Competition
In monopolistically competitive markets, firms earning subnormal profits will exit the industry in the long run, leading to a decrease in supply.
This exit causes the demand curve for the remaining firms to shift outward and flatten, as fewer firms compete for the same consumer base.
The long-run equilibrium results in zero economic profits for firms, as price equals average total cost.
Price Discrimination and Consumer Surplus
First-Degree Price Discrimination
First-degree price discrimination occurs when a monopolist charges each consumer their maximum willingness to pay, effectively capturing all consumer surplus.
In this scenario, consumer surplus is reduced to zero, and deadweight loss is also eliminated, as the monopolist produces the socially optimal quantity.
Example: A car dealership negotiating prices individually with each customer based on their willingness to pay.
Second-Degree Price Discrimination
Second-degree price discrimination involves charging different prices based on the quantity consumed or the product version, rather than individual consumer characteristics.
An example is offering bulk discounts, such as 'buy two, get one at half price', which incentivizes larger purchases.
This method allows firms to capture more consumer surplus than uniform pricing but less than first-degree price discrimination.
Implications of Price Discrimination
Price discrimination can lead to increased profits for firms, but it raises ethical concerns regarding fairness and equity.
It can also lead to market segmentation, where different consumer groups are charged different prices based on their price elasticity of demand.
Regulatory implications may arise, as price discrimination can be viewed as anti-competitive behavior in certain markets.
Game Theory and Strategic Pricing
Pay-Off Matrix Analysis
The pay-off matrix illustrates the strategic interactions between firms, showing potential profits based on pricing strategies.
In the given example, Alba Inc. and Iceni Corp. must consider their pricing strategies in relation to each other to maximize profits.
The Nash equilibrium occurs when both firms choose strategies that are optimal given the strategy of the other firm.
Dominant Strategies and Nash Equilibrium
A dominant strategy is one that yields a higher payoff regardless of what the other player does.
In the provided matrix, identifying dominant strategies helps predict the firms' pricing decisions and the resulting market equilibrium.
The Nash equilibrium reflects a stable state where neither firm has an incentive to deviate from their chosen strategy.
Macroeconomic Indicators and Policies
GDP Measurement and Components
Gross Domestic Product (GDP) can be measured using the expenditure approach, which sums consumption, investment, government spending, and net exports.
Understanding the components of GDP is crucial for analyzing economic health and growth.
Example: A processing plant's sale contributes to GDP based on the final product's value, not just the intermediate goods.
Inflation and the Consumer Price Index (CPI)
The CPI measures the average change over time in the prices paid by consumers for a basket of goods and services.
Calculating inflation rates using CPI data helps assess economic stability and purchasing power.
Example: The CPI increase from 1260 to 1323 indicates a specific inflation rate, which can be calculated using the formula: (New CPI - Old CPI) / Old CPI * 100.
Monetary Policy and Economic Cycles
Role of Central Banks
Central banks, such as the Reserve Bank of New Zealand, use tools like the official cash rate to influence monetary policy and stabilize the economy.
Adjusting interest rates can control inflation and stimulate economic growth during downturns.
Example: Lowering the cash rate can encourage borrowing and spending, boosting economic activity.
Business Cycle Phases
The business cycle consists of expansion, peak, contraction, and trough phases, each affecting unemployment and inflation differently.
During the boom phase, unemployment typically decreases while inflation may rise due to increased demand.
Understanding these cycles helps policymakers implement appropriate fiscal and monetary measures.