Mixed Functions
Linear: y=mx+b
Quadratic: y=ax+bx+c
Exponential: y=ab
Exponential tables have a common increase/ decrease going by multiplication
Linear tables go by addition/subtraction
Quadratic tables have two similar numbers
Linear regression on Calculator = Stat button > EDIT > type in X and Y values > Stat button again > CALC option > Option 4 LinReg (ax+b)
LinReg will go like this = a= b= r= r²=
Equation for Lin Reg = ax+b
Correlation Coefficient = r value (NOT r²)
Absolute value equation = a|x - h| + k
Parent function for absolute value : f(x) or y= |x|
Transformations for Functions
-f(x) = reflect f(x) over the x axis
f(x) + k = translates up k units
f(x) - k = translates down k units
f(x-h) = translates right h units
f(x+h) = translates left h units
LOOK OVER PAGE 8 OF NOTE PACKET TO MAKE EQUATION OUT OF A GRAPH.
Graphing Square Roots
write down the table of the x and y values
all square root functions have values for domain and range
state the transformation from the parent function
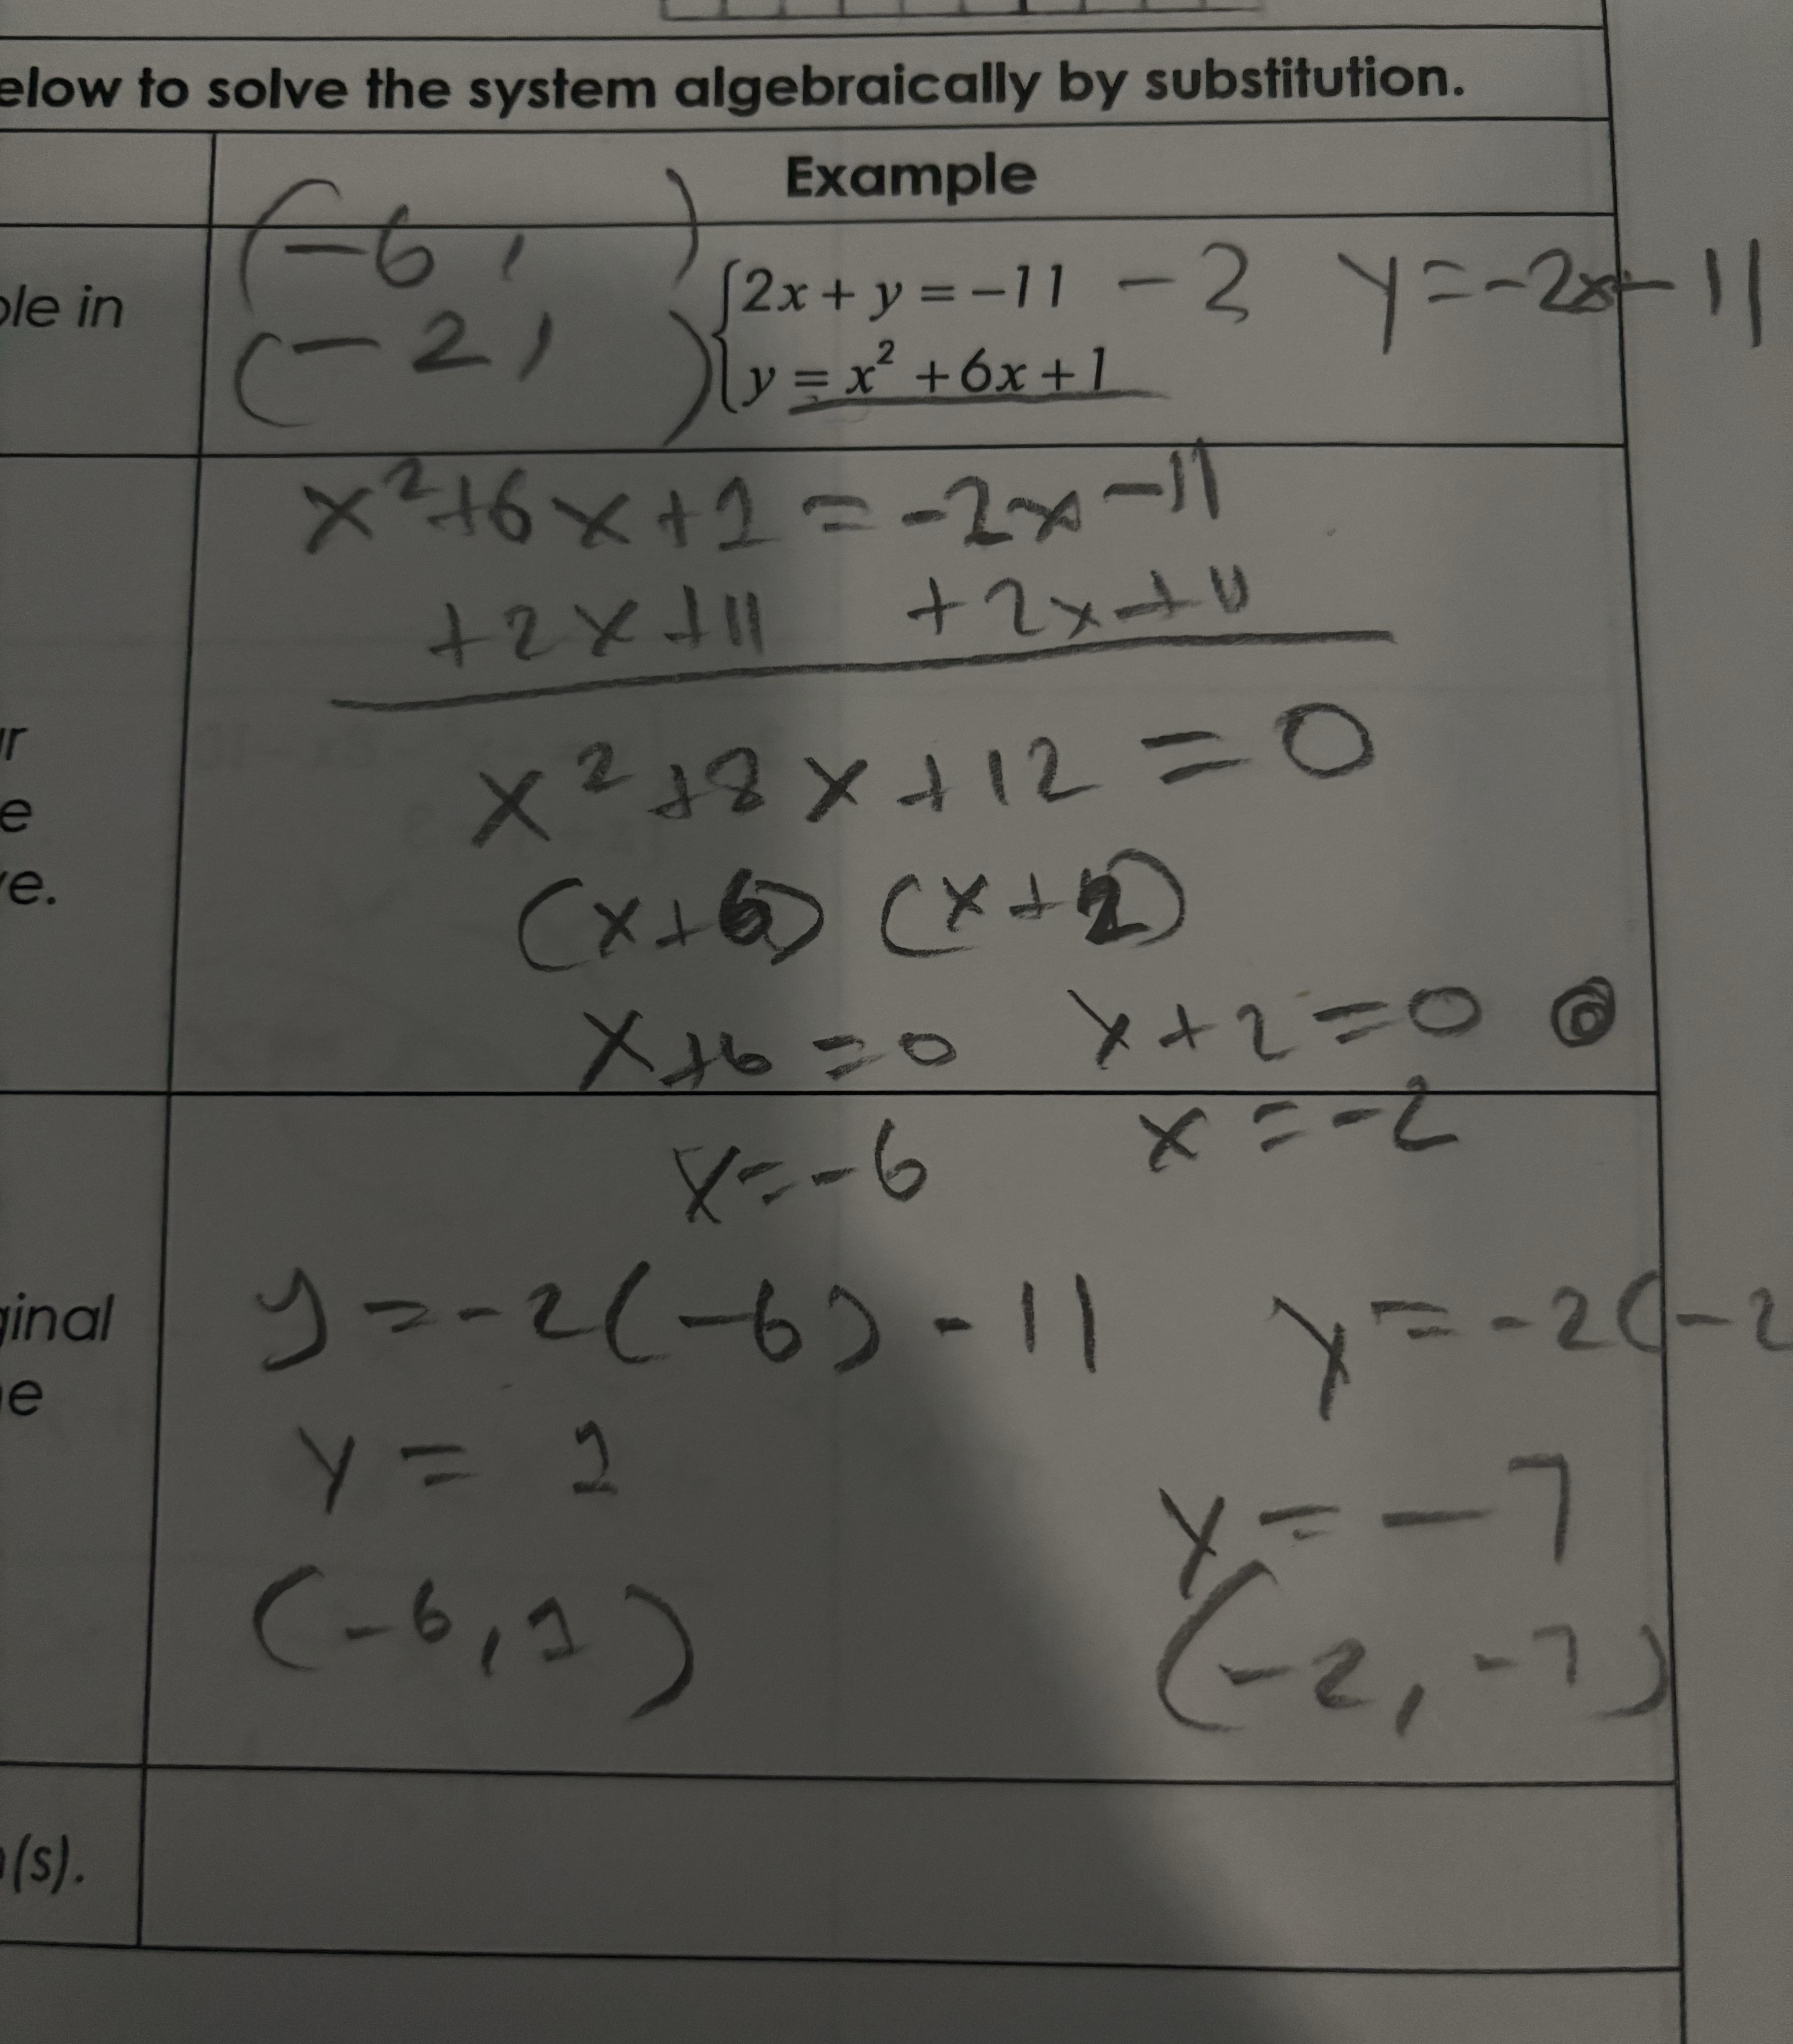
Solving nonlinear functions
Piecewise functions
< = open circle
< = closed circle
if < or > graph the numbers that are exactly greater or less
if < or > graph the number AND greater or less
LOOK OVER PAGE 18 OF NOTE PACKET