Bacterial Growth Workshop
The study of bacterial growth is important for human health, industry and the environment. Understanding and analysing bacterial growth helps us to understand and discover/create antimicrobial agents. For example, sensitivity to heat, radiation and chemical agents depends on bacterial species and genotype. Bacteria which form endospores are particularly difficult to kill.
Antiseptics kill or inhibit microbes but don’t harm living tissues. Sterilants kill all microbes including endospores. Disinfectants kill all microbes except endospores. Sanitisers kill many but not all microbes present.
Under supportive conditions, bacterial cells increase in mass and volume, their chromosome replicates and segregates and they divide. This is known as binary fission. Bacteria mainly divide by binary fission although many other variations have been seen eg longitudinal cell division, budding and synchronous bacteriovorus. Different bacteria have different supportive conditions.
Bacteria are almost always grown in pure culture: batch culture or continuous (chemostat) culture. Aseptic technique is used to prevent contamination. Conditions such as temperature and pressure must be kept controlled when culturing bacteria. There are different types of media for culturing: complex or defined.
Complex media’s exact chemical composition is unknown eg yeast extracts and casein proteolytic digests.
Defined culture’s exact chemical composition IS known. It’s used for reproducibility, investigating growth requirements, and isolation of auxotrophic mutants. Auxotrophic mutants are organisms which have a nutritional requirement through mutation.
Medium components and contaminants affect bacterial gene expression, growth and physiology. For example, lysogeny broth lacks enough magnesium ions to support proper E. coli growth. Autoclaving agar and phosphate together can generate hydrogen peroxide which inhibits growth of many species.
When growing bacteria in batch culture, no nutrients are added and no waste is removed, although usually gases are allowed to exchange. Growth conditions change over time due to cell growth. Eventually one or more nutrients becomes limiting and/or one or more waste products causes growth stasis/death.
To measure bacterial growth and death, an understanding of their physiology and growth kinetics is needed. Bacteria grown in the lab experience different growth phases with distinct physiology and characteristics in each phase. Plotting growth over time creates better understanding. This is important for planning experiments, experiment reproducibility and knowing when to take samples.
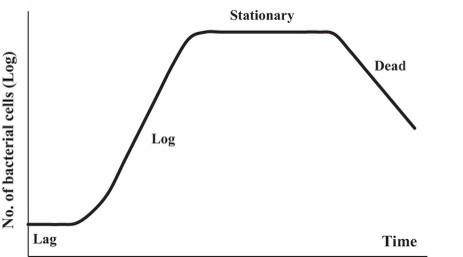
Bacteria grown in batch culture exhibit growth kinetics in the same general pattern as shown above. Bacteria have very different physiology and characteristics in the different parts of the growth curve.
The lag phase is the time required for cells to adapt to a new environment and ready themselves for growth. This involves them ‘restocking’ catabolites, anabolic metabolites, gene expression and protein synthesis of necessary enzymes. There may also be repairing of previous damage involved. The length of the lag phase depends on the condition of the inoculum and nature of the new media. It varies between species and strains.
The log/exponential phase occurs after the lag phase and is where cells are growing and dividing as rapidly as possible. Growth rate is constant and the OD600 and viable count values rise exponentially. Gradient of the slope depends on the species and culture conditions. The cells are at their healthiest during the exponential phase and subculturing during this phase minimises the subsequent lag phase. Cells in the log phase are often used experimentally to study enzymes and gene expression etc. Log phase growth is likely very rare for bacteria in nature.
The stationary phase is where growth and division slow down, and OD600 and viable count values plateau. This is usually due to decreasing nutrient availability (including oxygen for aerobes), and/or increasing waste concentration for example lactic acid. Cells often enter a state of hibernation where metabolic activity slows down or stops completely. Cell division is sometimes equal to cell death. This is known as cryptic growth and is more common in mixed and continuous cultures.
Death phase follows the stationary phase and occurs when 1+ essential nutrients is completely exhausted or 1+ waste products reach lethal toxic levels. The viable count decreases and cell lysis usually occurs so OD600 decreases. There may be temporary levelling off due to selection of resistant mutants which continue to grow or are still in stationary phase.
Growth curves can show metabolic dynamics. Biphasic growth pattern or response is where a microbe is exposed to two nutrients and initially uses one for growth then alters its metabolism to use the second when the first is exhausted. This is sometimes called the glucose effect due to historical experiments, and sometimes called diauxic. Biphasic growth pattern is usually due to catabolite repression. For example, glucose represses the expression of lactose catabolic genes eg β-galactosidase gene. Multiauxic effects can be observed.
Counter used for direct counting = Petroff-Hausser counting chamber.
Viable count (colony forming units) involves taking samples of culture at various times and diluting to manageable numbers. Dilutions are plated and incubated until colonies can be seen and counting.
Issues with viable count include the possibility of cell clumping, supportive conditions required, very time consuming and uses up a lot of plastic and reagents.
The method of counting bacteria which may be most common is measuring growth by optical density (OD). The amount of light scattered when passed through a culture is measured using a spectrophotometer known as a turbidimeter. Scattering is proportional to cell density. Around 10^5 to 10^6 cells/ml are required. It’s not possible to tell how many cells are viable and different bacteria have different light scattering properties so calibration must be carried out for accuracy.
The difference between OD and viable cell count values is due to non-viable cells. Also, at high density light is scattered away from the receiver so the OD value is an underestimate of the number of cells. Therefore cells must be diluted appropriately for OD to be measured.
The difference between the number of cells counted by microscopy and the number of viable cells that were actually plated is due to the presence of dead cells. Some cells don’t grow under the culture conditions used.
Bacterial growth needs to be plotted on a semi-log scale as it allows direct comparison of cultures in exponential phase, the slope of the straight line is the growth rate constant, and it allows for reproducibility.
Growth rate is the change in cell number per unit of time. It’s usually expressed in generations per hour so can be fractional. Generation/doubling time is the time taken for a population of cells to double in number. Doubling time varies for species and culture conditions, ranging from around 10 minutes to several hours or even years.
N = N02^n, where N = final cell number, N0 = initial cell number, n = number of generations = 3.3(logN -logN0). g=t/n.