Correlation
Key concepts behind statistical correlation
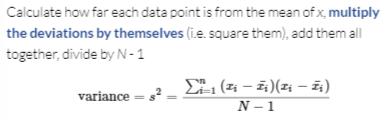
- variance - how much scores deviate from the mean, on average
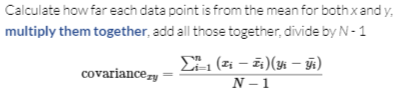
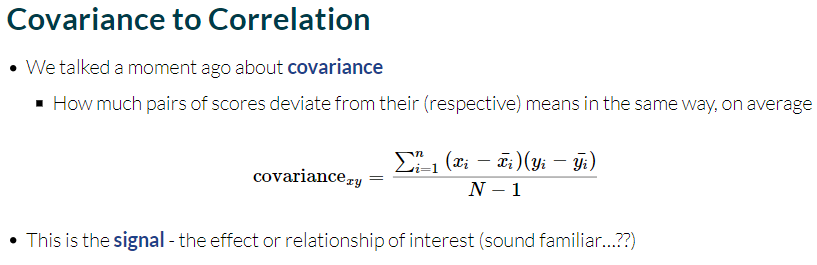
- covariance - how much pairs of scores deviate from their (respective) means in the same way, on average
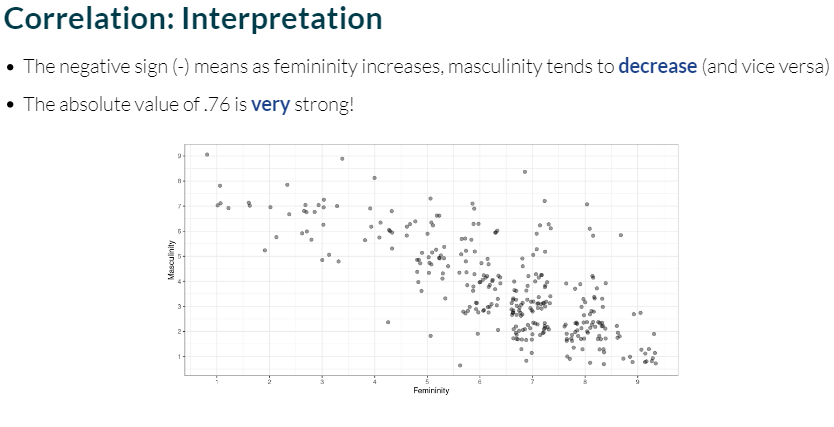
How to interpret the values of the correlation coefficient r
Pearson’s correlation coefficient
- typically used with two (or more) continuous variables
- can be used when one is categorical
- r quantifies the strength and direction of the relationship
- always has a value between -1 and 1
- strength - absolute value of r between 0 (no relationship at all) and 1 (perfect relationship)
- direction - the sign of r (positive or negative)
- positive - as one variable increases, the other tends to increase
- negative - as one variable increases, the other tends to decrease
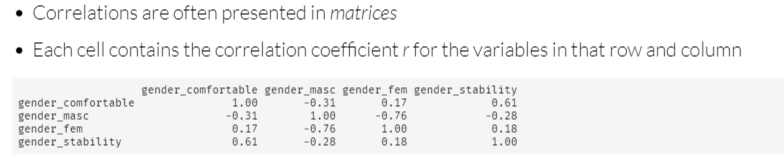
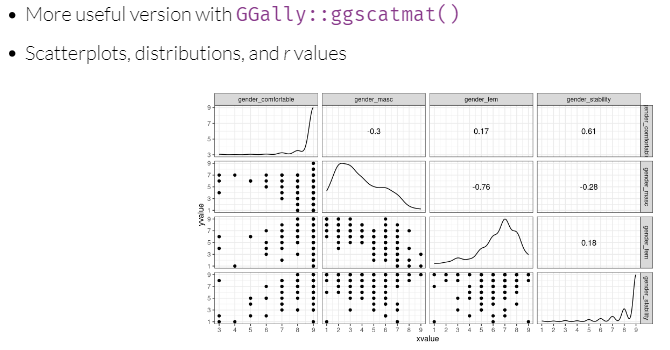
How to read a correlation matrix
The relationship between correlation and causation
- correlation does not equal causation:
- no distinction between cause and effect
- no experimental manipulation (randomisation)
- the problem of tertium quid (an unmeasured third variable that influences two other measured quantities)
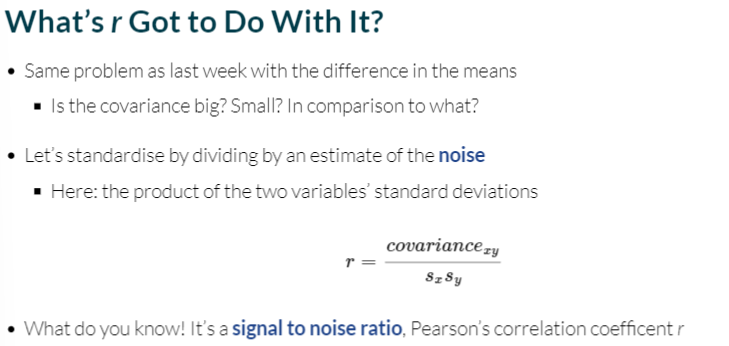
- correlation - the (standardised) degree to which two variables covary
- calculated as covariance divided by the product of the standard deviations
- quantifies both the strength (absolute value) and direction (sign) of the relationship between -1 and 1
- correlation is a technical term - do not say two things are correlated unless you report r as evidence