W2 - Contrast Sensitivity
Contrast Sensitivity Notes
Traditional vs. Alternative Approach
Traditional Approach:
Measure spatial vision using letter targets (e.g., Snellen or logMAR chart).
Assumes recognition of small objects implies recognition of larger ones.
Alternative Approach:
Measure spatial vision using sine wave gratings, where luminance varies sinusoidally to obtain the contrast sensitivity function.
The spatial frequency (size) and Michelson contrast are varied.
Contrast Sensitivity:
provides measure of the visual system’s ability to detect variations in luminance.
Utility of Contrast Sensitivity
Optometrist Perspective:
Enables evaluation of a patient's vision for:
Fine and coarse detail
High and low contrast objects
Vision Scientist Perspective:
Provides insights into:
Visual pathways and visual processing
Theories regarding spatial channels
Sine Wave Gratings
Assessment Tool:
Effective for assessing contrast sensitivity.
Optical systems yield a sine wave image from a sine wave object, though contrast and phase may be altered.
Cells in the visual cortex have receptive fields with corresponding sensitivity profiles.
According to Fourier theory, patterns can be represented as the sum of a series of sine wave patterns of specific frequencies, amplitudes, orientations and phases
Sine wave gratings are analogous to Lego blocks, allowing for diverse pattern creation.
Sine waves specified by: spatial period, spatial frequency, mean luminance, modulation amplitude, contrast, phase and orientation
Specifications of Sine Waves
Parameters:
Defined by:
Spatial period
Spatial frequency
Mean luminance
Modulation amplitude
Contrast
Phase
Orientation
Properties of Sine Wave Gratings
Spatial Period:
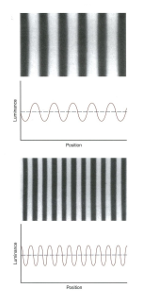
The width of one cycle (2pi or 360° per cycle).
Spatial Frequency:
Reciprocal of spatial period; number of cycles per mm (or degree).
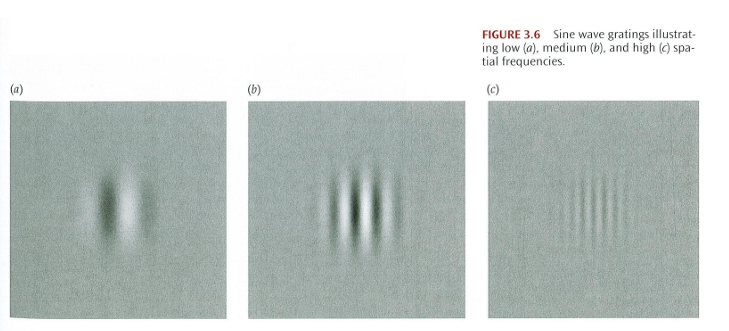
Low spatial frequency corresponds to coarse detail, high spatial frequency corresponds to fine detail.
Mean Luminance:
Average of maximum and minimum luminance of the sine wave grating: (Lmax + Lmin)/2.
Modulation Amplitude:
Difference between maximum and mean luminance (Lmax - Lmean).
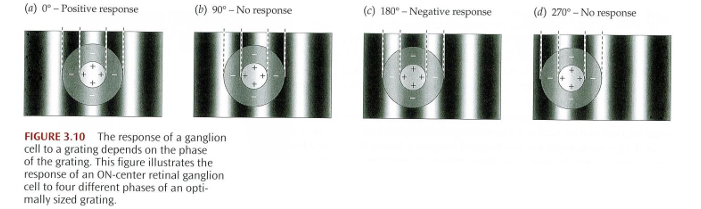
Phase:
Phase relationship describes the phase difference between component sine waves
Only important for complex patterns that have more than one sine wave component
depend on phase of grating as to whether they produce an excitatory response
orientation
angle of the gratings relative to a reference.
some cells are very directionally sensitive.
usually, sine waves gratings are vertical but can use oblique ones depending on the experiment.
Contrast Measurement for Gratings
Michelson Contrast:
Defined as: (Lmax - Lmin)/(Lmax + Lmin).
Range: 0 ≤ Michelson contrast < 1.
Zero contrast indicates a blank pattern
high contrast indicates better visibility.
Other Contrast Measurements:
Michelson contrast suitable for sine wave gratings
Weber contrast suitable for small uniform objects against large uniform backgrounds (ΔL/L)
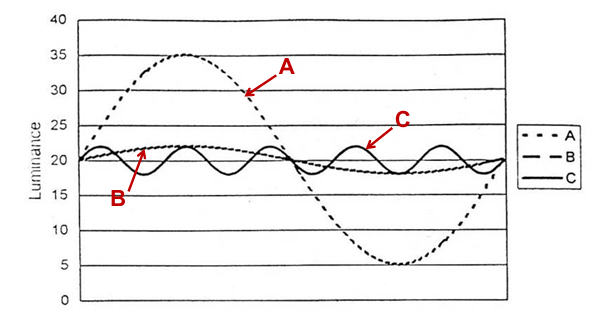
Sine wave A and B have the same spatial frequency, while C has a higher spatial frequency. B and C have the same contrast, while A has a higher contrast.
A would be wider but darker. In contrast, sine wave C would appear narrower and lighter despite having the same contrast as B.
Fourier Theory
Mathematical Process:
Analyzes how spatially repetitive stimuli can be broken down into component sine waves.
Spatial domain to Fourier domain by Fourier analysis (Fourier transform)
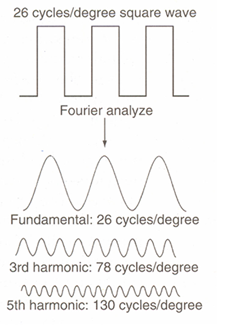
Fourier domain to spatial domain by Fourier synthesis (Inverse Fourier transform)
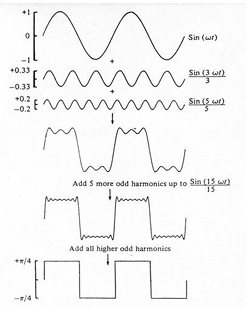
construction of a square-wave
1st harmonic has a larger amplitude than the final square wave (roughly 1/3 bigger).
Visual Processing:
High spatial frequencies (middle)
Fine detail, sharp edges, fine repetitive detail
‘Flat’, ‘line-sketch’ appearance
can see emotions / expressions
Low spatial frequencies (right)
Coarse detail, global patterns of light and dark
Fuzzy’ or ‘blurred’ appearance.
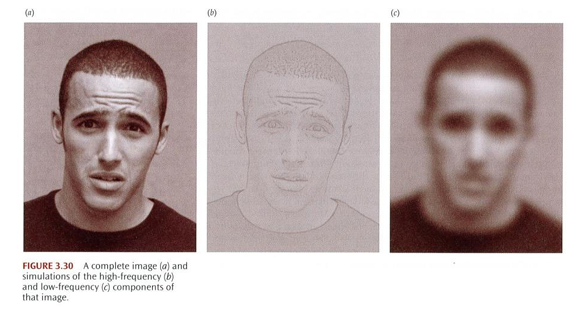
Spatial frequency domain
fine repetitive detail implies high frequencies
course repetitive detail implies low frequencies.
Advantages of sine wave gratings
optics:
applies to the optics of eye.
sine wave object yields a sine wave image
spatial frequency channels; evidence that the visual system processes information in a similar way to Fourier Analysis.
Disadvantages of sine wave gratings
Counter-intuitive - we don’t perceive the world as sine wave gratings.
line, edges and bars are more intuitive building blocks.
Contrast Sensitivity Function (CSF)
Contrast Sensitivity (CS): The reciprocal of the threshold contrast (1/threshold contrast). smallest amount of spatial contrast we need to detect a target.
CSF Measurement: Obtained by measuring contrast sensitivity for a series of sine wave gratings across a range of spatial frequencies.
Significance: Represents our window of visibility.
Adult Human CSF Characteristics: Peaks at mid-spatial frequencies and exhibits a high-frequency cut-off.
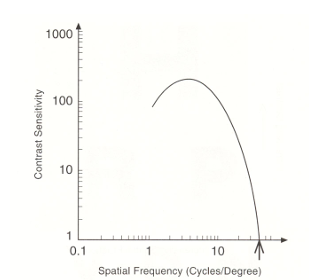
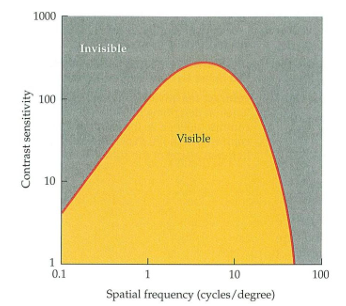
Shape of the Contrast Sensitivity Function (CSF)
Conditions: For an adult human observer, measured under foveal viewing and photopic conditions.
Peak Sensitivity:
Peak Contrast Sensitivity (CS) ranges from 125-260, corresponding to a contrast threshold of 0.4-0.8%.
Peak occurs at mid spatial frequency of approximately 4 cycles per degree (cpd).
Characteristics:
The CSF exhibits band-pass characteristics, indicating poorer CS for both low and high spatial frequencies.
A high-frequency cut-off is present, with the threshold occurring around 60 cycles per degree (cpd)
Factors Affecting Contrast Sensitivity Function (CSF)
Characteristics of the CSF is affected by factors:
Optical
Neural
Cognitive
Optical Factors
Optical Defocus:
Uncorrected (or inaccurately corrected) refractive errors: eg. hyperopia, myopia, astigmatism, presbyopia, inaccurate accommodation
Optical defocus mainly affects high spatial frequencies
Low spatial frequencies robust to defocus
Defocus has greatest effect at large pupil sizes
Different pupil sizes will also affect the level of retinal illumination
Pinholes (<0.5 mm): very large depth of focus
Ocular Aberrations
Chromatic Aberration:
longitudinal and transverse chromatic aberrations (LCA) - effects similar to defocus
Monochromatic aberrations
e.g. spherical aberration, coma
Intra-ocular scatter
cornea, crystalline lens, vitreous
reduces CS mostly at high frequency
Disability Glare
addition of glare reduces CS at all frequencies
application: driving (cataracts have issues driving at night)
Neural Factors
Foveal Cone Spacing
Inter-cone Spacing: Approximately 2 microns.
Nyquist Theory: Describes the highest resolvable spatial frequency when:
Cone A is at a peak and adjacent cones B and C are at troughs.
Distance Between Two Cones: Amounts to one cycle of grating, approximately 4 microns.
Retinal Distance: The distance from the posterior nodal plane is about 16.67 mm.
Theoretical Resolution Limit: Calculated as 72 cycles per degree (cpd), which corresponds to an acuity of 6/2.5.
in a perfect optical setting.
most people resolve 60 cycles per degree or less.
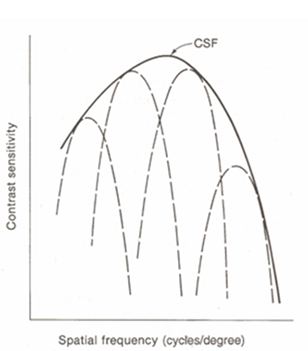
Spatial Frequency Channels.
Visual Cortex (V1): The primary visual cortex responsible for processing visual information.
Electrophysiological Data in Macaque: Studies show that cells in the visual cortex of macaques are individually tuned to narrow ranges of spatial frequencies and orientations.
Receptive Field Organization: The low-frequency roll off in visual sensitivity is partly a result of the organization of receptive fields in the V1 cells.
Maximum Excitation: Maximum excitation of cells occurs when the width of the light bar presented matches the diameter of the cell's excitatory center
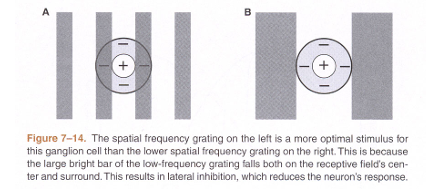
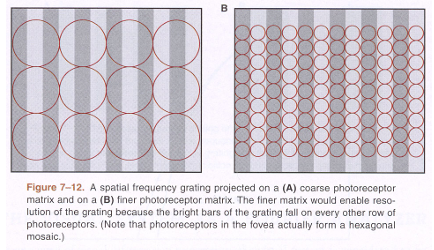
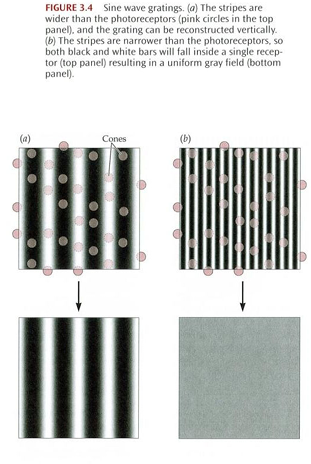
Psychophysical evidence:
spatial frequency specific adaptation
Test target: sine wave grating
Duration: 1 minute is sufficient
After adaptation sensitivity is decreased for spatial frequencies close to the adapting frequency
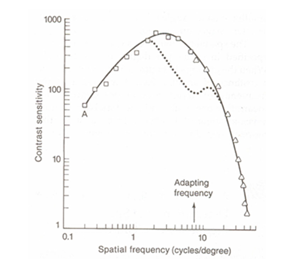
Spatial Frequency theory: the shape of the CSF is partially due to the presence of many cells with narrow spatial frequency tuning.
Cognitive Factors
psychometric method: observer’s confidence or reserve
poor observer task: criterion of: seen-not seen
good observer task: Criterion of: alternative forced choice (AFC).
Retinal Eccentricity
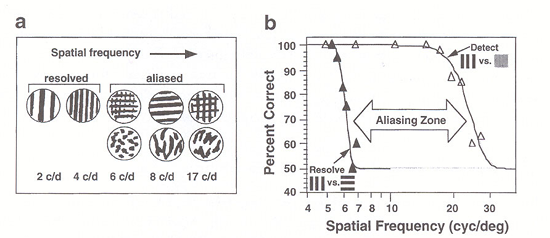
Aliasing: A phenomenon that occurs in peripheral vision due to sparse cone distribution, necessitating at least two cones per grating cycle for accurate visual representation.
Cone array in periphery is sparse and irregular, feeding an even sparser ganglion cell array
To ensure that peaks (light bars) and troughs (dark bars) in a sine wave grating are represented, must be at least two cones for each grating cycle
Cone Array in Periphery: The arrangement of cones in peripheral vision is sparse and irregular, leading to a correspondingly sparse ganglion cell array.
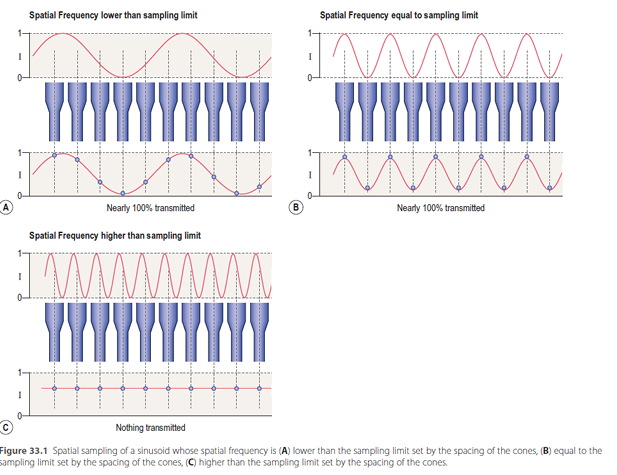
Representation Requirement: To ensure that peaks (light bars) and troughs (dark bars) in a sine wave grating are represented, there must be at least two cones for each grating cycle.
Nyquist Limit: Defined as 1/2*d, where d is the distance between cones.
Aliasing: Sine wave gratings of frequencies higher than the Nyquist limit result in sampling artifacts (aliasing). Due to aliasing, high spatial frequencies that exceed the capabilities of the retina are perceived as gratings of lower spatial frequencies.
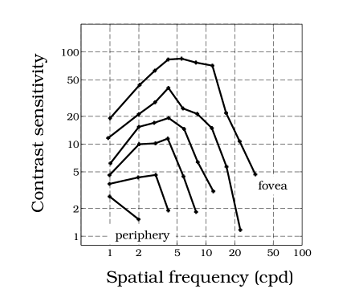
Peak of Contrast Sensitivity Function (CSF)
Movement to Lower Spatial Frequencies: The peak of the CSF shifts towards lower spatial frequencies when sensitivity decreases.
High Spatial Frequencies:
Reduced Sensitivity: Increased difficulty in detecting finer details at higher spatial frequencies.
Reduced Cut-off Frequency: The threshold for detecting high spatial frequencies becomes lower.
Robustness of Low Spatial Frequencies: Low spatial frequencies are more robust in peripheral vision, maintaining better sensitivity compared to high spatial frequencies.
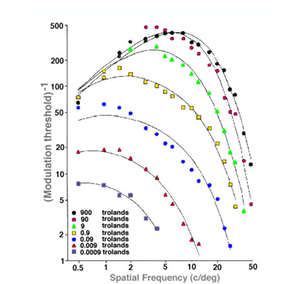
Reducing Luminance Effects on Contrast Sensitivity Function (CSF):
The peak of the CSF moves leftwards towards lower spatial frequencies.
High spatial frequencies exhibit:
Reduced sensitivity
Reduced cut-off frequency.
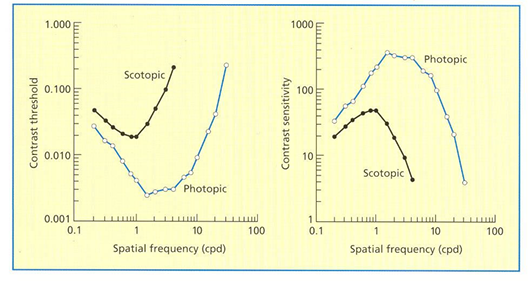
Low spatial frequencies are more robust to low luminance.
high luminance levels there is a high frequency cutoff
low luminance levels there is a low frequency cut off, so the peak of the CSF moves to the left.
going from photopic to scotopic (i.e., cone mediated to rod mediated).
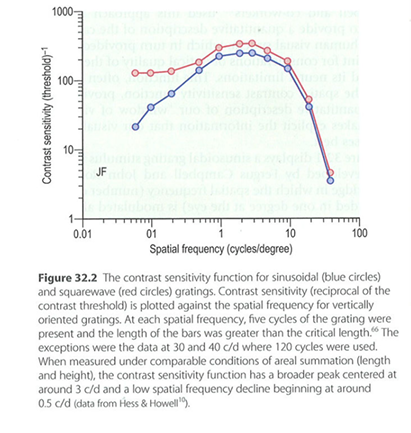
Target Form:
Low spatial frequency roll-off is less marked when CSF is measured for square wave gratings than for sine wave gratings.
higher order harmonics are of higher frequency than the fundamental, hence they don’t get such a drop off
a square wave consists of higher frequency harmonics even though they’re lower in contrast than the fundamental sine wave.
Ocular Disease:
Clinical contrast sensitivity tests generally have a poor ability to detect and diagnose ocular disease.
However, characteristic losses in contrast sensitivity function (CSF) are found in some ocular conditions.
diseases can differentially affect different spatial frequencies.
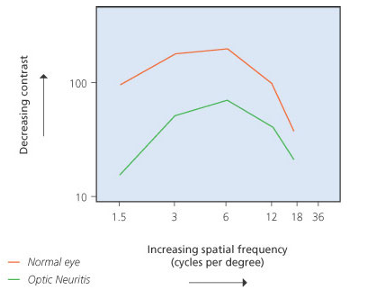
cannot diagnose a person based on contrast sensitivity function
multiple diseases have reduced contrast sensitivity.
Age and Contrast Sensitivity Function (CSF)
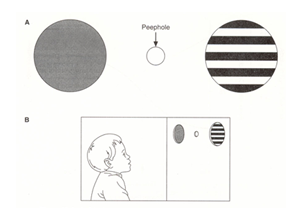
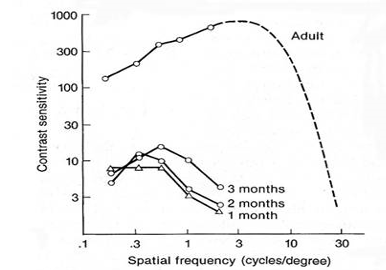
Infants:
Peak of the CSF increases and shifts to higher spatial frequencies with age.
Low spatial frequency sensitivity develops much more rapidly than higher spatial frequency sensitivity.
The form of the CSF changes from a low-pass function to a band-pass function.
Adults:
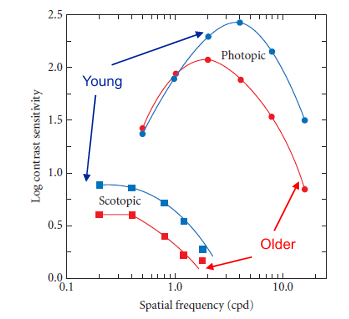
Reduction in Contrast Sensitivity:
With age, there is a spatial frequency dependent reduction in contrast sensitivity.
Greater reduction observed at mid and high spatial frequencies.
Causes:
Likely due to age-related increase in lens density, intraocular scatter, and decreased pupil size.
The neural contribution to this reduction is relatively small.
Different Conditions:
The pattern of age-related loss in contrast sensitivity is different under scotopic and mesopic conditions.
Measurement of Contrast Sensitivity
Contrast sensitivity may be measured in the laboratory using several methods.
There are various charts and instruments commercially available for use in clinical settings.
Laboratory methods:
Oscilloscope and Frequency Generator: Utilized to generate specific sine wave patterns and measure contrast sensitivity.
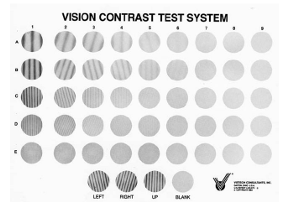
Vistech Chart:
Printed sine wave grating chart (5 SF: 1.5, 3, 6, 12, 18 cpd)
Working distance = 3 m
Decrease in contrast levels is non-uniform (~0.23 log units or 70% decrease between levels)
3AFC ‘forced choice’ method but has blank option
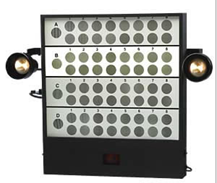
Vector Vision CSV Chart:
Similar principles to Vistech Chart but has internal illumination (4 SF: 3, 6, 12, 18 cpd) •
9 contrast levels (0.5% to 67% with 0.16 log units decrease between levels)
‘Forced choice’ - 2 rows for each SF, gratings are present in either top or bottom row
useful for contact lenses and stimulating glare.
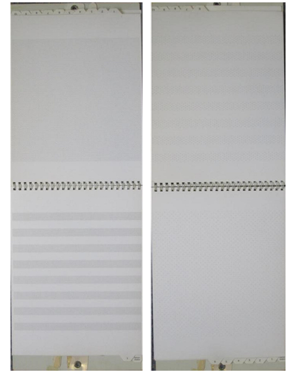
Cambridge Contrast Charts:
Square-wave grating (4 cpd)
2-AFC
Working distance = 6 m
Less commonly used than the Melbourne Edge Test or Pelli Robson test
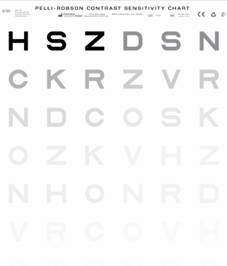
Pelli-Robson Chart
Size and Working Distance: Large letters are 5 cm high, equivalent to 1 cycle per degree (cpd) at a 1 m working distance.
Presentation of Letters: Consists of 16 groups of 3 (triplets) of letters, with letters in each triplet having the same contrast.
Contrast Variation: Contrast between successive triplets reduces by 0.15 log units, ranging from 0.00 to 2.25 log contrast sensitivity (logCS).
Scoring Method: Initially scored as the last triplet where 2 out of 3 letters are correct; however, scoring each letter correct as 0.05 log units has been shown to be more repeatable.
Applications: Commonly used in low vision research, as well as in vision and driving research.
Alternative Test: The MARS test serves as a near alternative, conducted at a 50 cm working distance.
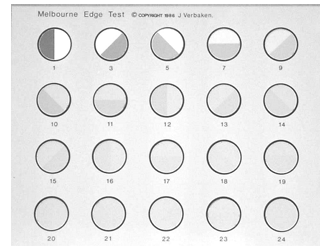
Melbourne Edge Test
Low Contrast Edges: Edges which decrease in contrast are assessed in this method.
4-AFC Method: Edges can be presented in various orientations: vertical, horizontal, up and to the right, and up and to the left.
Working Distance: Measurement is taken at a working distance of 40 cm; a working distance lens is required for presbyopes.
Applications: Commonly used in low vision research and studies related to mobility and falls.
Summary of Clinical Charts:
Pelli-Robson and Melbourne Edge tests are commonly used in functional research
CSV is used for IOL or contact lens research