Bio 201 Exam 1
What is ecology?
ecology- study of interaction between an organism and their environment
environment- interaction between an organism and other organisms of the same species (population), interaction between organisms of different species (community), and interactions between organisms and the abiotic components of their environment
Hierarchy of Complexity
atom- molecule- macromolecule- cell- tissue- organ- organ system- organism- population- community- ecosystem
cascade effect- eliminating or reducing top predators has a cascading effect down the food web
Global Climate Change
carbon, nitrogen, water, phosphorous, sulfur move in and out of biotic and abiotic environments
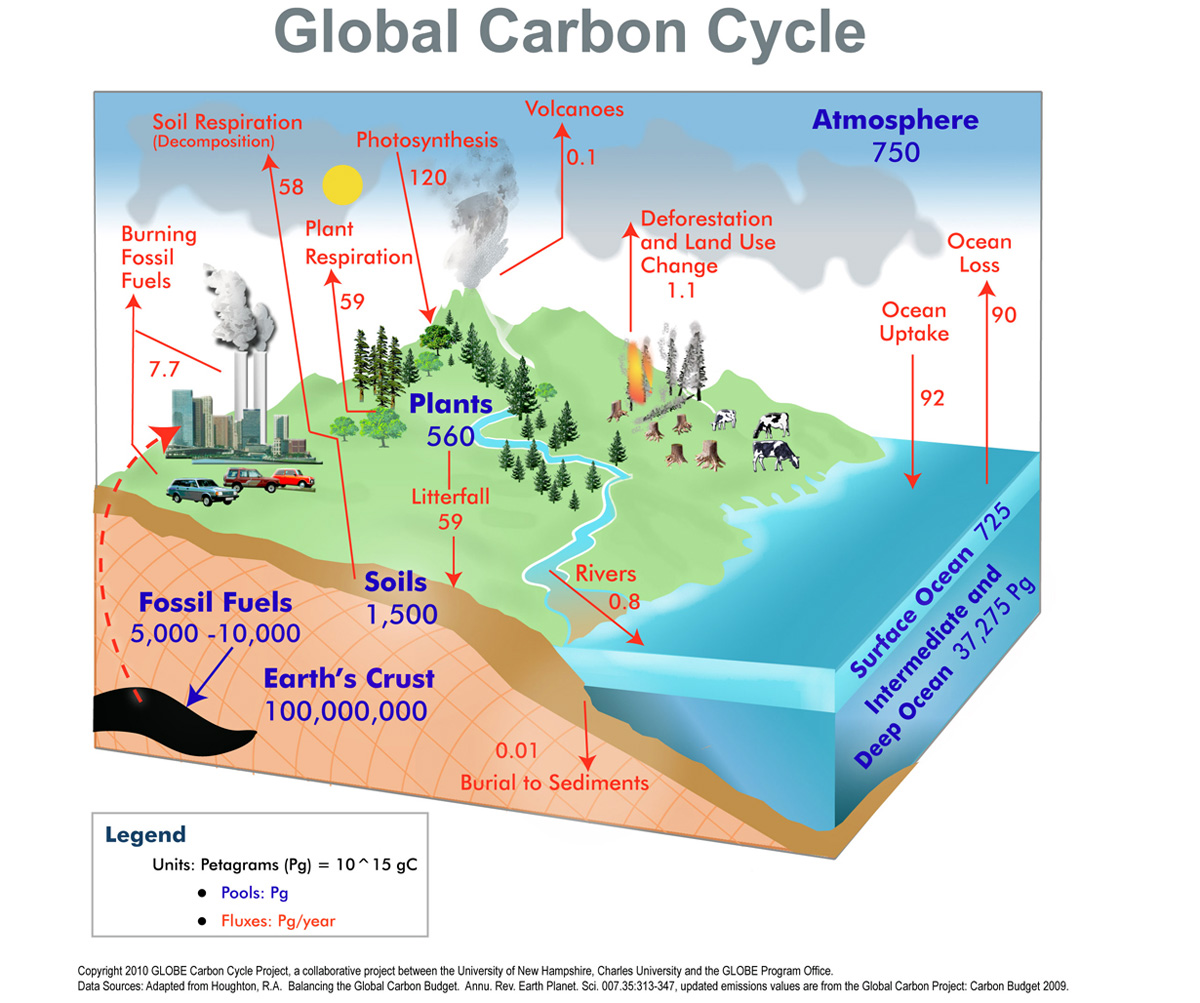
fossilized carbon that has been locked underground gets released into the atmosphere
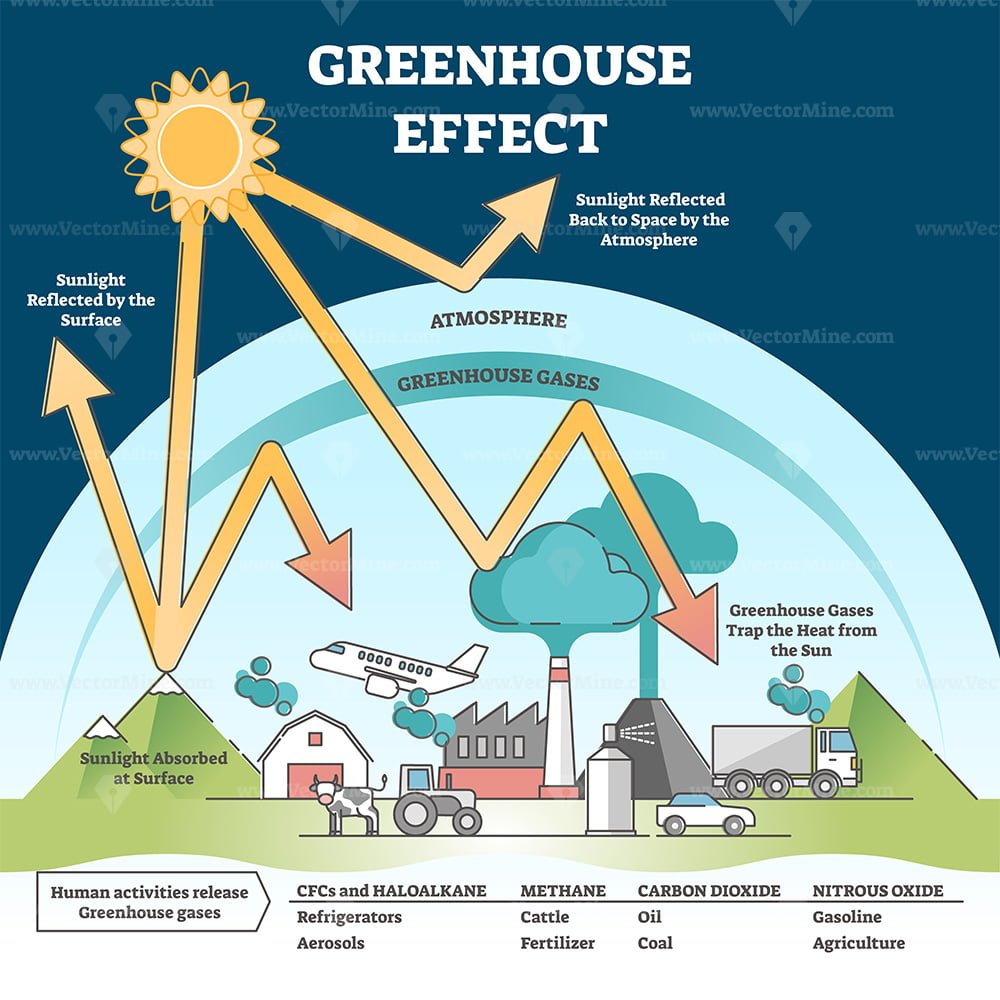
Greenhouse effect- visible light gets absorbed by the earth’s surface while some gets readmitted back into the atmosphere as infrared light. greenhouse gases absorb some infrared light and keep some of it within the earth, keeping it warm. As more gases are released into the atmosphere, more heat gets trapped.
higher greenhouse gases means more light is retained into the atmosphere
Population Growth and Stability
Population size (N)
metapopulation- group of geographically separated populations that are linked by dispersal (individuals immigrating and emigration from the populations)
population numbers determined by birth and death rates and immigration and emigration rates
uniform distribution- has equal spacing between individuals
random distribution- no pattern to spacing between individuals
clumped distribution- has distinct areas where individuals are close
main factor in distribution is availability of resources
life history trait- trait influenced by age specific survival and reproduction (evolutionary strategies to increase fitness) ex. age of maturation, number and size of eggs
Age pyramids

Population Growth Model
Basic Assumptions of all models
closed populations- no immigration or emigration
constant growth rate (birth and death rates)
no age structure- population is sexless, pathogenic that can reproduce right after birth
Geometric Model Assumptions
non-overlapping generations (adults die before maturation of young)
OR
overlapping generations and discrete reproduction
unlimited resources
discrete reproduction- adults only reproduce during specific times of the year
Per capita growth rate = N(t+1) / N(t)
finding population of the next year
N(t) = N(0)y^t
curve of graph determined by y, per capita growth rate
y- symbol for per capita growth rate “lambda”
Exponential Model Assumptions
overlapping generations
AND
continuous reproduction throughout the year
unlimited resources
r is per capita growth rate
r=lny y=e^r
N(t)= N(0)r^rt
example - N(0) = 100; y=3
r=lny=ln(3)= 1.1 individuals per year
What is the population after five years?
N(5)= (100)e^(1.1×5) = 24300 individuals
both r and y are measured by year, if by month then divide by 12
r>0 = positive growth
r=0 = stable population
r<0 = negative growth
rate of population growth- net change (added or lost) in individuals to population over a certain time period
net change = N/t
dN/dT= change in number/ change in time = per capita growth rate of increase x population size
Logistic Model
limited resources (food, space, mates)
carrying capacity- where populations level off at the max number of individuals the environment can support
k is carrying capacity
net change
dN/dt= rN (K-N/K)
Logistic model assumptions: overlapping generations and continuous reproduction, limited resources, constant carrying capacity
Population Stability and Regulation
if N>K, then the birth rate is higher than the carrying capacity
feedback loop- birth and death rate respond to increase/decrease in density relative to carrying capacity
Factors impacting population stability
per capita growth rate (r)
delayed density dependence
stability of abiotic environment
interaction with other species (predator and prey)
increase in N = decrease in stability
time lags can cause delayed density dependence which can result in population cycles
higher length in delay = higher instability
rescue effect- having other nearby patches increases the likelihood of recolonization of unoccupied patches
sources- large patches that produce excess individuals that disperse away and colonize small, unoccupied sink habitats
sink habitat- one that has repeated extinction
small populations more vulnerable to extinction by random chance that all individuals will fail to reprodice
stochastic effect- random environmental events impact small populations ex. golden toad went extinct because the puddles they breed in dried up so their eggs couldnt survive
inbreeding- individuals who breed that are closely related decrease genetic diversity, can lead to genetic drift
allee effect- lower populations size decreases fitness
c- colonization rate
e- extinction rate
e/c <1 then metapopulation will persist over time
e/c >1 then metapopulation will not persist over time