Intraspecific Competition and Logistic Growth
Intraspecific Competition and Logistic Growth
Intraspecific Competition
Competition between conspecific individuals ( individuals of the same species ).
Underlies Darwin's model of natural selection where the fittest survive to pass on genes in limited resource settings.
in a setting with limited resources, those individuals that can win out in competitive interactions are those that will pass on their genes.
Intraspecific competition (within species) and logistic population growth
Model of natural selection is the basis for logistic growth curve.
Rate of population growth reduces as numbers reach
As the rate of population growth approaches K intraspecific competition increases limiting population growth (and/or size, biomass or density of individuals (density dependent processes)
As population approaches carrying capacity ( ), growth transitions from exponential to logistic.
Initially populations may experience rapid growth, but then intraspecific competition limits growth as numbers increase.
The closer a population is to , the greater the intraspecific competition, slowing growth till it stops when the population reaches .
Density-dependent process: higher population densities increase intraspecific competition.
In cases of extremely rapid growth, populations might briefly overshoot due to lags if reproduction has been high, but subsequently decline to the carrying capacity.
Common Tern Example (Sterna hirundo)
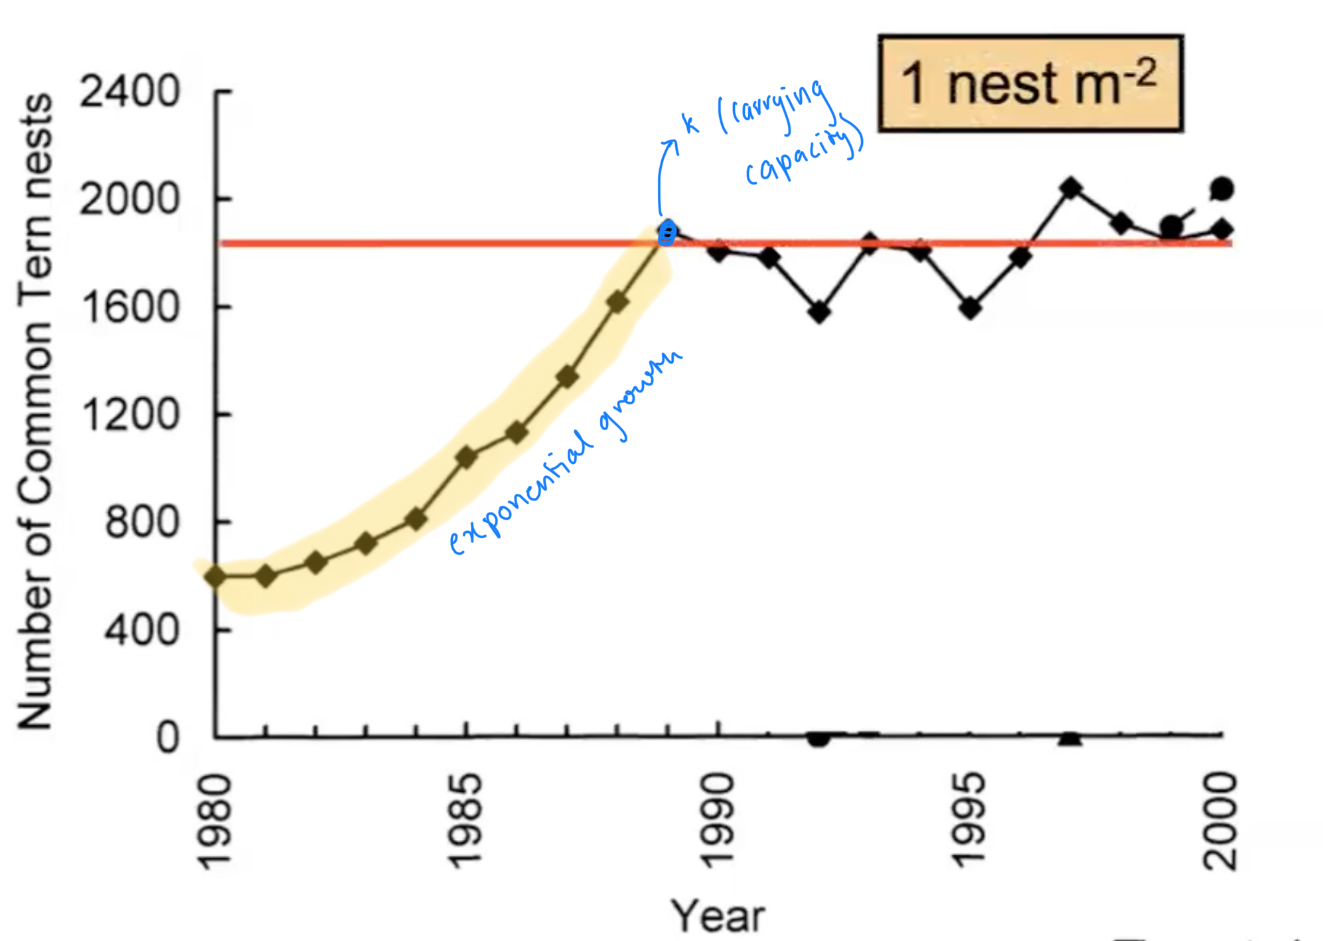
Demonstrates sigmoidal growth in nature.
Global distribution; data from the East Coast of the USA (north of New York City).
Feather use in the hat industry led to population decrease in the 1900s.
Protection legislation in the 1960s/70s led to some population recovery.
Globally, populations are still on a negative trend.
X-axis: year
Y-axis: Number of Tern Nests (proxy for number of birds, where 1 nest = 2 birds)
Post-legislation, exponential growth occurred, leveling out around the 1990s.
Fluctuations occur due to seasonality and annual changes in environment; population flattens at ≈ 2,000 birds (approximately one nest per meter squared).
Each pair of nesting terns requires approximately one nest per meter squared to breed successfully.
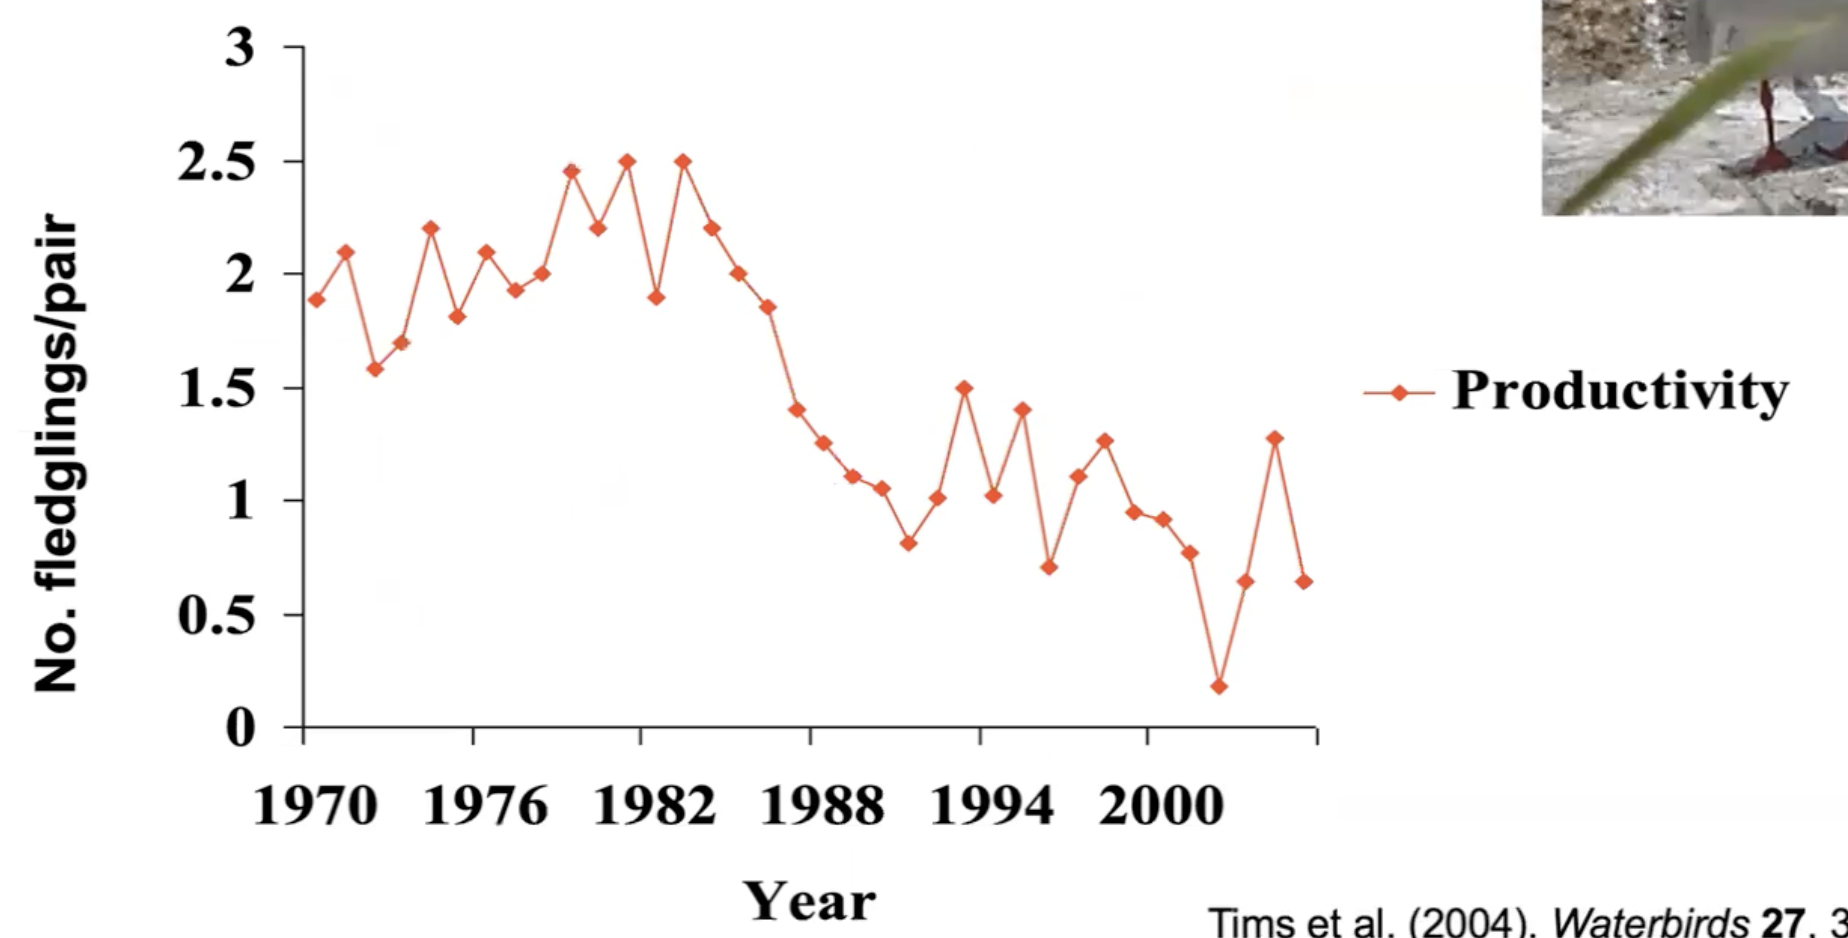
Fecundity was initially high (≈ 2 chicks per pair).
Decreased over time, leveling off at ≈ 1 chick per year.
Initially, there was less intraspecific competition, allowing more time for reproduction and chick rearing.
Increased population size leads to increased intraspecific competition for nest space and food.
Fewer fledglings per pair result.
Combining the graphs
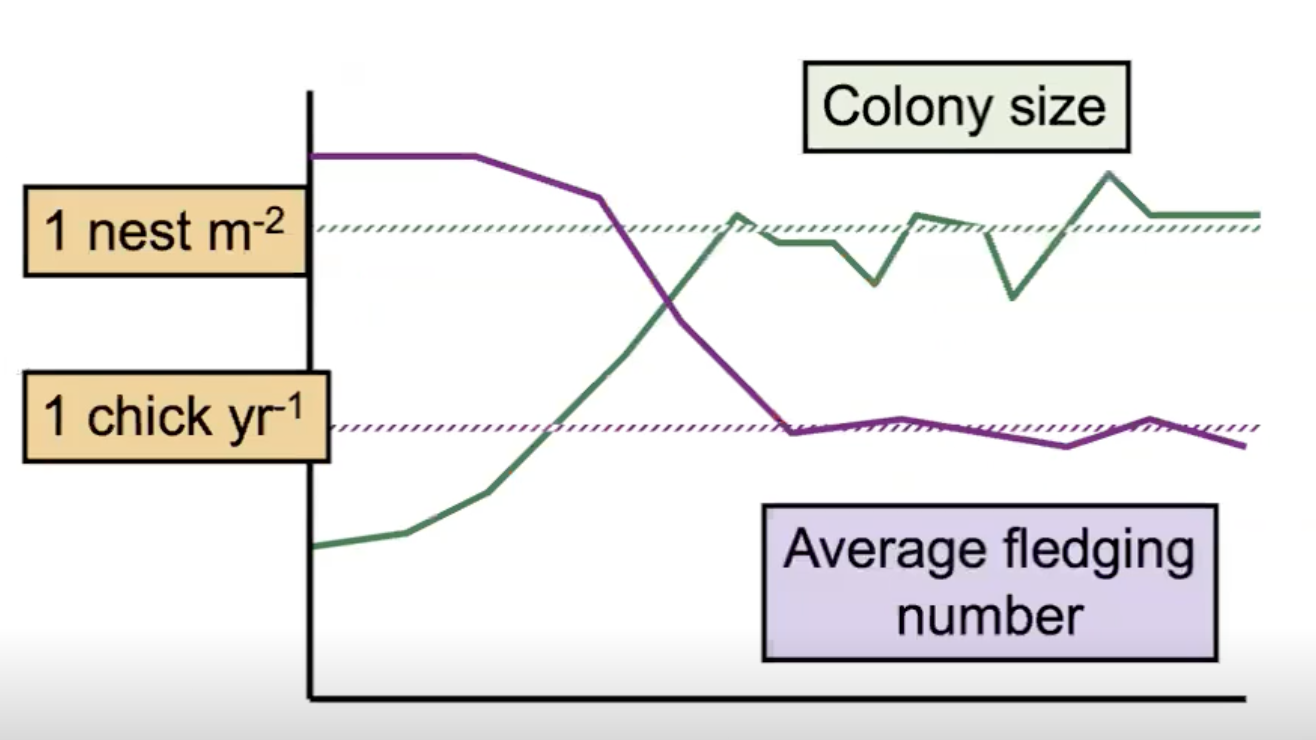
The rise in colony size, the drop in fecundity, and the leveling off, occur around the same time.
Indicates that changes are related to one another, and occur as a result of increasing intraspecific competition as population density increases.
Intraspecific Competition in Plants
Plants compete for soil and space in the ground AKA self-thinning.
Involves a trade-off between density and size of individuals.
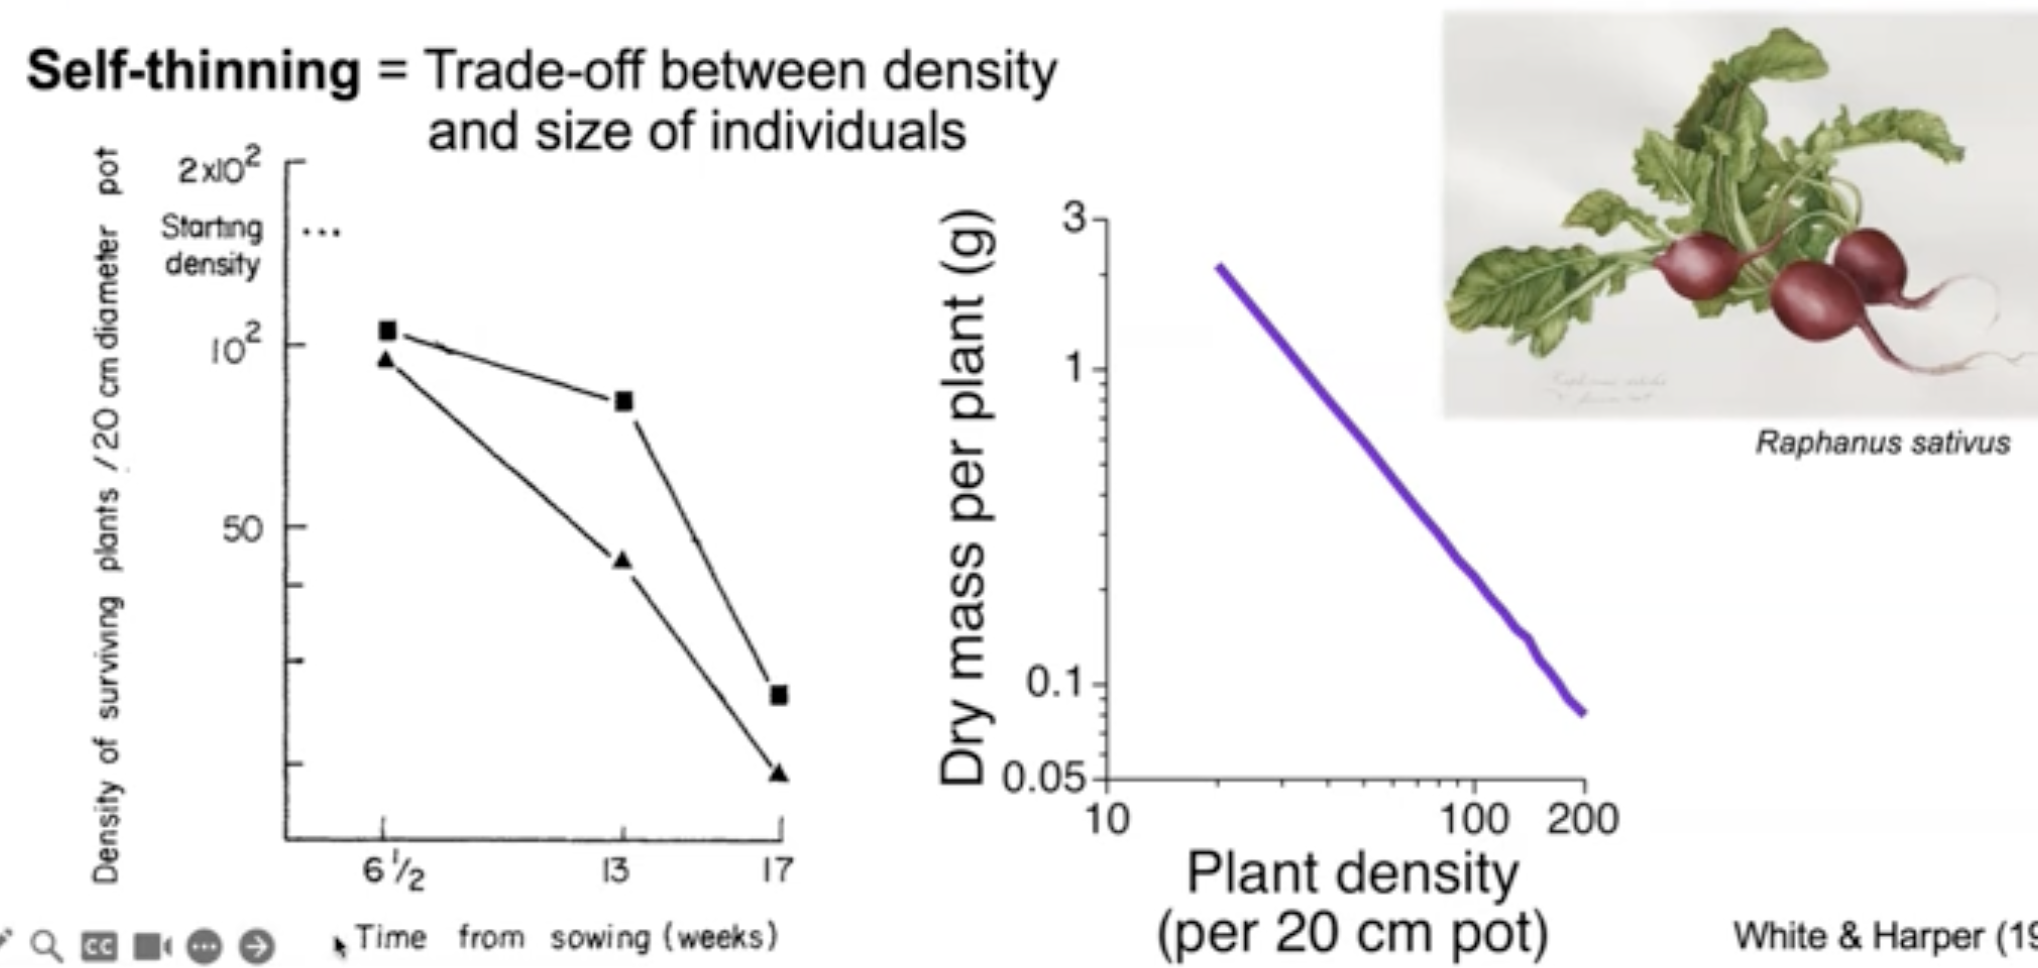
At the start, density is high, but declines as seedlings compete for resources.
X-axis is the Time of Sowing.
Y-Axis is the Density of Surviving Plants.
Initially density is really high, but over time, as the seedlings get bigger, density will increase, and the seedlings start competing for resources such as light and nutrients, and so density will decrease.
Plant size decreases as density increases.
High density results in smaller plants.
As plants grow and competition increases, self-thinning occurs —> weaker individuals die.
Subsequently, density decreases while remaining individuals grow larger and stronger.
The slope of the relationship between plant size and density is often ~, found in many plant species with some exceptions to this rule
Exception to the Negative Three Over Two Rule: Brown Trout
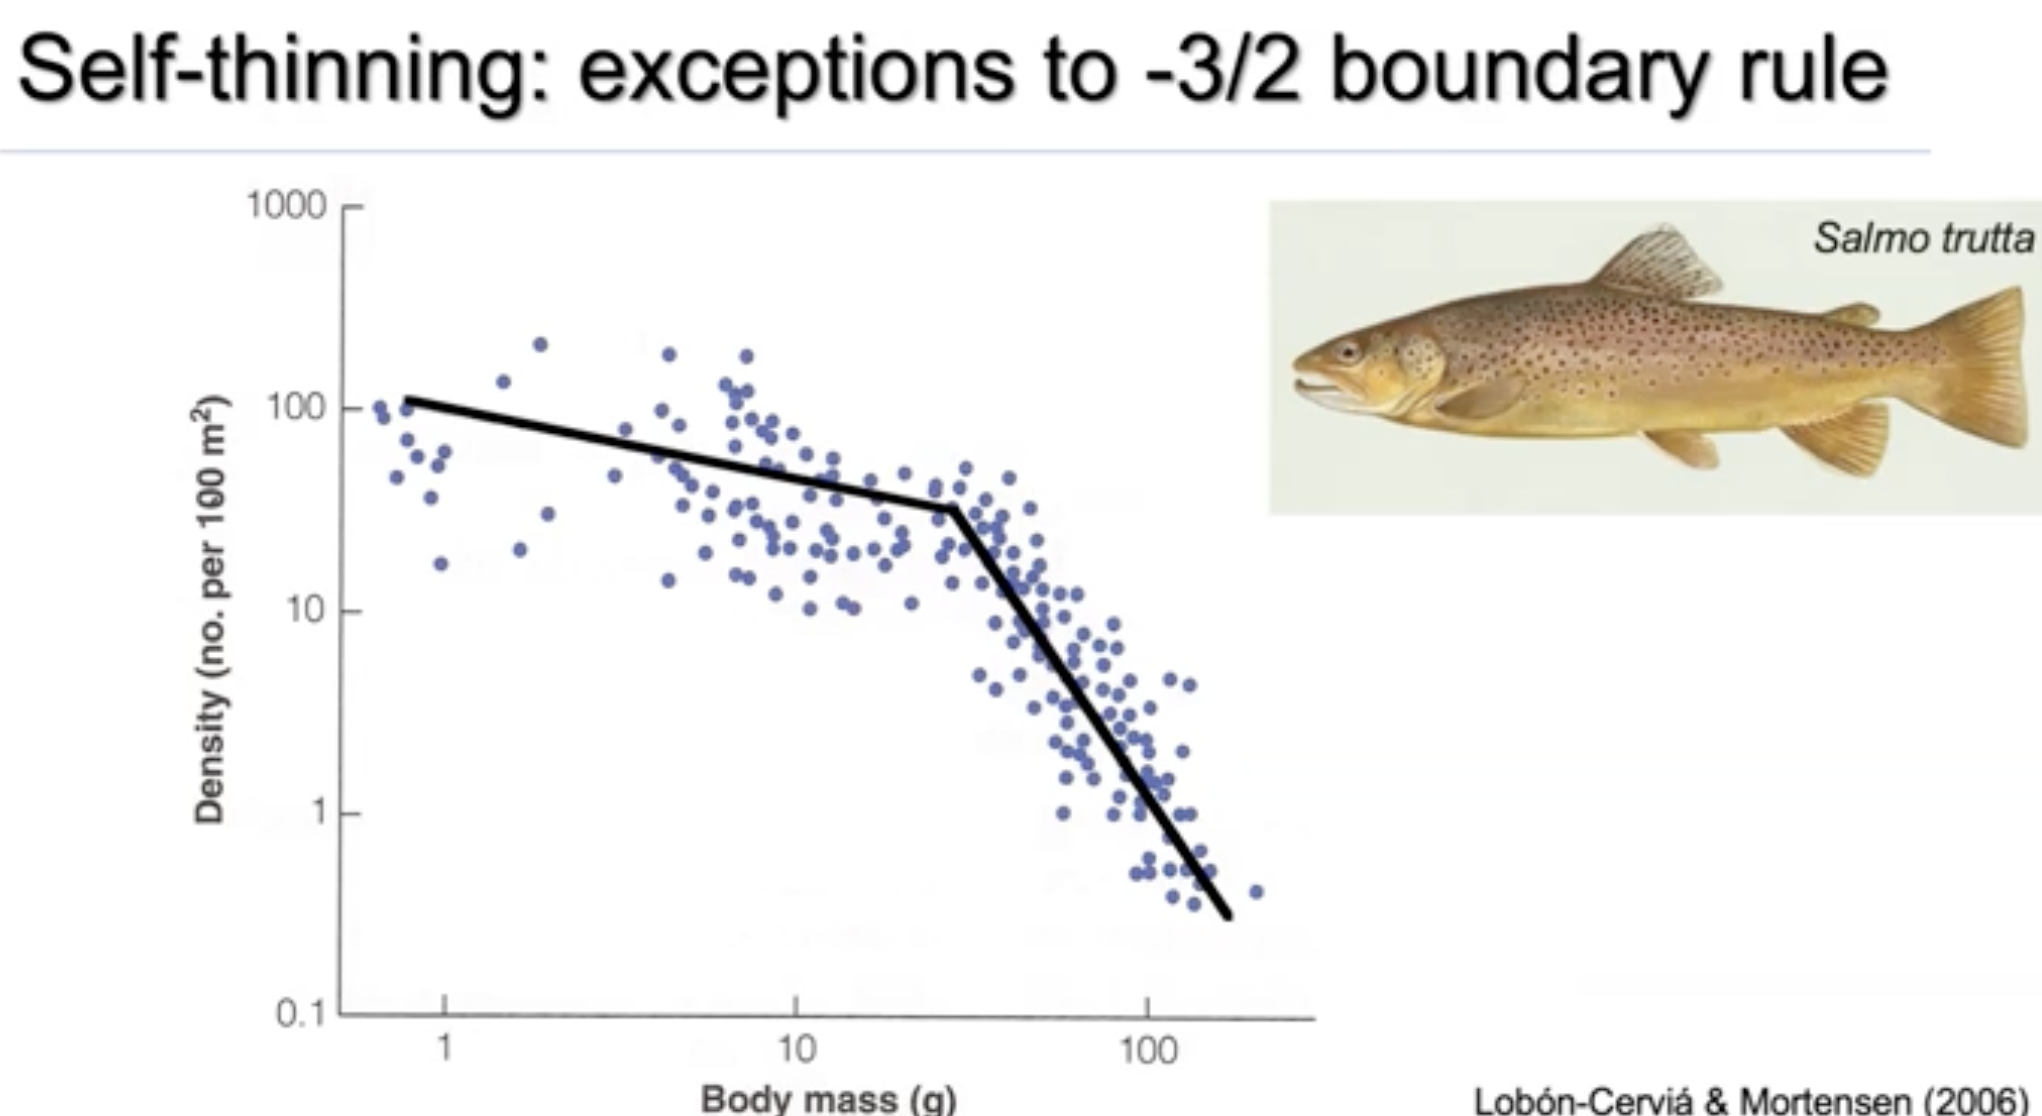
Initially, the relationship between body mass and density follows the slope when the trout are smaller/younger.
As they grow bigger, the relationship is stronger.
A greater drop-off in size with density occurs over time.
This may be due to habitat change between juvenile and adult stages.
Juveniles may move from rivers where they were born into larger water bodies (lakes/oceans).
Limiting factors for adults might differ from those of juveniles.
Causes a higher decrease in mass with increasing density.