FW 453: Density-dependent population change, 2/18
FW 453: Density-dependent population change, 2/18
Overview
negative density dependence
positive density dependence
simultaneous negative and positive density dependence
simultaneous density independent and dependent factors
Negative Density Dependence
summary: vital rates (and the associated observed pop growth rate) decrease as the pop size increases
regulates pop size by decreasing growth rate at high density and increasing at low density
Case Study: Mechanism of Density Dependence in Black-throated Blue Warbler
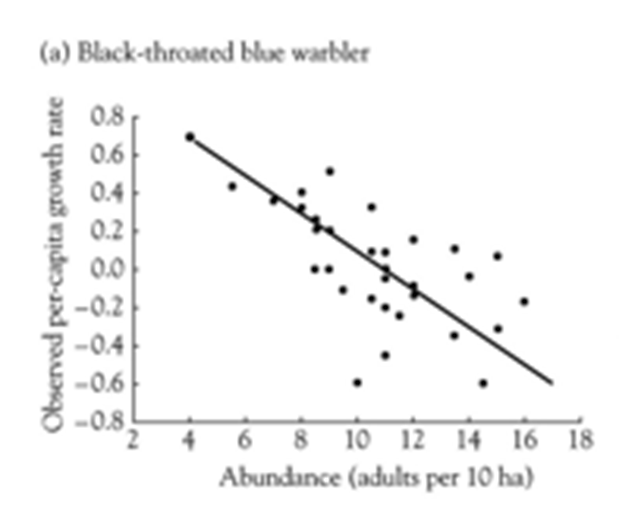
as neighbords increase:
more time spent on territory defense and mate guarding
less time spent foraging
lower rate of nestling provisioning
fewer nestlings fledged
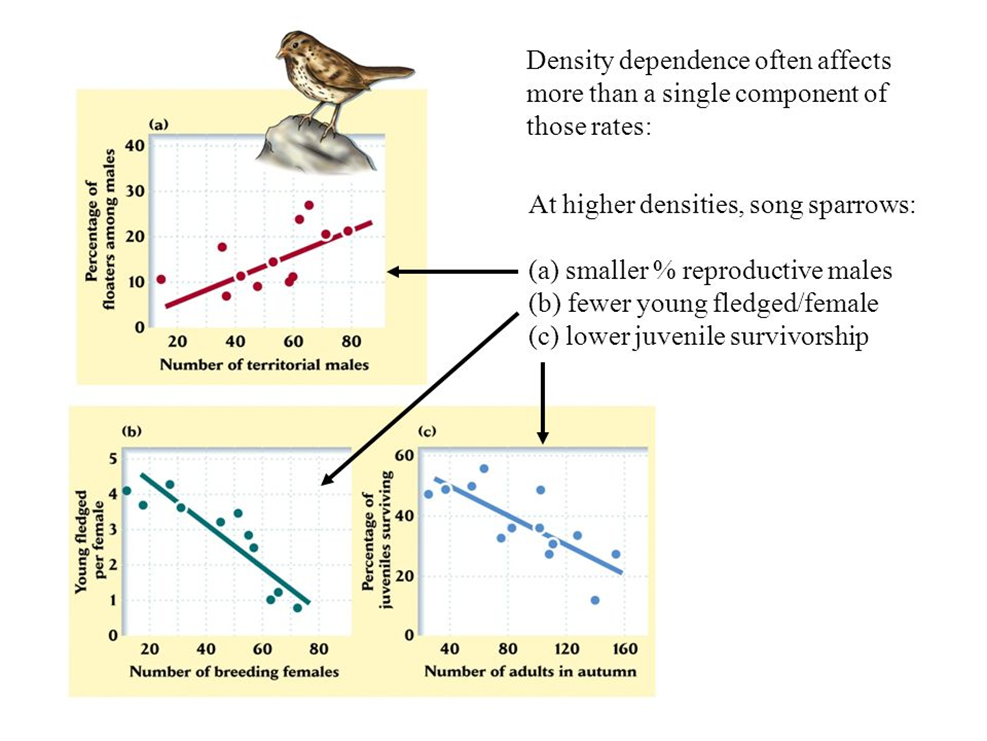
Negative Density Dependence—may affect fitness components (individual vital rates)
can affect more than a single component
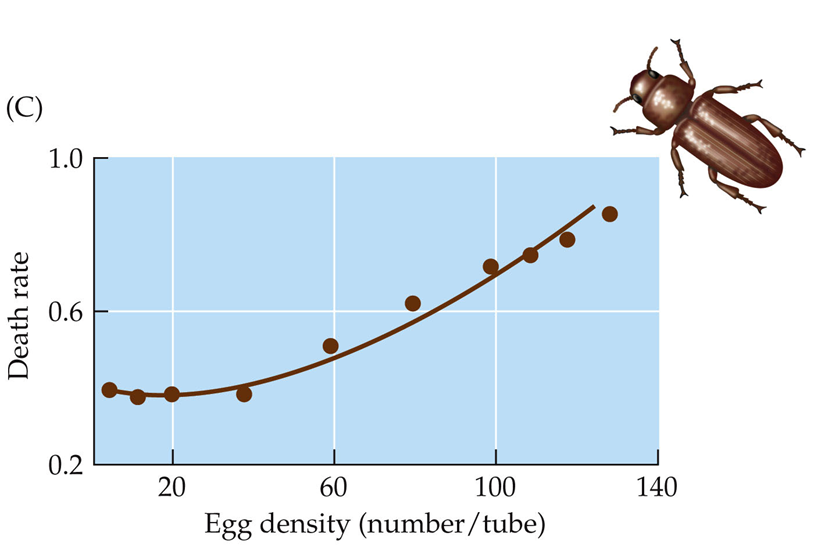
flour beetle egg morality increased as the density of eggs increased
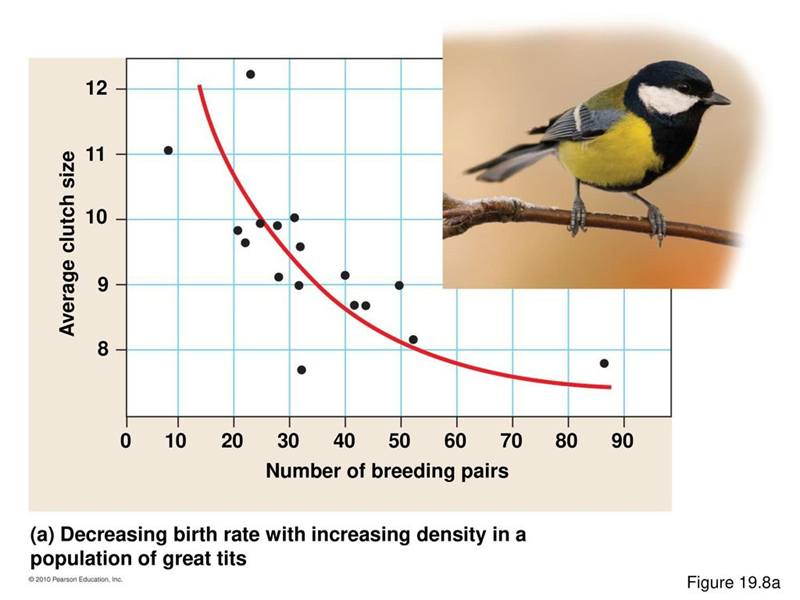
clutch size decreased as the density of breeding pairs increased
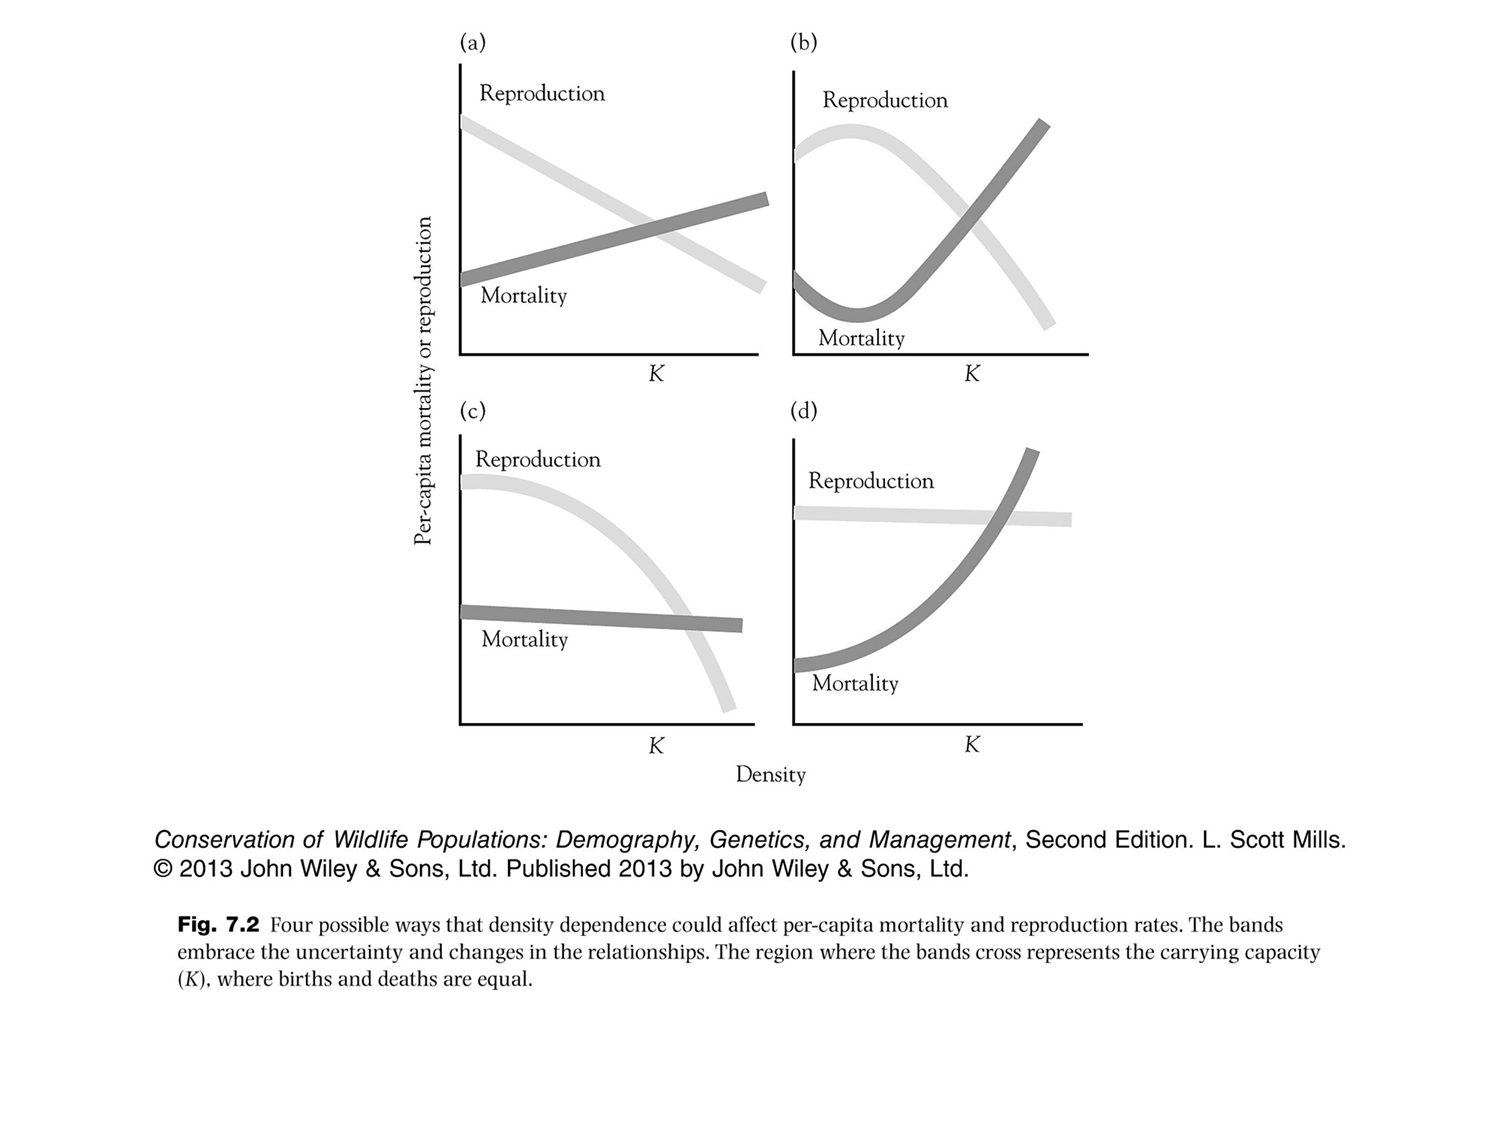
Drawn as bands because there is uncertainty and is a zone not a specific number, carrying capacity is a range.
Infinite number of ways in which density dependence could change vital rates and therefore per capita growth rate
Negative density dependence
Knowledge of the mechanism of density dependence may yield more management options
Possible causes of negative density dependence
intraspecific competition—interference/contest
scramble
disease
predation
resource availability
Population Growth
Geometric growth (discrete time)
𝑁_(𝑡+1)=𝑁_𝑡 𝜆
over one time step
𝜆=𝑁_(𝑡+1)/𝑁_𝑡
If pop grows at rate lambda for T time steps
𝑁_𝑇=𝑁_0 𝜆^𝑇
𝜆=√(𝑇&𝑁_𝑇/𝑁_0 )
Exponential growth (continuous time)
𝑑𝑁∕〖𝑑𝑡=𝑟𝑁〗
𝑟=ln𝜆 or 𝜆=𝑒^𝑟
If population grows at r for T time steps
𝑁_𝑇=𝑁_0 𝑒^𝑟𝑇
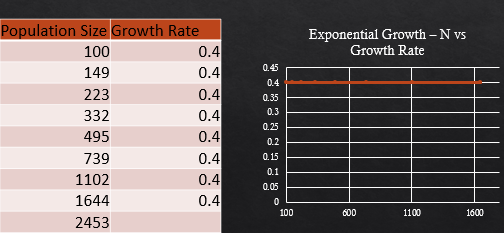
Common theme
growth rate does NOT change at different abundances
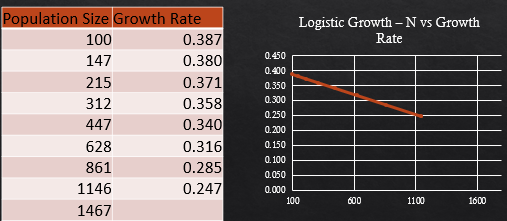
New paradigm
growth rate DOES change at different abundances
The Logistic Growth Model
simplest way to model density dependence just adds the simplest penalty imaginable to exponential “r”.
dN / dt = rN
𝑑𝑁∕〖𝑑𝑡=𝑟_0 𝑁(1−𝑁/𝐾)〗
Eq 7.3
Contribution to population per capita growth rate is penalized linearly; being clobbered by density same when few individuals as when a lot; penalty is the same
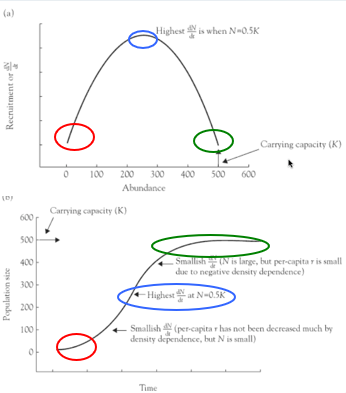
Mechanics of growth curve; sigmoidal, go through different time stages…smallish growth, highest in middle, then smallest again…maximum recruitment at K/2
Negative Density Dependence
“Regulates” population numbers within some equilibrium size range (carrying capacity) by:
decreasing population growth rate at high density and
increasing population growth when density is low
Limiting factors that determine actual equilibrium population size range
density-dependent
density-independent factors
have large effects on pop size
do not regulate population size
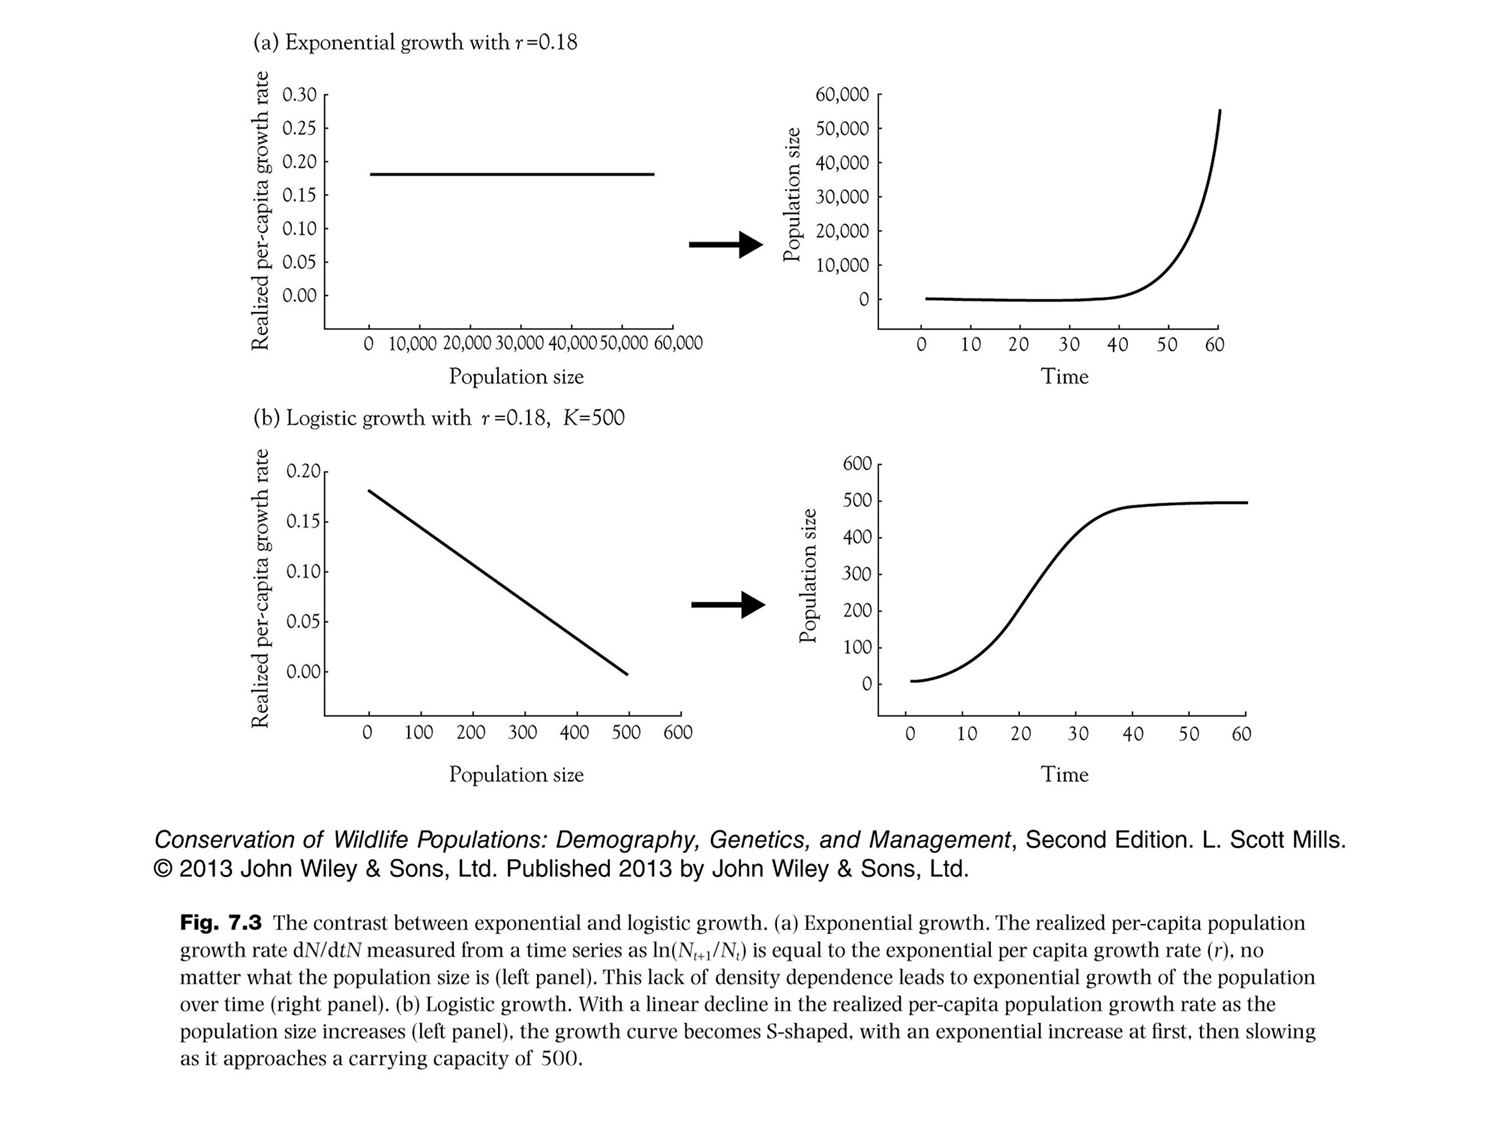
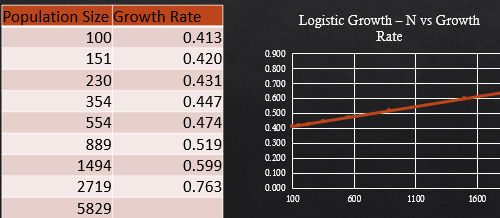
r vs r_0
r is instrinsic rate of growth in exponential/geometric growth
in logistic growth equation, we talk about r_0
the exponential growth rate at very low densities
similar to r_max, the theoretical maximum growth rate of a population
the realized per-capita growth rate is defined in Eq. 7.3
dN/dt = r_0N(1-(N/K))
the logistic growth model shows the linear decline in realized per-capita growth rate as N increases
logistic growth uses r_0 to show how the realized per-capita growth is affected by increasing or decreasing N
So populations stabilize at K…
but no always
lab exercise, where you use:
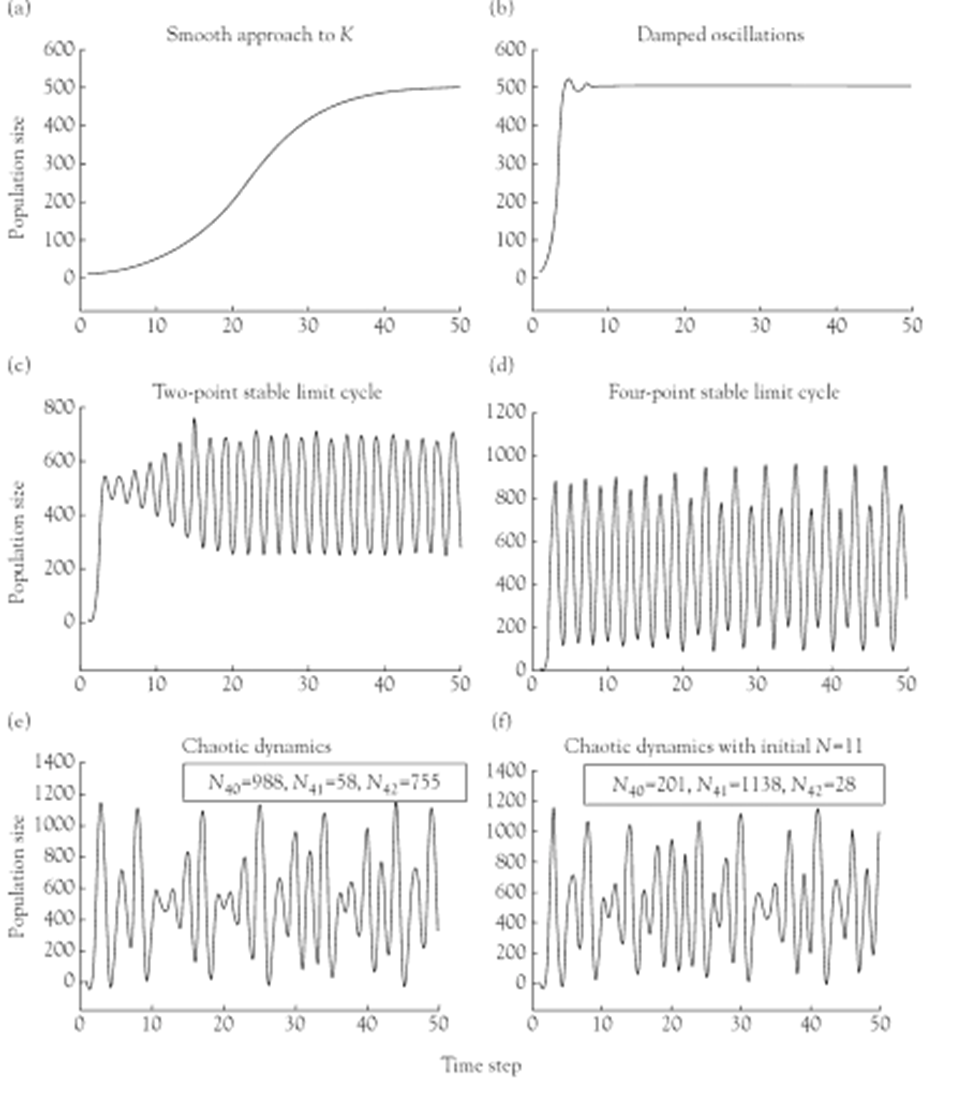
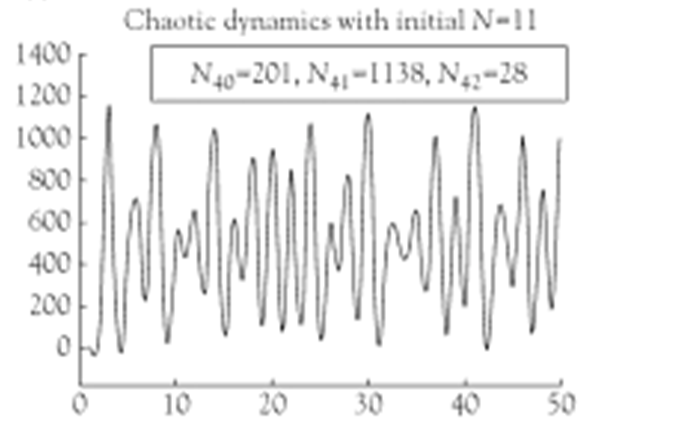
“discrete time” version of logistic, known as the ‘Ricker’ equation
𝑁_(𝑡+1)=𝑁_𝑡 𝑒^((𝑟_0 [1−(𝑁_𝑡/𝐾)]) )
Note that this is exponential growth with a penalty…step through the penalty
IS IT DEMOGRAPHIC STOCHASTICITY? IS IT ENVIRONMENTAL STOCHASTICITY? IS IT AGE STRUCTURE?
No, no, and no
Lambda = 14.xx. Nonlinear equation with time lag….two important pieces
Deterministic chaos
Pop dynamics can appear chaotic when growth is very rapid
But the problem is in nature will not be able to determine “starting” conditions with perfect accuracy! So things will look unpredictable.
Logistic pop growth: cycles and chaos
Discrete logistic pop growth with high r can lead to: erratic fluctuations even in a constant environment
Counterintuitive finding: increasing pop growth might (temporarily) decrease pop size and increase extinction probability
Chaotic dynamics have been found in a few wild populations
but stochasticity will be more common in most wild pops
so know chaos exists but dont expect it to be common
Not often that little r is greater than 2.69…intrinsic growth rate…voles have exhibited chaos…most of the time not the case…usually environmental, demographic, or age structure variability
Logisitc pop growth—complexities
Delayed density dependence (time lags)
following introduction to a new range, herbivores may “irrupt” or increase to peak abundance and then crash to a carrying capacity lower than the initial peak
𝑁_(𝑡+1)= 𝑁_𝑡 𝑒^(𝑟_0 [1−(𝑁_(𝑡−𝜏)/𝐾)])
Mechanisms:
effects of density on female body condition affect future reproduction
density affects survival cumulatively rather than in just one year
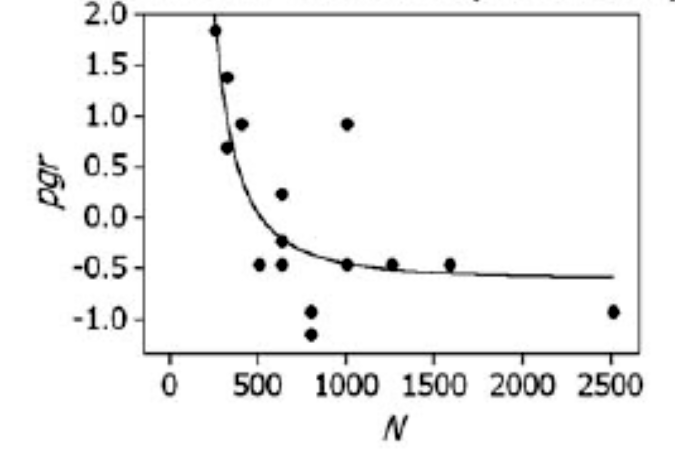
Nonlinear density dependence
(nearly) linear decline in per capita population growth (pgr) with density – as assumed by the logistic model
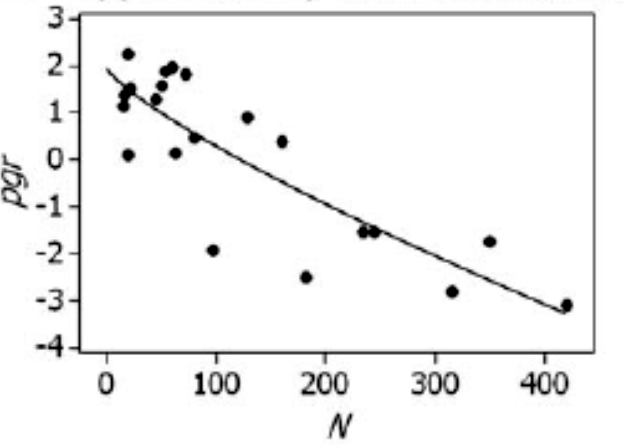
convex relationship: per capita pop. growth (pgr) varies little until near K, then drops rapidly
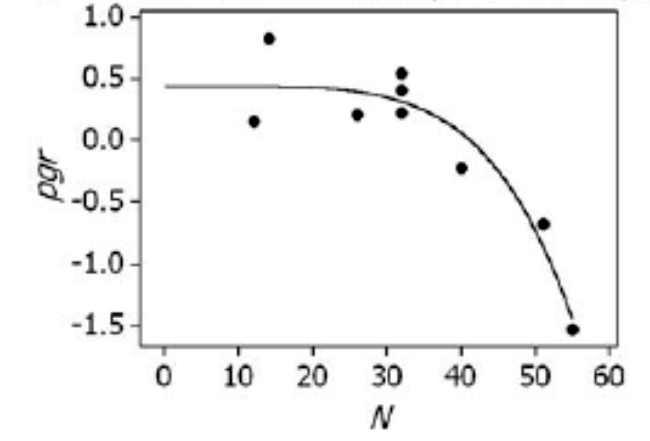
concave curve: small populations grow quickly, but pgr then declines rapidly, later flattens out – the approach to K is slow
Theta logistic pop growth model
Basic discrete logistic growth model
𝑁_(𝑡+1)=𝑁_𝑡 𝑒^((𝑟_0 [1−(𝑁_𝑡/𝐾)]) )
Theta logistic model: the parameter theta controls the shape of the density dependence
𝑁_(𝑡+1)=𝑁_𝑡 𝑒^(𝑟_0 [1−(𝑁_𝑡/𝐾)^𝜃])
θ ≈ 1 → Linear effects of density on population growth rate (logistic growth)
θ > 1 → Convex relationship (density dependence stronger at high density)
θ < 1 → Concave relationship (density dependence stronger at low density)
But is all density dependence negative? No!
Positive Density Dependence
pop growth rates increase as density increases OR
pop growth rates decrease as density decreases
Allee effect
Positive density dependence at low pop sizes: vital rates and/or pop growth rate increases as density increases
In other words…
At really low densities, pop growth can be hindered by various factors
Mechanisms?
minimize predation
detection and defense
predator confusion
predator swamping
foraging advantage
access to food
cooperative resource defense
reproductive success
finding mates
conditioning of environment
Passenger pigeon story
in the pigeon and dove family, but more closely related to tropical fruit pigeons than to other NA columbids
low reproductive rates, long-lived
3-5 billion passenger pigeons when Europeans arrived
current pop of all birds in US is about 6 billion
Allee effect = human overexploitation and habitat destruction
chestnut blight eliminated chestnut trees and reduced food sources
fragmented hardwood forest habitat
passenger pigeons needed large flocks for courtship ritual, synchronization of mating condition
were never successfully captive bred
last one died in 1914 at age 29
Adding an Allee effect to our pop model; both negaitve and positive density dependence
basic logistic growth model
𝑑𝑁/𝑑𝑡=𝑟_0 𝑁(1−𝑁/𝐾)
adding a threshold, A, below which per-capita growth rate becoems negative
𝑑𝑁/𝑑𝑡=𝑟_0 𝑁(1−𝑁/𝐾)(1 − (𝐴+𝐶)/(𝑁+𝐶))
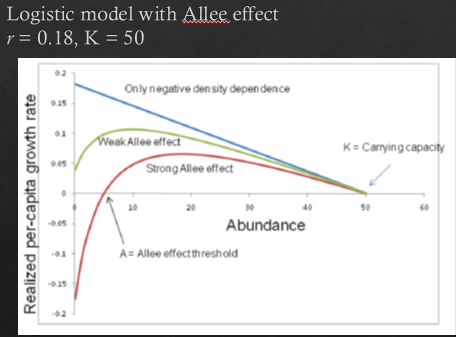
Logistic – as density goes up pgr goes down linearly;
Allee effect – as density increases at low densities, pgr goes up (positive dd), then becomes negative once a larger density is reached (negative dd)
Population decline to extinction when below A
Multiple Allee Effects
positive- and negative-density dependence acting on a pop
ex: african wild dogs
positive
increased pack size = increased likelihood of successful kill
increased pack size = increased prey size = more food, potentially shorter chases, and more food per individual
increased pack size = more eyes for protection of young, defense of food
increased food and defense = positive relationship between pack size and recruitment
Negative
benefit of pack size diminished at larger numbers as negative density dependence kicked in
too many moths to feed, etc
Including other factors
how does habitat quality affect carrying capacity?
constant over time?
basic idea:
management of habitat translates into improved conditions of some species
improved conditions = higher likelihood of pop persistence
habitat improvements can reverberate into 2 components of logisitc model
growth rate
carrying capacity (habitat carrying capacity)
We can incorporate habitat quality into our Ricker equation (for others)
must relate carrying capacity to habitat quality
how?
make CC a function of habitat quality!
K(X) = b_0 + b_1 * X
where X = a habitat covariate (e.g. rainfall, predation risk, etc)
can extend to many habitat factors
K(X_0) = b_0 + b_1 X_1 + b_2 X_2
Simple pop growth models—summary
Exponential: not stable
continuous logistic: very stable, strong tendency to go to K
discrete logistic: less stable, cycles, and chaos possible
Allee effects: very unstable. below lower equilibrium, pop can head towards extinction
Logistic pop growth model
Simple model whereas real pops are complex
interactions of density-dependent and density-independent factors
stochastic r, fluctuating K
nonlinear density dependence
delayed density dependence (ibex)
Is the model useful? It dependens…
simple models help us understand the general idea of density dependence
recruitment may be maximized at K/2
harvest/culling may not reduce pop size
fluctuations in a constant environment
General modeling philosophy
simple models are useful for describing the basics of an ecological process
complexity can then be added to the model, piece by piece, to represent the complexity in the real world
And of course, density can be applied to STAGES! ‘comonents’ vs ‘demographic DD’)
does the dd affect a vital rate, does that change in vital rate affect lambda, are there correlations that would cancel out the yr affect on lambda?
A common demographic pattern among long-lived vertebrates under negative density dependence
as abundance increases
first—juvenile survival declines (and sometimes drastically)
next—age of first reproduction increases
next—fecundity (pregnancy and fetal rate)
finally(and often not at all)—adult survival declines
changes in adult survival typically has the greatest effects on lambda
changes in juvenile survival usually has lesser effects on lambda
changes in fitness components due to negative density dependence may not always translate into effects on lambda