Biomechanics III: Velocity-Based Training and Force-Velocity Profiling
Foundational Principles and Goals of Resistance Training
Uses of Strength + Power Assessments
Acute Performance Monitoring: Tracking fatigue and immediate responses within a training session.
Chronic Response Tracking: Identifying long-term adaptations, progression, and appropriate overload to mitigate injury risk.
Strength + Weakness Identification: Pinpointing specific physical deficits in an athlete's profile.
Individualization: Engineering programs specifically based on the unique demands of a sport.
Benchmarking: Comparing an individual athlete to normative, population-specific data sets.
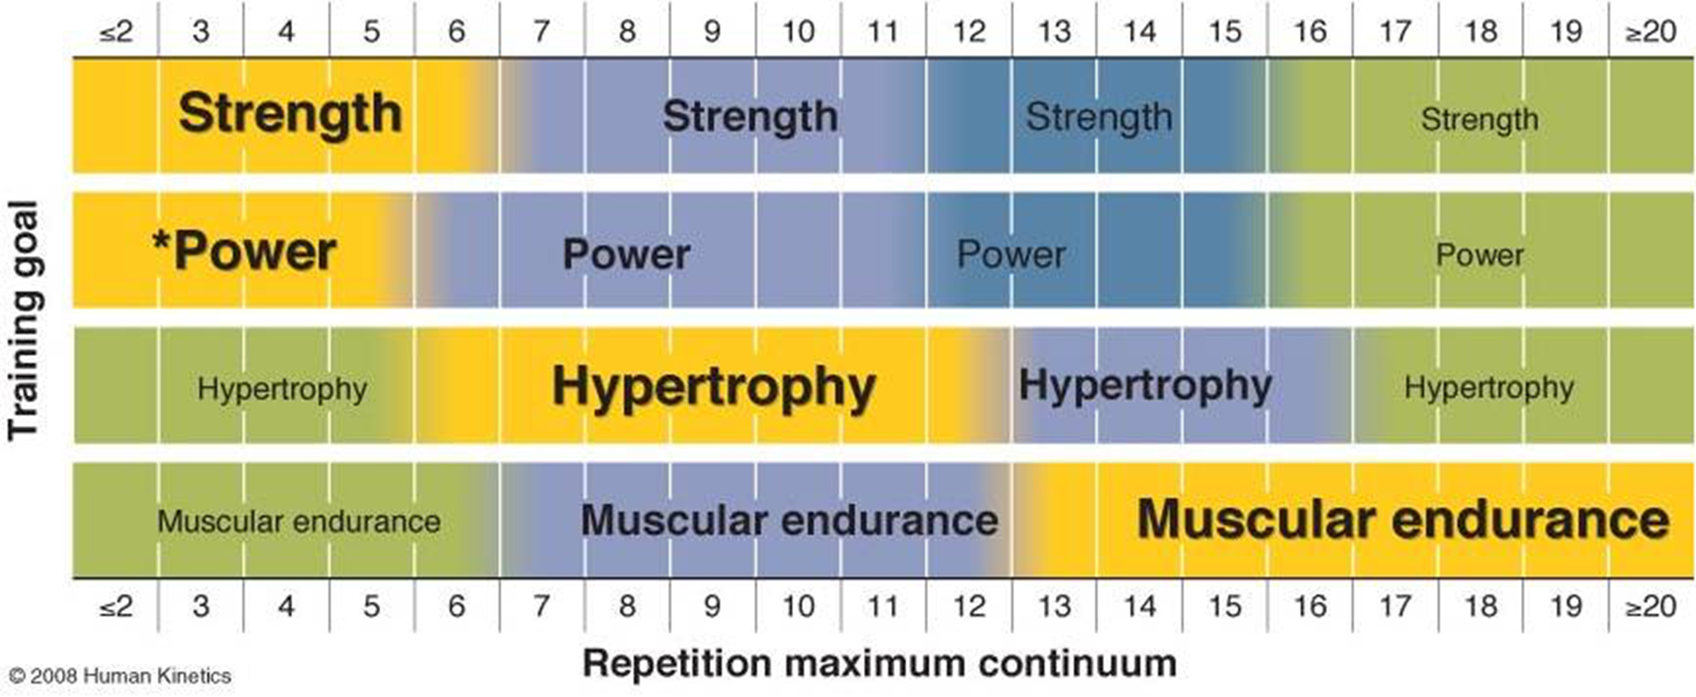
Classification of Strength and Power Tests
Maximal Strength: Maximal force exertion - > 90\% \text{ of } 1RM. (e.g Back Squat, Deadlift, Bench Press, Leg Press.)
Strength-Speed / Strength-Power: The ‘middle ground’ between force production and velocity - or . (e.g Olympic lifts, Deadlifts, Squat Jumps, CMJ).
Peak Power: The product of Strength Speed - or . (e.g SJ, CMJ, Bench Press Throws, Single-Leg SJ, Single-Leg CMJ.)
Speed-Strength / Power-Strength: ‘Middle ground’ favoring velocity over load. . (e.g Depth Jumps, SJ, CMJ, Hurdle Jumps Single-Leg).
Maximal Velocity: Maximal movement speed - Bodyweight (). (e.g CMJ with arm swing, hopping, bounding, rapid plyometrics, sprints.)
Pros + Cons of Traditional Strength Assessment
Easy to track over time.
Logistically simple for large groups.
Requires no specialized technological equipment.
Load serves as a reliable correlate of intensity at near-maximal efforts (> 90\% \text{ of } 1RM
Uses bar load only as a proxy for force; load is not always the best indicator of true physiological output.
Athletes may ‘go through the motions’ without maximum intent, which traditional methods cannot detect.
Lacks the ability to quantify movement velocity or power output with the human eye.
The 3 I’s of Intensity in Strength Training
1. Intensity: Defined as the absolute weight on the bar, usually expressed as a or as a specific Repetition Maximum (e.g., , ).
2. Intent: The lifter’s mental and physical drive to move each repetition with maximum acceleration. Examples: - Lifting with maximum intent might result in a mean velocity of . - Lifting the same with submaximal intent might results in only .
3. Intensiveness: How close the athlete is to muscular failure (RM). - Example: If the intensity is , an athlete might perform reps (far from failure) or reps (point of failure).
Limitations of Intensity Measures: - RPE (Rating of Perceived Exertion): Can be subjective; issues arise if athletes are lazy or lack self-awareness. - Fatigue: Can cause a higher RPE even when the athlete is working at a lower percentage of their .
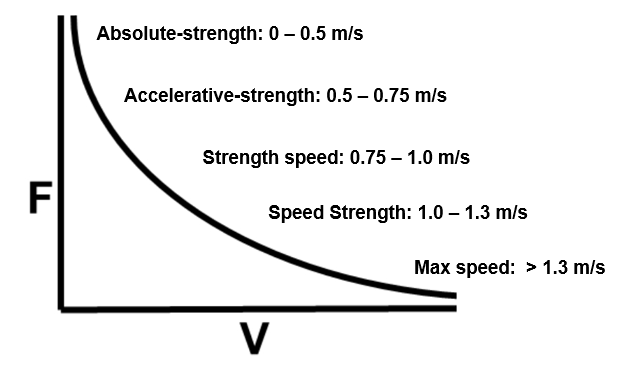
Surfing the Force-Velocity Curve (Velocity Zones)
The Force-Velocity curve represents the inverse relationship between force and velocity: as speed increases, the force that can be produced decreases.
How to create an F–V curve — practical steps (GymAware)
Protocol Essentials
standardised warm‑up
familiarisation
fixed rest intervals
progressive loads or velocity bands (e.g., sets covering >5 velocity zones).
Use best rep per set and standardised technique/depth.
Data Collection
GymAware records bar displacement → computes velocity v=Δd/Δt and acceleration.
‘Force = mass x acceleration’ and ‘Power = force x velocity’.
Collect multiple loads (or target velocities) and plot force vs velocity to fit the linear load–velocity relationship.
How to create a torque–velocity curve — IKD (Isokinetic Dynamometer)
Protocol essentials
careful axis alignment
gravity correction
familiarisation trials
multi‑velocity testing (e.g., 60°/s, 180°/s, 300°/s), and standard rest.
Report joint moments (Nm) across velocities to produce a torque–velocity profile.
Use peak torque and work metrics per velocity.
Key outcome measures to master (what they mean and how coaches use them)
F₀ (N or N·kg⁻¹) = theoretical max force at zero velocity.
V₀ (m·s⁻¹) = theoretical max velocity at zero force.
Pmax (W) = peak power (occurs near mid‑spectrum).
RFD = early time‑window force slope.
Slope / FV imbalance = indicates force‑ vs velocity‑deficit and guides whether to emphasise heavy or fast training.
Validity, reliability and common sources of error
GymAware
generally high validity for mean/peak velocity when compared to gold standards
more affordable
easy to use / non specilaised operators needed
easy to scale and implement for athletes/teams for load monitoring
device placement, exercise type, and bar path introduce error (noise that affects reading)
uses an indirect force estimation so errors in displacement and accleration translate into force and power (Grgic et al, 2020)
follow standardised protocols to reduce noise.
IKD
high internal reliability for torque measures using direct measures
clinical gold‑standard for isolated joint testing
controlled velocity testing to give exact figures
excellent for building velocity profiles to inform rehab for isolated joints
lower ecological validity for multi‑joint sport tasks.
alignment, gravity correction and familiarisation strongly affect validity.
expensive
need trained operators to operate it
How the data should inform S&C practice (actionable rules)
Identify deficit - use F–V slope to classify athlete as force‑deficient (train heavy, low‑velocity) or velocity‑deficient (train light, high‑velocity).
Autoregulation - use velocity zones and velocity‑loss thresholds (e.g., 10–30% loss) to control volume, fatigue and effort intensity and to target adaptations.
Rehab and RTP - use IKD torque profiles and limb symmetry indices to make objective return‑to‑play decisions.