4.1 Population Characteristics
To better understand interactions between organisms in nature, ecologists need to define a number of terms
Terms
Species
group of organisms which have ability to interbreed, under natural conditions, to produce fertile offspring

Population
group of organisms of same species that are living in same area at same time

Population Density
number of individuals of species per unit area or volume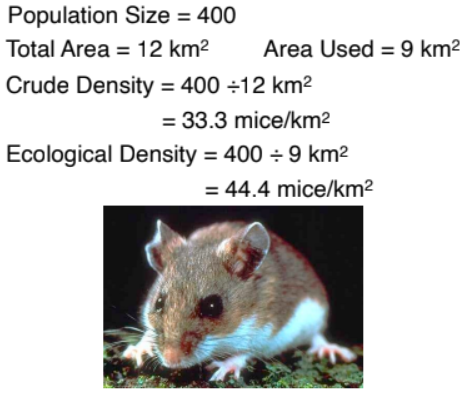
Crude Density
number of individuals per total area
Ecological Density
number of individuals per unit area that is actually used
Habitat
place where species normally lives

Niche
role or function of species within an ecological community
Community
all populations in a given ecosystem at a given time

Ecosystem
living (biotic) and non-living (abiotic) components that function as a unit in a given area or volume
Population Dispersion
Since resources are not always distributed throughout the environment in the same way, all populations do not show the same pattern of dispersion
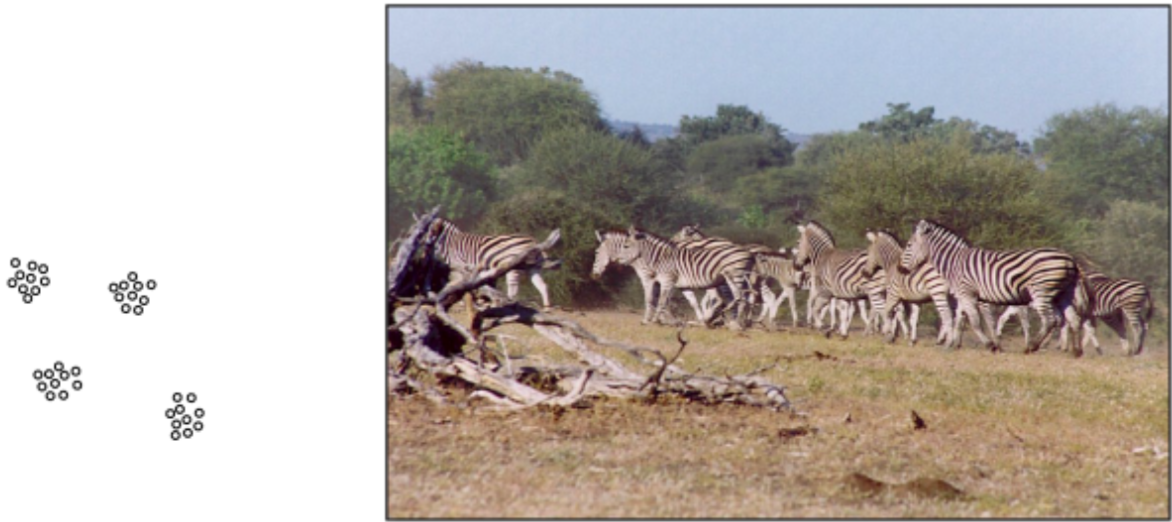
Clumped
most populations show this pattern
Examples: birds “flock”, fish “school”, zebra “herd”, mushrooms on rotted logs
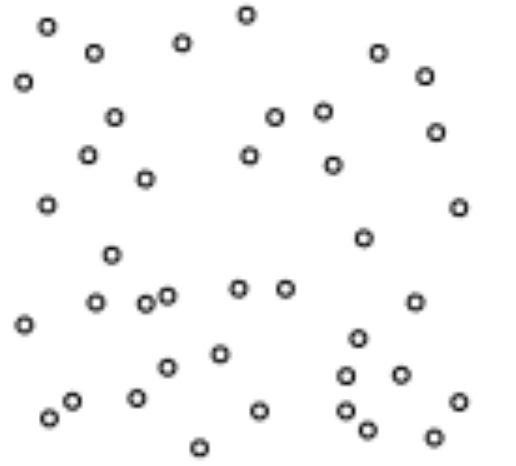
Random
when resources are evenly distributed and there is little interaction between individuals
Examples: trees in tropical rain forest (very rare)
Uniform
individuals are equally spaced apart (almost never seen in nature, but this is how crops are planted)
Examples: due to strong competition for nest sites, King penguins show this pattern
Counting Populations
For organisms that are stationary (plants) use of quadrats is standard method of sampling
Quadrat (stationary organisms)
frame of a given size that is placed at random within a habitat
Count is taken of population size within quadrat
Used to extrapolate size of entire population
For organisms that are stationary (plants) use of quadrats is standard method of sampling
quadrat sampled may fall in a clump
(overestimation)
quadrat sampled may fall between clumps
(underestimation)
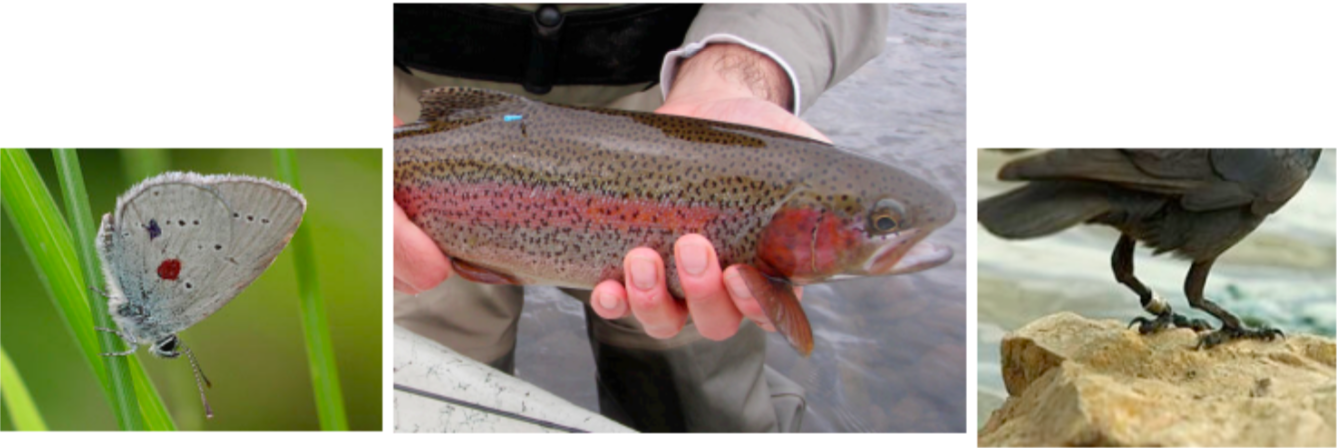
Mark-Recapture Sampling (mobile organisms)
For organisms that are mobile most practical sampling method is mark-recapture sampling
Group of organisms is captured, marked in some way and released
After allowing enough time for marked organisms to mix randomly into population, researchers capture a second sample of organisms
Proportion of marked to unmarked organisms in second sample is used to estimate overall population size
Rationale is: If you can measure proportion of marked individuals in second sample (i.e. 10 out of 100 = 10%)
Equal to proportion of all marked organism in population
(i.e. if 50 were marked, then that’s 10% of all individuals, so population size is 500)
Following equation is used to estimate population size in mark-recapture sampling:
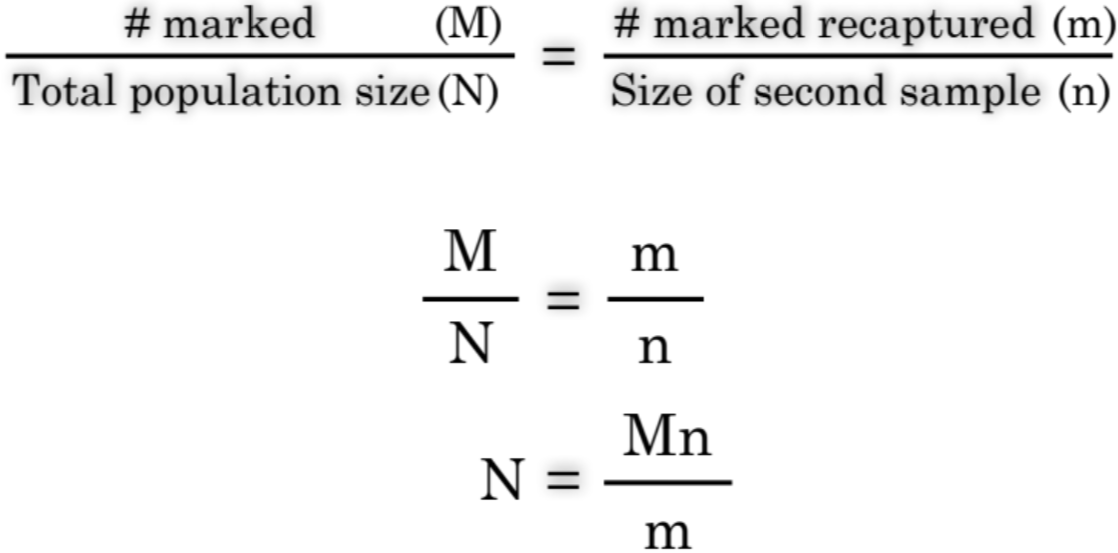 Accuracy of mark-recapture sampling depends on following assumptions:
all individuals in population have an equal chance of being captured
during time between samples, ratio of marked to unmarked individuals is constant (i.e. marking does not affect chance of survival)
during study period population size is constant
