Intelligence and Schooling - Chapter 8 Pg. 263-283
Concept Development and Intelligence
What are Concepts? (not in textbook)
Modern approach of cognitive revolution
Concepts refer to understandings we use to group together things that have something in common
How do they come into play?
Who’s and what’s (e.g. people) compared to where, when and how?
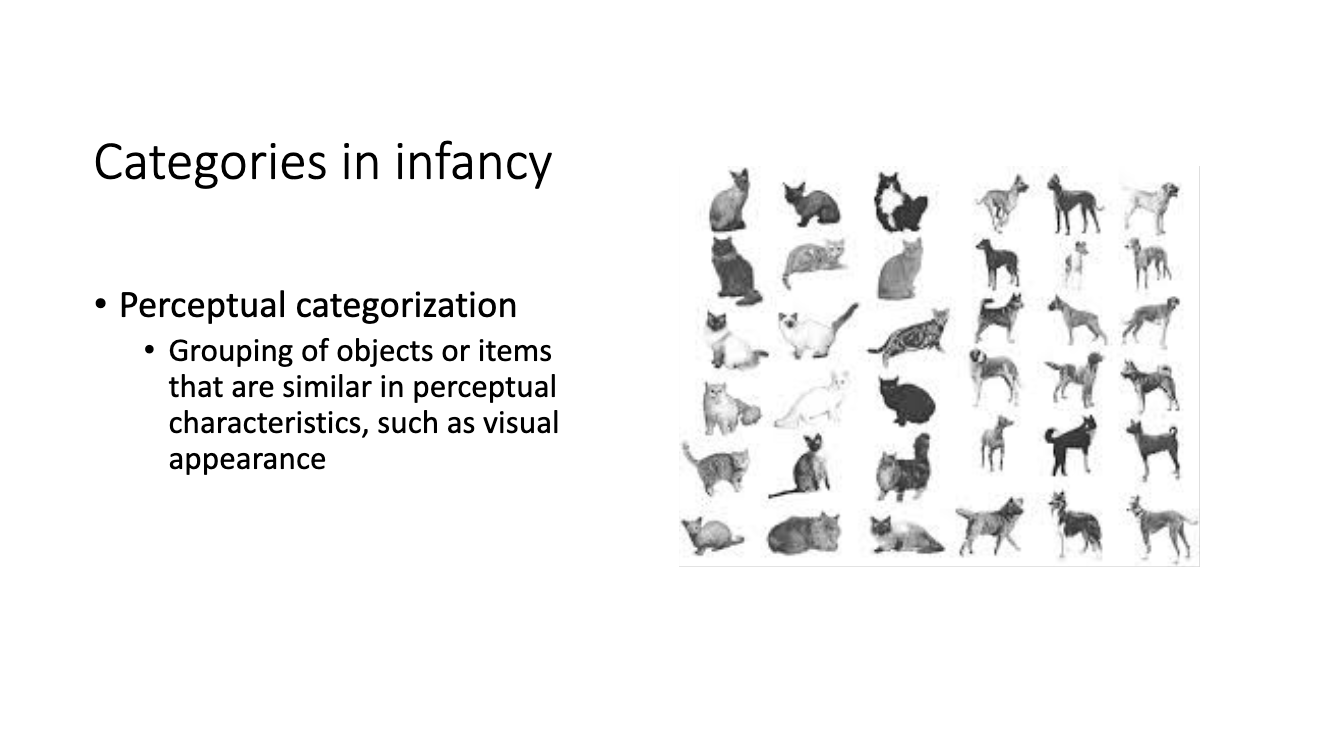
Categories in Infancy
Early concept categories
The ways we group objects in terms of perceptual commonalities
Paul Bloom and colleagues
Put together groups of things that belong in a categories
Infants are able to categorize dogs and cats (different visual characteristics allow infants to categorize groups)
Semantics allow infants to further refine their understanding of these categories, helping them to distinguish not only between animals but also to develop concepts related to size, colour, and behaviour
Categories beyond Infancy
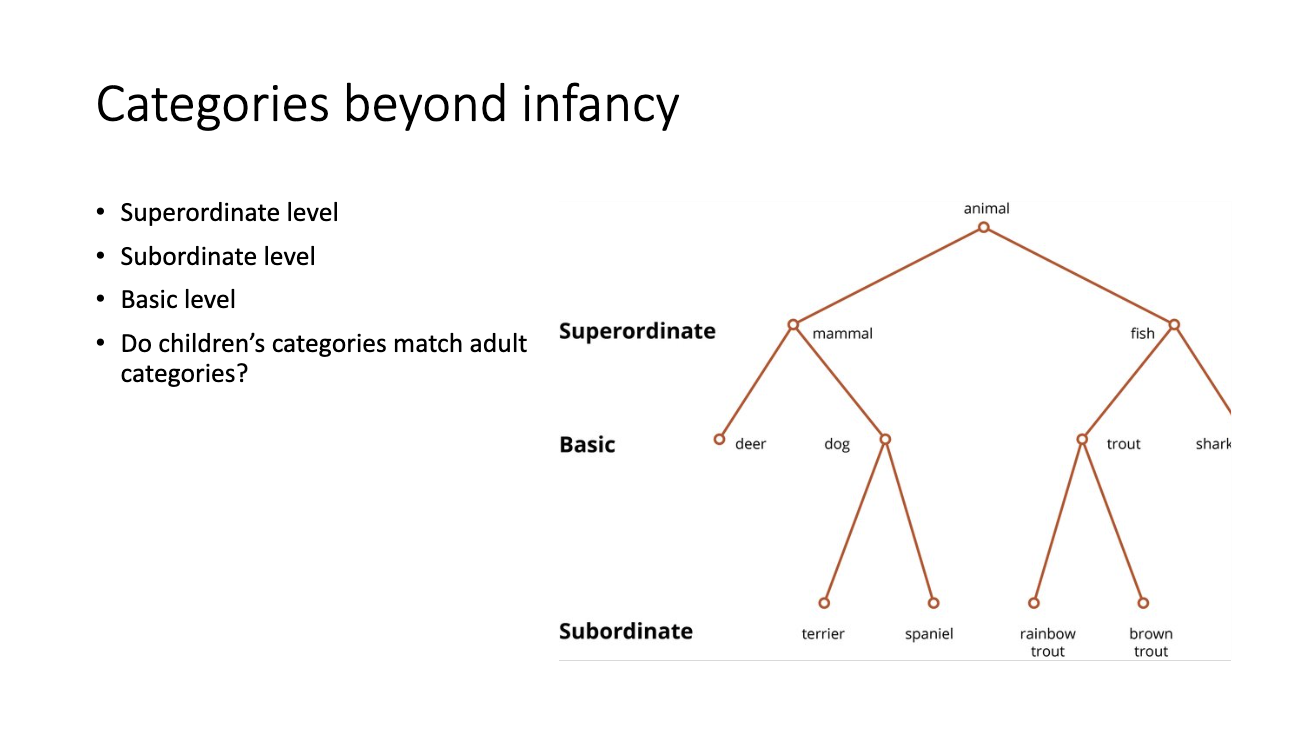
Children understanding of these categories are not the same as adults
How do we know?
Overgeneralization and under generalization
Example: A child has a golden retriever in the house, they may assume everyone has a dog that looks like a golden retriever
Categories are determined by level of experience
Textbook talks about how language affects thought:
Language drives thinking
Wharf had done a study about Inuit people
Discover 13 different descriptors for snow (they have developed different descriptors of snow)
Causal Understanding
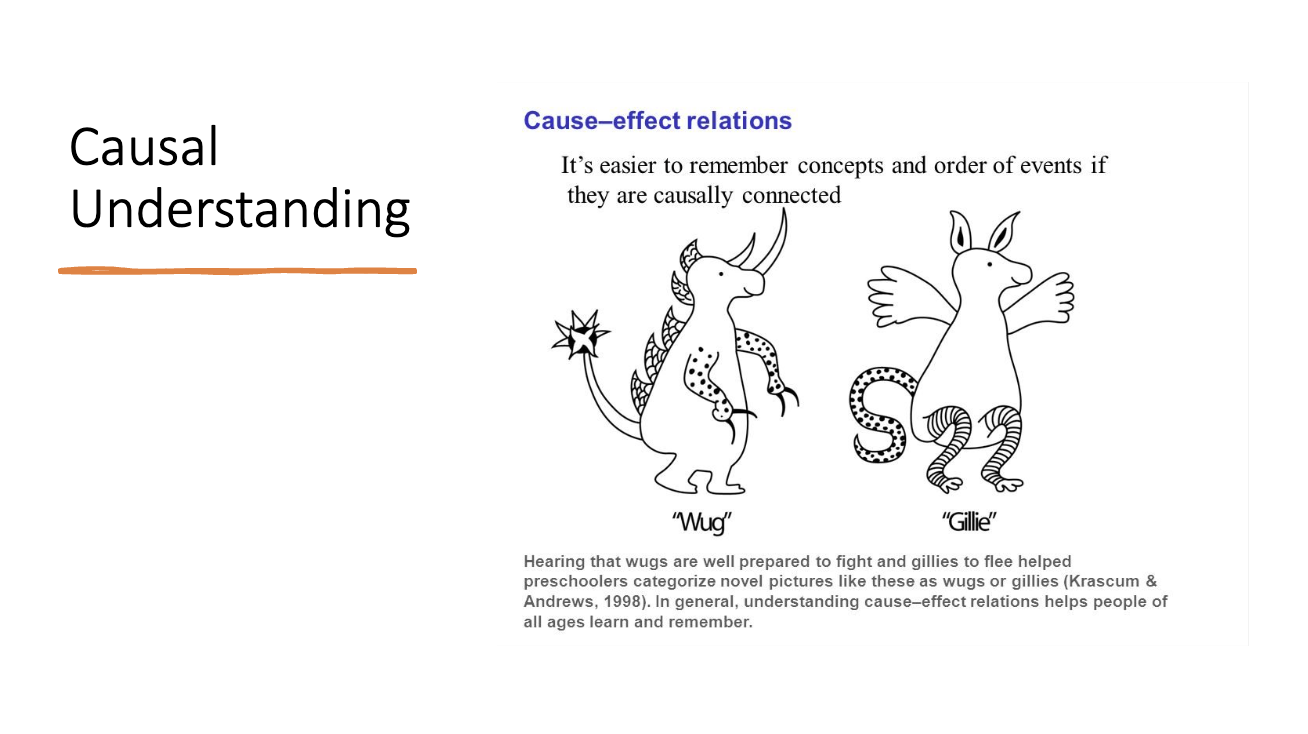
Krascum and Andrews, 1998
Two make believe creatures
Wug and Gillie has different distinct features
Helps children categorize of how to put these objects into groups
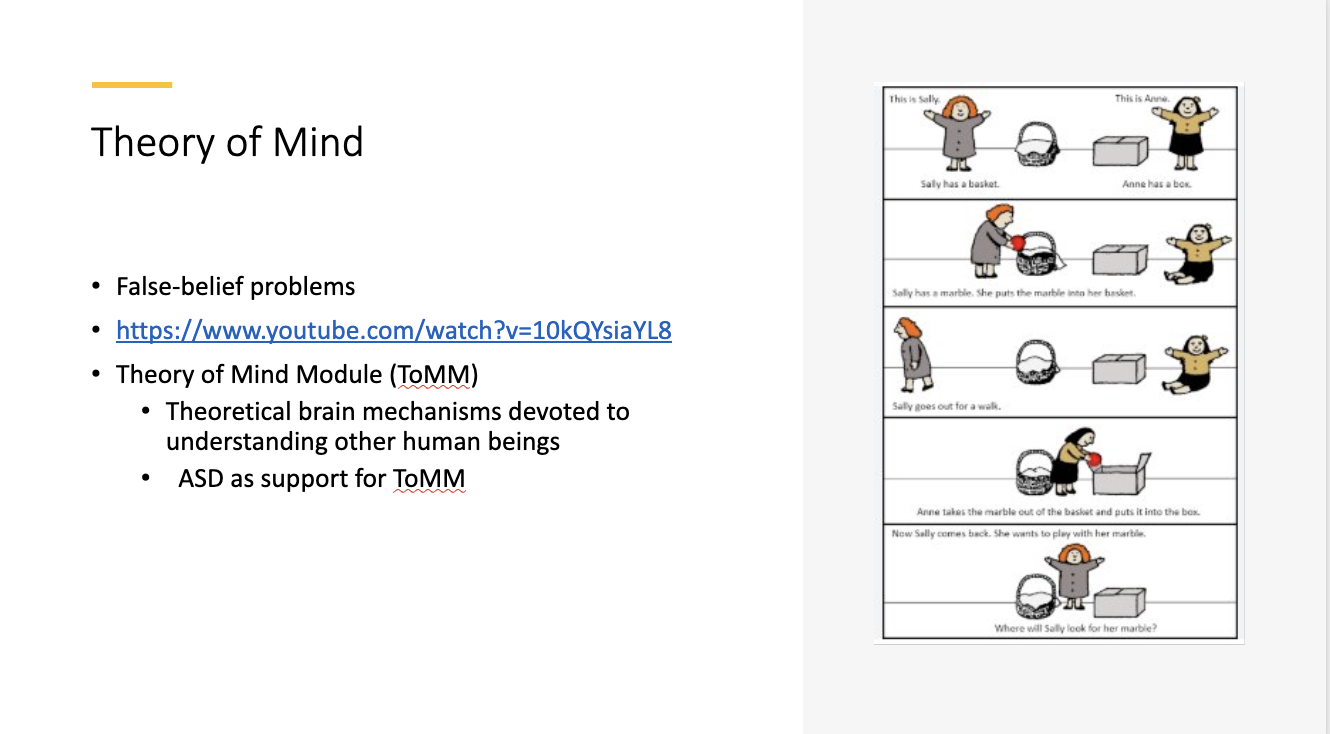
Theory of Mind
Children are consistently updating these theories
Preschoolers aren’t great at theory at mind: they fail theory of mind tasks
Study
Sally and Anne
The study consist of two dolls, Sally and Anne, where Sally places a marble in a basket and leaves the room. While she is away, Anne moves the marble to a box. Upon Sally's return, children are asked where Sally will look for the marble. Preschoolers typically answer that Sally will look in the box, demonstrating their struggle with understanding that Sally has a different perspective
The Sally and Anne study demonstrates how children struggle to understand that others can have beliefs different from their own, indicating a developing sense of perspective-taking
Sally has a set of knowledge that is different then Anne’s
Another Study
Smarties tubes were used to assess children's understanding of false beliefs, where children were shown that a Smarties tube contained pencils instead of the expected candy, highlighting their ability to recognize that others might be misled by the same information
This study further illustrates the concept of theory of mind, as it requires children to grasp that someone else's knowledge may not align with their own experiences
Results
3 year olds don’t have an understanding what they use to think “I always thought there were pencils in the smarties box”
Older children will think “I thought there were candy, but I’m wrong and there are pencils”
Children are poor liars
3 year olds are egocentric
Autism spectrum disorder related to the problem of this module
Children with ASD do not do well in the Sally and Anne task
What is Intelligence? (Chapter 8)
Piaget
How do we acquire knowledge?
Intelligence is adaptive behaviours/actions
Problem solving
High verbal ability
High social competence
There is no single definition of what intelligence means
1990’s a researcher sent little notes to all his colleagues asking what is intelligence, they received back different differences
Psychometric Approach to Intelligence
This variation in responses highlights the complexity of intelligence and suggests that it encompasses a range of cognitive abilities, social skills, and emotional understanding that can be influenced by cultural and contextual factors
There are going to be variation between people of intelligence levels, which can be attributed to both genetic predispositions and environmental influences, leading to diverse manifestations of intelligent behaviour in different contexts
Different theorist have different perspectives
The history of intelligence dates back to the start of psychology (men want to prove superiority by intelligence)
Binet and Simon’s Intelligence
All intelligence tests stem from Binet and Simon
Hired by the french government to determine whether or not children in school, what children might need special attention in class
Set of test measure skills that are critical for academic success, including verbal reasoning, problem-solving abilities, and memory retention
Standardize IQ test
Mental age
Age graded questions you can complete successfully
Example: If you can successful complete 6 year old questions at the age of 4, you have a chroniclogically age of 4 but a mental age of 6 years old
How we test Intelligence?
IQ tests are batteries of tasks designed to measure various cognitive abilities, including reasoning, problem-solving, and comprehension, which are then compared to normative data to derive an intelligence quotient
Why bother?
IQ as a measure is highly predictive that we consider things to be successful
IQ predict academic performance, job success (wealth) and adjustment to social environments, making it a key indicator for personal and professional development
There are assessments that test intelligence
University students are use to perform good a tests and often demonstrate higher IQ scores compared to their peers, reflecting their ability to navigate complex academic challenges and apply critical thinking skills
Though this doesn’t mean other people are less intelligence, they just don’t perform well on IQ because of their lack of tests they take
Assessing Infant Intelligence
Bayley scale
Motor: Grasping, fine motor skills, gross motor skills
Mental: More adaptive behaviours (categorizing objects)/following directions
Infant behavioural record: Caregiver report: rating scale on infant’s behaviours (outgoing/not outgoing…etc)
Given a DQ
A summary of the three sub scales
How stable is IQ?
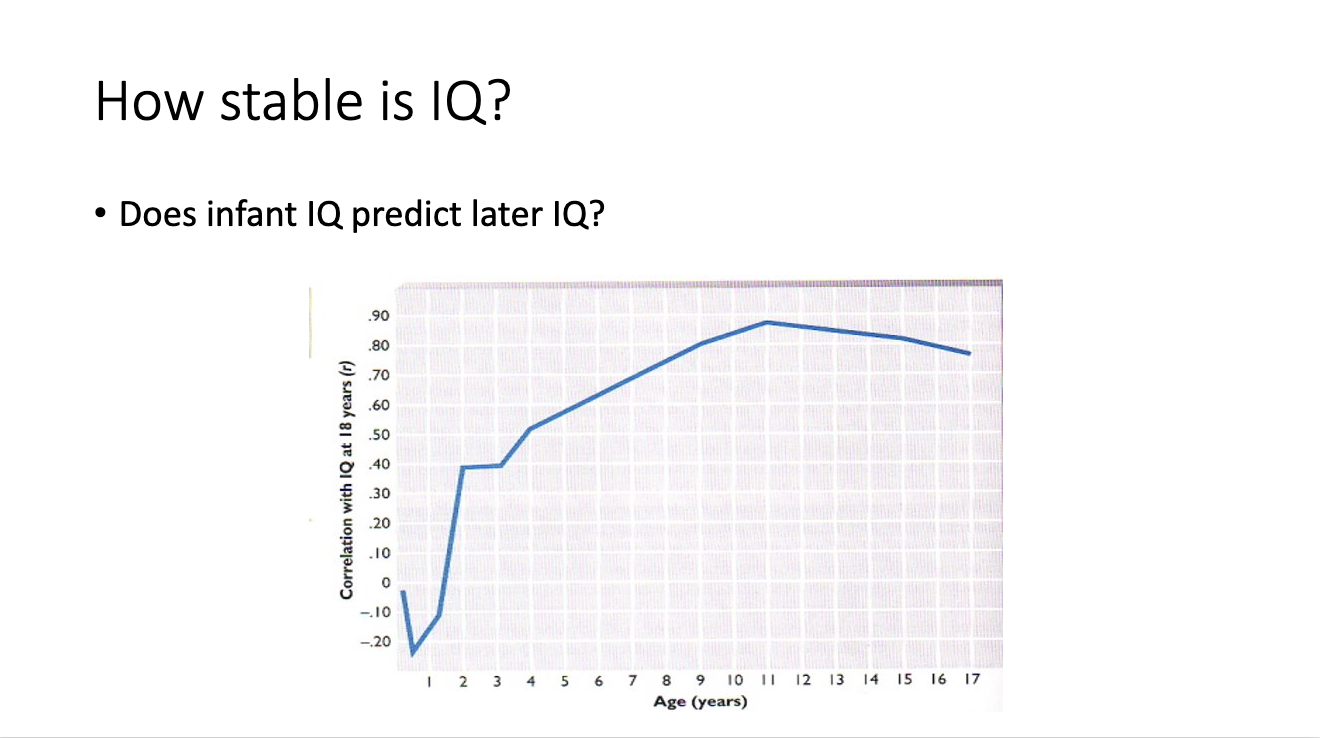
DQ predicts IQ
We see a steep drop off
Negatively correlated: No correlation of DQ predicting IQ
Tells us intelligence measure before children enter school are’t good as assessing predictor for intelligence
The bailey is not measuring cognition, which is not the same set of measurement that IQ tests have
Not comparable
DQ tests is measuring development quality, which focuses on the overall growth and learning environment of the child, rather than strictly cognitive abilities
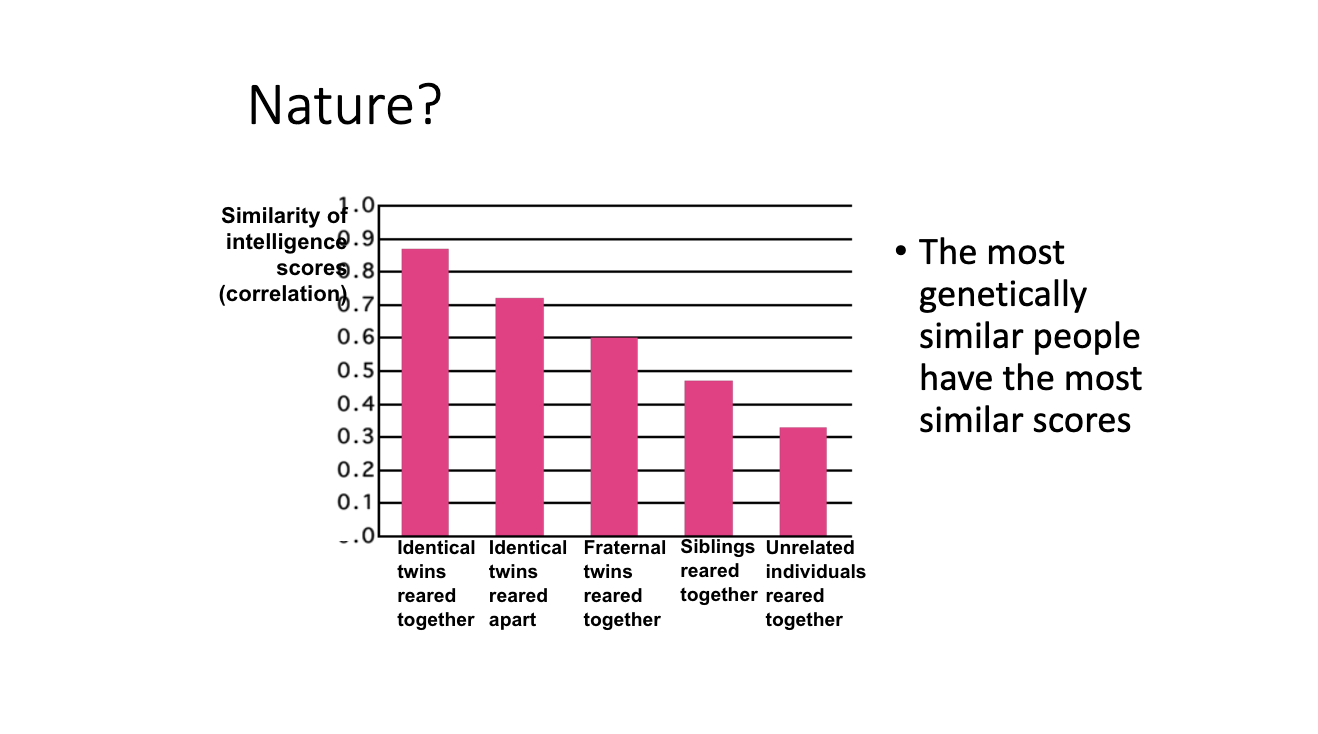
Nature?
IQ is kind of from nature based on inherited traits and biological factors, suggesting that intelligence has a genetic component that influences cognitive abilities
Identical twins have the same IQ
The more genetically related you are the higher your scores are
People who have no familiar relationship have lower scores
This proves the success of genetic influences on intelligence, highlighting the significant role of heredity in cognitive abilities
Identical twins reared together vs. Identical twins reared apart
Environment suggests there is significant contribution
Some of the components might be genetically driven
Or maybe Nurture?
We know that we can change IQ scores by experience
Enrichment program
1980s in the US became federally funded
They were found to enhance children cognitive abilities and academic performance in school
Orphanages in the middle east were tested, children that were delayed were easily able to re-bounce their learning skills
Responsive caregiving increased IQ assessments, they were doing better after enrichment
Children who already live in supportive environments showed a mixed outcome, not really a demonstrated change
But coming into highly deprived environments that supports intelligence
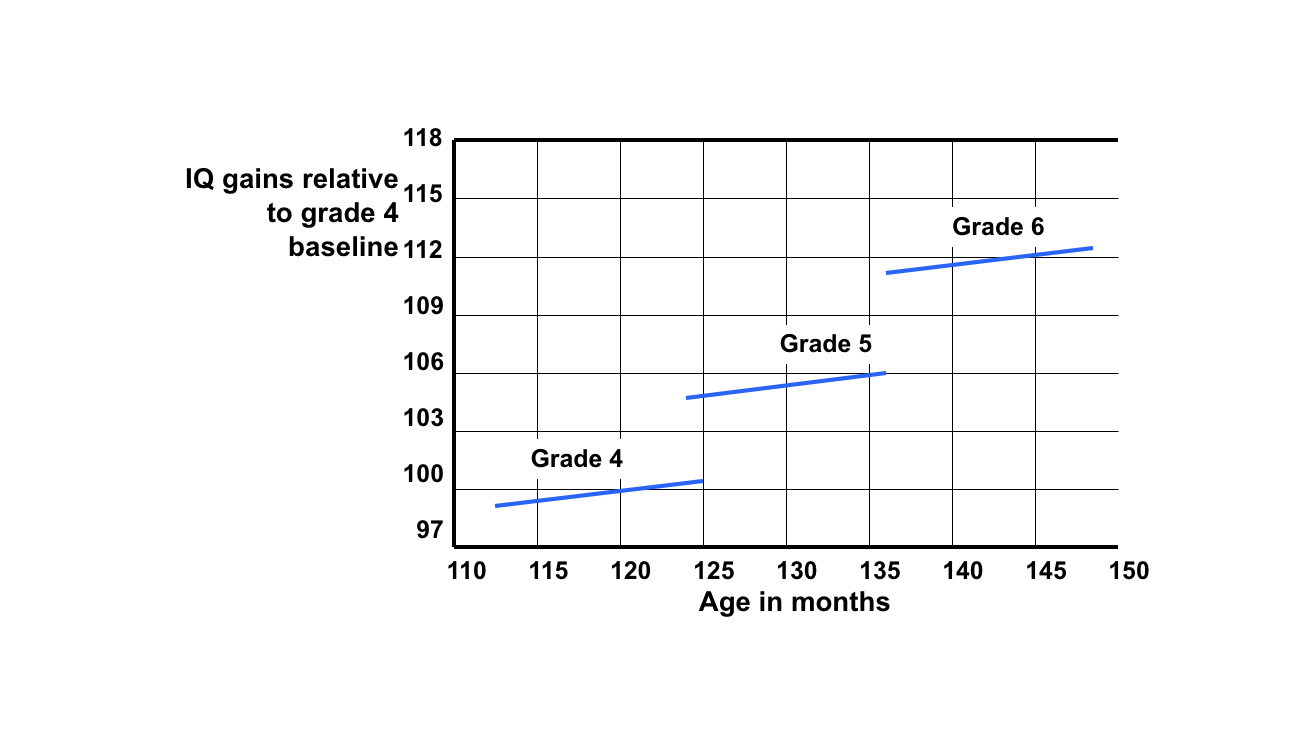
Schooling
Refers to More schooling creates more IQ gain
Schooling provides added assessments that IQ is assessing, you are being taught to think critically and develop problem-solving skills, which in turn can enhance cognitive abilities and lead to higher IQ scores
Flynn Effect
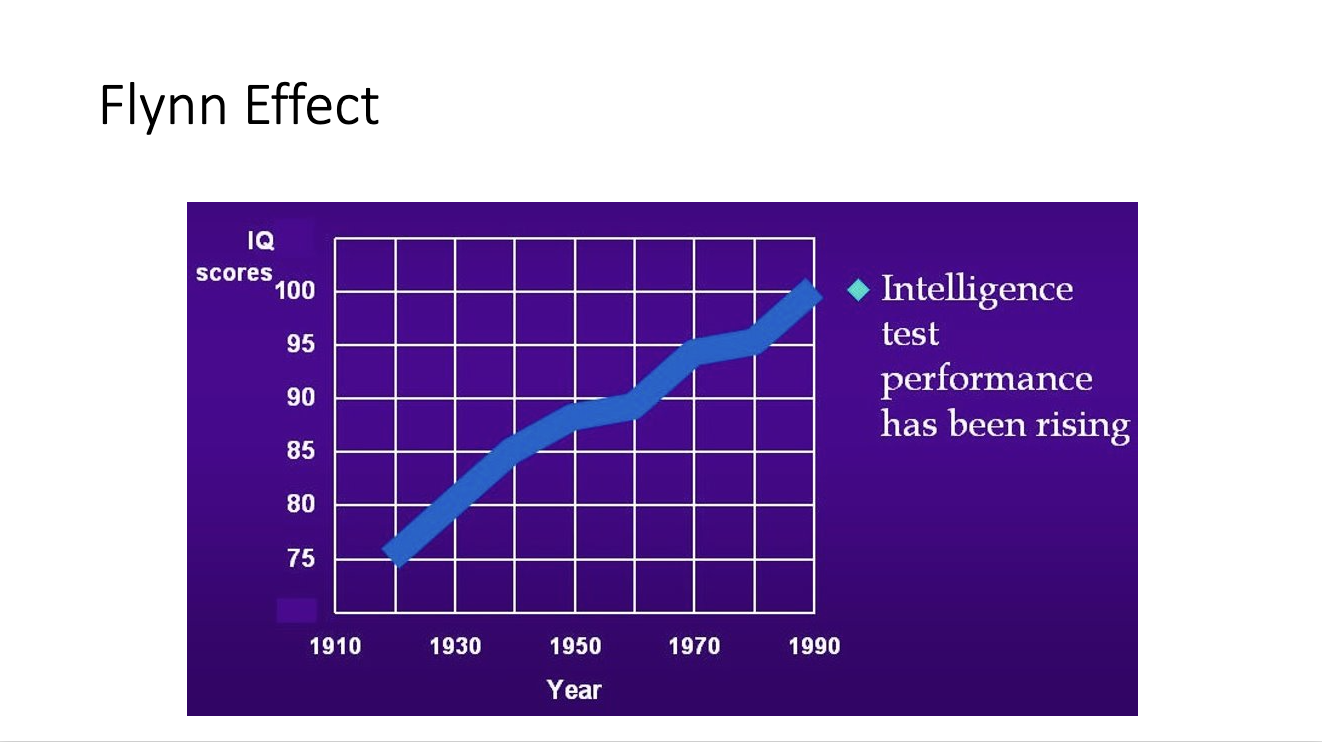
This phenomenon, known as the Flynn Effect, illustrates how average IQ scores have increased over time, suggesting that environmental factors, such as improved education and access to information, play a significant role in cognitive development
You’re going to score higher than your grandma, that’s weird it shouldn’t be like that
IQ scores are increasing
Some suggest: we have a better quality, availability of opportunity for cognitive development, which includes access to advanced educational resources, technology, and a more stimulating environment that encourages critical thinking and problem-solving skills
Textbook
Intelligence: Determining Individual Strengths
Intelligence Benchmarks: Differentiating the Intelligent for the Unintelligent
Describe traditional methods for measuring intelligence
Intelligence
The capacity to understand the world, think with rationality, and use resources effectively when faced with challenges
To understand how researchers have approached the tasks: Intelligence tests
Binet’s Pioneering Efforts
The Paris school system 1900’s
Children were not benefiting from regular instruction, these children many of whom we would now say had intellectual disabilities were generally not identified early enough to shift them to special classes
“Bright or dull”
Links intelligence and school success
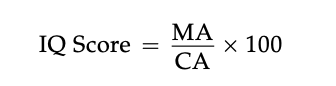
Intelligence Quotient (IQ)
A score that takes into account a student’s mental and chronological age
Measuring IQ: Present day approaches to Intelligence
Examine current methods of intelligence testing
Stanford-Binet Intelligence Scale (SB5)
A test that consists of a series of items that vary according to the age of person being tested
The tests consist of a series of items that vary according to the age of the person being tested
Example: Young children are asked to answer questions about everyday activities or to copy complex figures
Older people are asked to explain proverbs, solve analogies and describe
Wechsler Intelligence Scale for Children (WISC)
A test for children that provides separate measures of verbal and performance (non verbal), skills as well as a total score
The test is administered orally
Significantly higher scores on the performance part of the test than on the verbal part may indicate difficulties in linguistic development
Kaufman Assessment Battery for Children
A children’s intelligence test permitting unusual flexibility in it’s administration
Children are tested on their ability to integrate different kinds of stimuli simultaneously and to use step by step thinking
It allows the person giving the test to use alternative wording or gestures, or even to pose questions in a different language
Central Issues in Intelligence testing
Explore key issues surrounding intelligence testing
Group Administration
Disadvantages
The questions asked on group tests tend to be more restricted than those administered individually
Children are often more motivated when they are asked questions individually by a test administer than when responding to a group
Outside factors such as being distracted by other students, having their pencils break or not paying attention to instructions, may interfere with children’s performance
Reliability and Validity
Reliability
A quality of tests that measure consistently what they are trying to measure
If a test produced a score of 105 at one time, but the next time it pro- duced a score of 130, then it is not reliable. However, if each time the test is administered to the same individual it yielded a score of 105, then the test is reliable
Even if a test is reliable, it is not necessarily valid
Validity
A quality of tests that actually measure what they are supposed to measure
A test has validity when it actually measures what it is supposed to measure. For instance, just as a valid bathroom scale should measure a person’s weight correctly and unambiguously, a valid IQ test should measure an individual’s underlying intelligence correctly and unambiguously.
Tests can be reliable without being valid. For example, we could devise a completely reliable test for intelligence if we made the assumption that skull circumference was related to intelligence. Because measuring skull size precisely is fairly easy, we would then have a very reliable measure
The Meaning of IQ scores
IQ scores are often used as predictors of school performance, which makes sense since intelligence tests were originally designed to identify students struggling academically. Generally, children with higher IQ scores tend to do better in school. However, outside of academics, the relationship between IQ and success is less clear. While people with higher IQs are more likely to complete more years of education, IQ alone does not strongly predict income or career success. Two individuals with different IQ scores may earn the same degree, but the one with the lower score might end up with a higher income or a more successful career. Because of these limitations, researchers have explored alternative ways to measure intelligence
Even within academics, IQ scores are not always reliable indicators of performance. Approximately 2.6 million children in the U.S. are diagnosed with learning disorders, which involve difficulties in skills like reading, writing, math, and reasoning. These disorders are identified when a child's academic performance does not align with their potential to learn. The most common learning disorder is attention-deficit/hyperactivity disorder (ADHD). Children with ADHD struggle with inattention, impulsivity, and frustration, but their IQ scores are usually average or above. Dyslexia is another learning disorder that affects reading and writing skills, making it difficult to recognize letters, sound out words, or spell correctly. For children with learning disorders, traditional IQ tests can be particularly challenging, sometimes leading to artificially low scores that do not accurately reflect their intelligence.
Despite the widespread use of IQ tests, their practical usefulness remains debated. Because traditional IQ scores do not always capture a person’s full intellectual abilities or predict long-term success, researchers have turned to alternative ways of understanding intelligence
Specific learning disorders
Difficulties in the acquisition and use of listening, speaking, reading, writing, reasoning, or mathematical abilities
What IQ Tests Don’t Tell: Alternative Conceptions of Intelligence
Analyze alternative definitions of intelligence
The g factor is what IG tests presumably measure
Intelligence is unidimensional
Two kinds of of intelligence exists: Fluid and crystallized
Fluid Intelligence: reflects information processing capabilities, reasoning, and memory
Example: A student asked to group a series of letters according to some criterion or to remember a set of numbers would be using fluid intelligence
Crystallized Intelligence: The cumulative information, skills, and strategies people have learned and can apply in solving problems
Example: A student would likely use crystallized intelligence to solve a puzzle or find the solution to a mystery
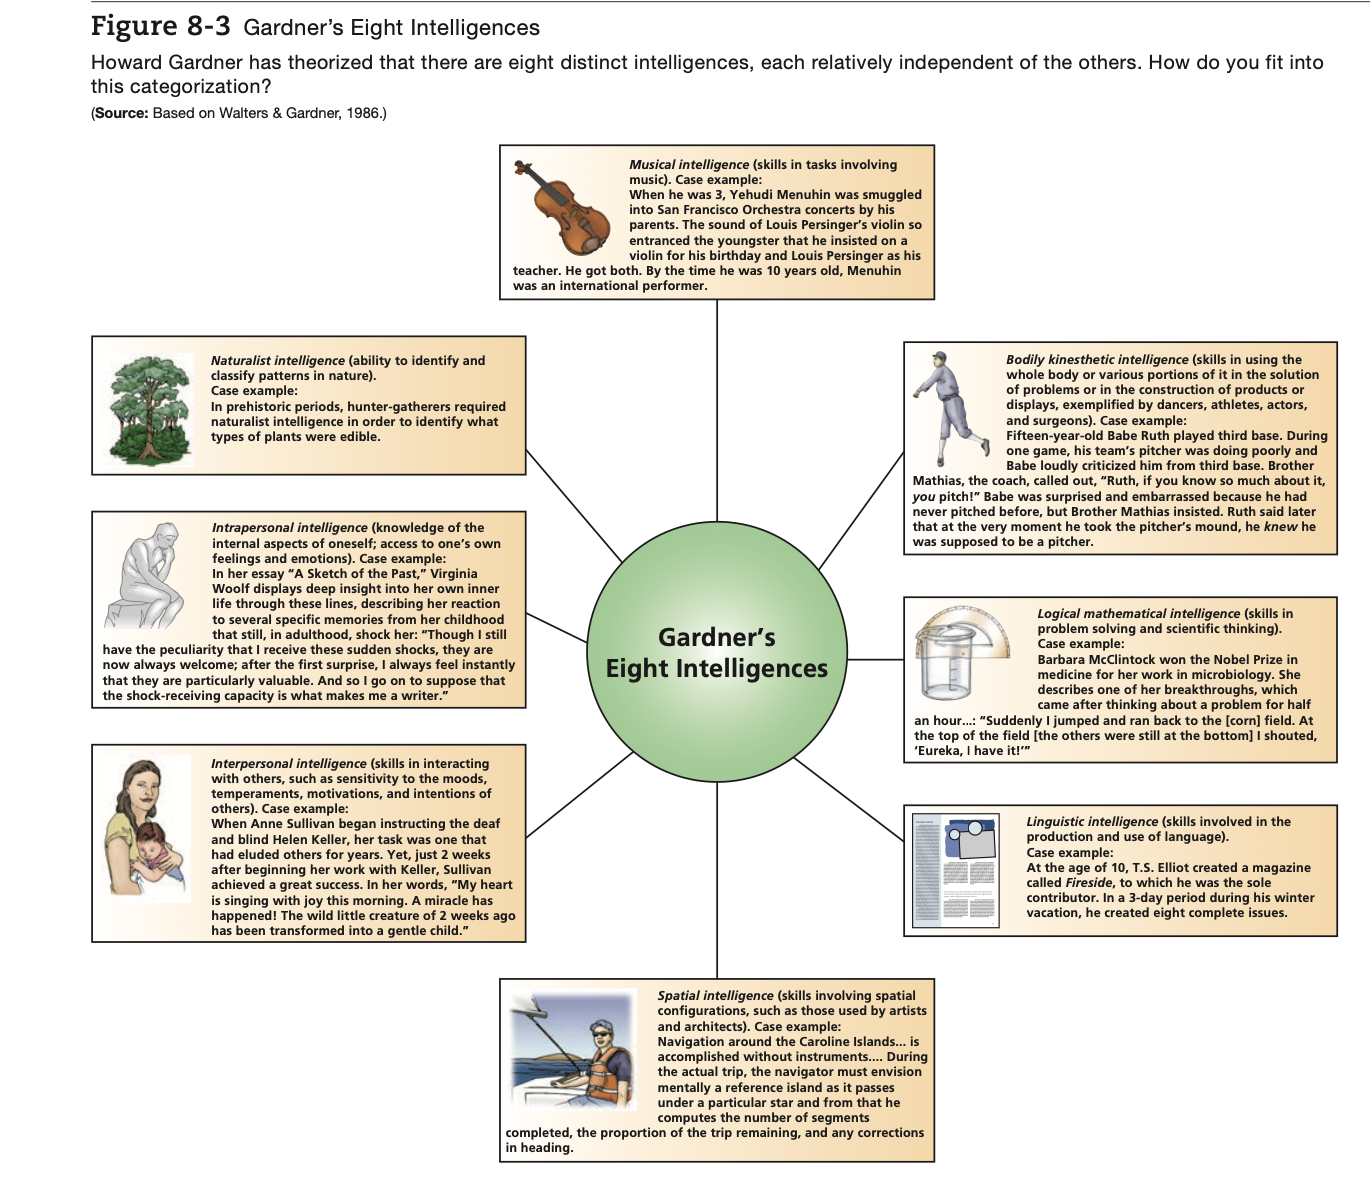
Howard Gardner
Suggests that we have at least eight distinct intelligences, each one of them relatively independent of the other
He suggests that:
Example: Some people may be particularly skilled in linguistic intelligence, while others may be particularly skilled in musical intelligence
Others may be the opposite pattern
Vygotsky
Took a very different approach to intelligence
Suggested that we should assess intelligence by looking not only at fully developed cognitive processes but at processes in development too
To do this.. assessment tasks should involve cooperative interaction between the assessed individual and the assessor this is called DYNAMIC ASSESSMENT
Intelligence is reflected both in how children perform on their own and how they perform when helped by adults
Robert Sternberg
Suggests that intelligence is best viewed as information processing
In this view, how people store material in memory and later use it to solve intellectual tasks provides the most precise concept of intelligence
Rather than focusing on the subcomponents that make up the structure of intelligence, information processing approaches examine the processes underlying intelligent behaviour
People with high IQ scores spend more time on the initial stages of problem solving, retrieving relevant information from memory, in contrast, those who score lower tends to skip ahead and make less informed guesses
Triarchic Theory of intelligence
The belief that intelligence consists of three aspects of information processing: the componential element, the experimental element, and the contextual element
Sternberg suggests that intelligence is made up of three major components: componential, experiential, and contextual.
The compo- nential aspect involves the mental components used to solve problems (e.g., selecting and using formulas, choosing problem-solving strategies, and in general making use of what has been learned in the past)
The experiential component refers to the relationship among intelligence, prior experience, and the ability to cope with new situations. This is the insightful aspect of intelligence, which allows people to relate what they already know to a new situation and facts never before encountered
The contextual compo- nent of intelligence takes account of the demands of everyday, real-world environments. For instance, the contextual component is involved in adapting to on-the-job professional demands
Practical Intelligence
According to Sternberg, intelligence that is learned primarily by observing others and modeling their behaviour
They understand and handle even new situation effectively, reading people and circumstances insightfully based on their previous experiences
Emotional Intelligence
The set of skills that underlies the accurate assessment, evaluation, expression and regulation of emotions
Emotional intelligence is what enables people to get along with others, to understand what they are feeling and experiencing and to respond appropriately to their needs
Creativity
One reason for the higher creativity during early adulthood may be that after this period, creativity can be stifled by the fact that the more people know about a subject, the less likely they are to be creative. Early adulthood may be the peak of creativity because many problems encountered professionally are novel. As people get older, however, and become more familiar with the problems, their creativity may be stymied. In addition, as we age we become less flexible in our thinking, and we are less likely to adopt unfamiliar hypotheses and assumptions
One suggested component of cre- ativity is a person’s willingness to take risks that may yield high payoffs. Creative people are like successful stock market investors who follow the “buy low, sell high” rule. Creative people develop and endorse ideas that are unfashionable or regarded as wrong (“buying low”), assuming that eventually others will see their value and embrace them (“selling high”). According to this theory, creative adults take a fresh look at ideas that were initially discarded, particularly if the problem is a famil- iar one. They are flexible enough to move away from tried-and-true ways of doing things and to consider new approaches
Controversies Involving Intelligence
What is Infant Intelligence?
Describe recent approaches to measuring intelligence in infants
Developmental scales
Arold Gesell formulated the earliest measure of infant development
If an infant varied significantly from the norms of a given age, they were considered to be developmentally either delayed or advanced
Gesell’s primary motivation in developing his norms was to screen out abnormally developing infants for purposes of adoption
Developmental quotient
An overall developmental score that relates to performance in four domains:
Motor skills
Language use
Adaptive behaviour
Personal and social skills
Later researchers were motivated by different goals…
Nancy Bayley
Bayley Scales of Infant and Toddler Development
A measure that evaluates an infant’s development from 2 to 42 months
The Bayley scales concentrate on two areas:
Mental
Focuses on the senses, perception, memory, learning….
Motor abilities
Fine motor skills
Gross motor skills
The scales are particularly useful in identifying infants who are substantially behind their peers and who therefore need immediate special attention
In extreme cases these scales arent good at predicting a child’s future course of intellectual development
Information Processing Approaches to Infant Intelligence
When we talk about intelligence, we often describe people as being "quick" or "slow." Research suggests that the speed at which infants process information can be linked to their later intelligence
Babies who quickly learn about and lose interest in familiar stimuli tend to have higher IQ scores as they grow older
Developmental Quotient (DQ): Measures a baby's abilities in four areas—motor skills, language, adaptability, and social skills.
Bayley Scales of Infant Development: Evaluates how well a baby is developing between 2 and 42 months of age.
Cross-Modal Transference: The ability to recognize something using a different sense than the one originally used (e.g., identifying by sight an object that was only touched before). This skill is linked to later intelligence.
Infants who are better at remembering and recognizing objects, as well as those who quickly shift their attention to new things, tend to score higher on intelligence tests later in life. However, while early cognitive abilities may relate to IQ, they are only part of the picture—environment and other factors also play a big role
Limits of IQ Tests
IQ tests predict school performance fairly well but are less useful for measuring life success. A person with a lower IQ could still do well in their career and earn more than someone with a higher IQ. IQ scores also don’t account for creativity, social intelligence, or practical skills
IQ tests can be misleading, especially for children with learning disorders like:
ADHD: Kids may struggle with attention and impulsivity but still have normal or above-average IQs.
Dyslexia: Reading challenges can make test-taking difficult, resulting in lower IQ scores that don’t truly reflect intelligence.
Because of these issues, researchers have developed alternative ways to measure intelligence beyond standard IQ tests
Achievement vs. Aptitude Tests
In school, children take different types of tests:
Achievement Tests: Measure what a student has already learned (e.g., a math or history test).
Aptitude Tests: Predict future performance in a specific subject or skill (e.g., SAT or ACT for college readiness).
The distinction between these tests isn’t always clear, as some aptitude tests may actually measure past learning rather than future potential
IQ Tests and Cultural Bias
IQ tests are not always fair because they can be influenced by a person’s background and experiences. If a test asks about subways, urban students may do better, while rural students might struggle. Many educators argue that traditional IQ tests favor white, middle-class students over others.
Studies have shown racial differences in IQ scores, with Black Americans often scoring lower than white Americans. However, researchers debate whether this reflects true intelligence differences or biases in how tests are designed. If a test is written in a way that favors one cultural group, it may not accurately measure intelligence across all populations
Understanding IQ Differences Among Cultural Groups
Heredity vs. Environment: What Shapes Intelligence?
One of the biggest debates in child development is whether intelligence is mostly inherited (genetics) or shaped by the environment (education, social conditions).
If intelligence is mostly genetic, efforts like improving schools would have little impact on IQ.
If intelligence is mostly environmental, changing social and educational conditions could significantly boost cognitive abilities
The Bell Curve Controversy
In 1994, Richard Herrnstein and Charles Murray published The Bell Curve, arguing that the average 15-point IQ difference between Black and white individuals was mainly due to genetics. They linked this to poverty, unemployment, and welfare dependency in minority groups.
However, most psychologists strongly disagreed, arguing that:
IQ differences between racial groups can be explained by environmental factors (e.g., economic background, access to education).
When comparing children from similar middle-class backgrounds, Black and white children have similar IQ scores.
Lower IQ scores do not cause poverty or social issues—other complex social factors are involved
Cultural Bias in IQ Tests
Many IQ tests were originally designed using white, English-speaking, middle-class individuals as the standard. As a result, children from different cultural backgrounds may struggle with these tests, not because they are less intelligent, but because the tests favor the majority culture.
Example: In one California school district, Mexican American students were 10 times more likely than white students to be placed in special education classes.
Another case: A state exam included an essay question with racial bias, which negatively impacted Black students' performance.
Statistics: Nationally, Black students are classified as mildly intellectually disabled twice as often as white students, mainly due to test bias and poverty.
Efforts have been made to create culturally fair IQ tests, such as the System of Multicultural Pluralistic Assessment (SOMPA), but no test can be completely free of bias
Modern View: IQ Is a Mix of Genetics and Environment
Most experts today believe intelligence results from both nature (genetics) and nurture (environment) interacting.
Research by Eric Turkheimer found that environment plays a bigger role in IQ for poor children, while genetics becomes more influential for wealthier children.
Instead of focusing on how much IQ is genetic vs. environmental, improving children’s living conditions and education is the best way to help them reach their full potential
Cognitive Functioning in Adulthood
Describe the effects of aging on intelligence
Does Intelligence decline in adulthood?
How Research Methods Impact Our Understanding
Cross-Sectional Research
Cross-sectional studies compare people of different ages at the same point in time and originally suggested that intelligence declines after the mid-20s. However, these studies have a major flaw: cohort effects—differences between generations that may not be due to aging itself.
Older participants may have had less education, fewer job opportunities, or poorer health than younger participants.
This means their lower IQ scores may not reflect aging but differences in life experiences
Longitudinal Research
Longitudinal studies, which follow the same individuals over time, paint a different picture. These studies show that:
Intelligence remains stable or even increases until the mid-30s or 50s, after which it slowly declines.
However, practice effects may inflate scores because participants become familiar with the test over time.
Another issue is sample loss—people drop out due to illness, death, or other reasons, leaving behind a group that may not represent the general population
Types of Intelligence: Fluid vs. Crystallized
To better understand intelligence changes, researchers distinguish between two types:
Fluid Intelligence (problem-solving, reasoning, memory)
Peaks in young adulthood and declines with age.
Example: Solving puzzles, remembering sequences of numbers.
Crystallized Intelligence (accumulated knowledge, experience-based skills)
Stays steady or improves with age.
Example: Vocabulary, solving crossword puzzles, general knowledge.
Because crystallized intelligence can improve while fluid intelligence declines, the answer to whether intelligence declines is both yes and no
Recent Findings on Adult Intelligence
A major study by K. Warner Schaie combined cross-sectional and longitudinal methods to study thousands of adults over time. Key takeaways:
Some abilities decline from age 25, while others remain stable.
Minimal decline is seen before the 80s, with fewer than half showing significant drops by age 81.
Individual differences matter—some people show decline in their 30s, while others perform better than younger adults in their 70s.
Lifestyle factors impact cognitive aging, such as:
Higher education and socioeconomic status
Intellectual stimulation (reading, puzzles, learning new skills)
Good physical and mental health
Engaging social relationships
Why Do Some Cognitive Abilities Decline?
Brain function changes—some learning and memory-related genes become less efficient by age 40.
Older adults use both brain hemispheres for tasks that younger adults complete with just one hemisphere, possibly as a compensatory mechanism
Competence vs. Intelligence Decline
Despite some cognitive declines, many middle-aged and older adults hold highly skilled and influential positions. This suggests that real-world competence does not depend solely on raw cognitive ability.
Factors that help maintain high performance include:
Experience and wisdom gained over time.
Better problem-solving strategies developed through life.
Emotional intelligence, which often improves with age
Intellectual Disabilities and the Intellectually Gifted
The Least Restrictive Environment
Least Restrictive Environment
The setting most similar to that of children without special needs
Children are to be removed from the regular classroom only for those subjects specifically affected by their exceptionally; for all other subjects, they are to be taught in regular classrooms
Mainstreaming
An educational approach in which exceptional children are integrated as much as possible into the traditional educational system and are provided with a broad range of educational alternatives
The ultimate objective of mainstreaming was to ensure that all persons, regardless of ability or disability, had—to the greatest extent possible—opportunities to choose their goals on the basis of a full education, enabling them to obtain a fair share of life’s rewards
Full Inclusion
The integration of all students, even those with the most severe disabilities, into regular classes and all other aspects of school and community life
Below the Norm Intellectual Disability
Analyze the characteristics and effects of the intellectual disability
Intellectual Disability
A disability characterized by a significant limitations both in intellectual functioning and in adaptive behaviour, which covers many everyday social and practical skills
Most cases of intellectual disability are classified as familial intellectual disability, in which no cause is apparent, but there is a history of intellectual disability in the family. In other cases, there is a clear biological cause. The most common biological causes are fetal alcohol syndrome, which is produced by a mother’s use of alcohol while pregnant, and Down syndrome, which results from the presence of an extra chromosome. Birth compli- cations, such as a temporary lack of oxygen, may also produce intellectual disabilities
Mild Intellectual Disability
Intellectual disability in which IQ scores fall in the range of 50 or 55 to 70
Moderate Intellectual Disability
Intellectual disability in which IQ scores range from around 35 or 40 to 50 or 55
Severe Intellectual Disability
Intellectual disability in which IQ scores range from around 20 or 25 to 35 or 40
Profound Intellectual Disability
Intellectual disability in which IQ scores fall below 20 or 25
Above the Norm: The Gifted and Talented
Describe the characteristics and effects of giftedness
Understanding Gifted and Talented Students
Gifted and talented students, who make up about 3-5% of children, have unique needs, just like students with lower IQs. The federal government defines them as children who show high ability in areas like academics, creativity, leadership, or the arts and need special programs to reach their full potential. However, these programs are often cut when schools face budget issues
Are Gifted Students Socially Awkward?
There’s a common belief that gifted children are unsociable or poorly adjusted, but research shows the opposite. Studies suggest they are often outgoing, well-adjusted, and popular. A famous long-term study of 1,500 gifted students found that they were healthier, better coordinated, and more successful in life. By age 40, they had published books, plays, and scientific articles and even registered patents. They also reported being more satisfied with their lives.
However, being gifted doesn’t always mean school success. Some bright students struggle because their creativity and humor are misunderstood by teachers, or they try to hide their intelligence to fit in with peers
How Schools Support Gifted Students
There are two main ways schools help gifted students:
Acceleration – Students move ahead at their own pace, sometimes skipping grades. They learn the same material but at a faster rate.
Enrichment – Students stay in their grade but take special classes or do advanced activities to explore subjects in more depth and develop higher-level thinking skills
Textbook - Chapter 14 Pg. 467- 481
Schooling Throughout the lifespan
Early childhood education; Taking the pre out of the preschool period
Analyze the functions and types of preschool education in the US
The Variety of Early Education
Childcare centres
Family childcare centres
small operations run in private homes. Because centres in some areas are unlicensed, the quality of care can be uneven
Pre-schools
School childcare
Some local school systems fund prekindergarten programs fir 4 year olds
The Effectiveness if Childcare
How effective are such programs?
Research suggests that preschoolers enrolled in childcare centres show intellectual development that is often greater than their peers who do not attend such programs
Some studies find preschoolers in childcare are more verbally fluent, show memory and comprehension advantages and even achieve higher IQ scores
Early and long term participation in childcare is particularly helpful for children in impoverished home environments
Childcare programs can have positive consequences decades later
Example: in one well-designed study of Boston pre- schools, attendees were more likely to graduate from high school, take the SAT exams, and ultimately go to college compared to those who didn’t attend
Advantages in social development can also be observed, as children who participated in these programs tend to exhibit better interpersonal skills, higher self-esteem, and a greater ability to navigate social situations
The Quality of Childcare
How can we define “high quality”?
The care providers are well trained, preferably with bachelor’s degrees.
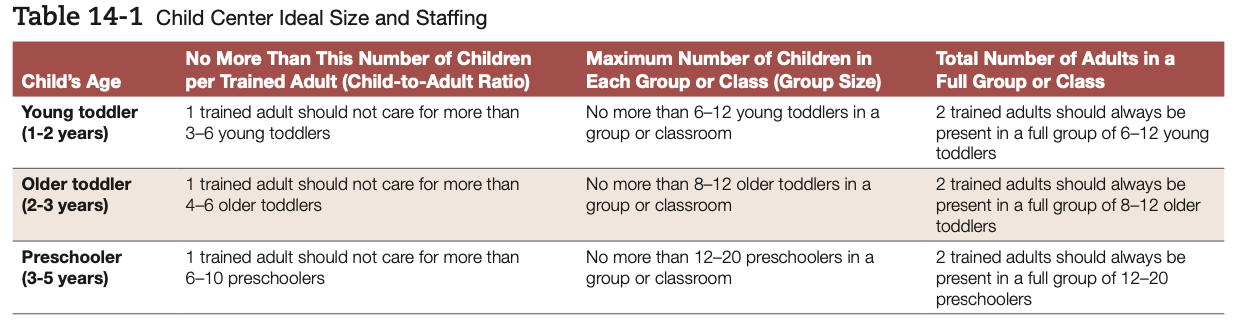
The childcare center has an appropriate overall size and ratio of care providers to children. The U.S. federal government recommends that classrooms be limited to 12 to 20 children, and there should be no more than 6 to 10 preschoolers (ages 3 to 5 years old) per caregiver, or seven to ten 4- or 5-year-olds per caregiver. Younger pre- schoolers should be in smaller groupings (see Table 14-1).
The curriculum of a childcare facility is not left to chance but is carefully planned out and coordinated among the teachers.
The language environment is rich, with a great deal of conversation.
The caregivers are sensitive to children’s emotional and social needs, and they know when and when not to intervene.
Materials and activities are age appropriate.
Basic health and safety standards are followed.
Children should be screened for vision, hearing, and health problems.
At least one meal a day should be available.
The facility should provide at least one family support service.
From Kindergarten to High School: Preparing Students for Success
Explain how US students generally progress from kindergarten through high school
Creating an atmosphere that promotes school success
What makes children succeed in school?
Promote a “literacy environment.” Parents should read to their children and famil- iarize them with books and reading. Adults should provide reading models so that children see that reading is an important activity in the lives of the adults with whom they interact. (Also see From Research to Practice.)
Talk to children. Discuss events in the news, talk about their friends, and share hob- bies. Getting children to think about and discuss the world around them is one of the best preparations for school.
Provide a place for children to work. This can be a desk, a corner of a table, or an area of a room. What’s important is that it be a separate, designated area.
Encourage children’s problem-solving skills. To solve a problem, children should learn to identify their goal, what they know, and what they don’t know; to design and carry out a strategy; and finally to evaluate their result
Homeschooling: Living rooms as classrooms
Parents choose homeschooling for various reasons, including personalized attention, dissatisfaction with public schools, or religious beliefs.
Research shows homeschooled children perform as well as traditionally schooled students on standardized tests and college admissions.
However, academic success in homeschooling may be due to family affluence and structure rather than homeschooling itself.
Critics argue homeschooling limits social interaction, diversity exposure, and access to advanced science and technology resources.
Most parents lack formal teacher training, which may impact instruction quality, especially in subjects their children struggle with.
Since homeschooling is relatively new, more research is needed to assess its effectiveness
In Transition: Making the move from elementary to secondary school
The transition from elementary to secondary school is a common but challenging experience due to physical, intellectual, and social changes.
Most students enter middle school (grades 6–8) while also experiencing puberty and evolving social relationships.
Middle school differs from elementary school in structure, requiring students to switch classes and adapt to different teachers and classmates.
Students go from being the oldest in elementary school to the youngest in middle school, which can feel intimidating and lower their social status.
Middle schools are usually larger than elementary schools, making the transition harder. Research suggests that smaller schools provide better academic and psychological support
School Performance in Adolescence
High school grades have increased over the past decades, with the average GPA rising from 3.27 to 3.38 between 1998 and 2016.
However, standardized test scores (SAT, ACT, NAEP) have not improved, suggesting that grade inflation, rather than actual academic progress, may be responsible for the higher grades.
Grade inflation can lead to complacency among students and may result in unprepared students advancing to college, where they struggle academically.
U.S. students perform below average in math and science compared to students in other industrialized countries, partly due to less classroom time and less intensive instruction.
The diverse and economically varied U.S. student population may also contribute to differences in academic performance compared to more homogeneous and affluent countries.
The U.S. high school graduation rate is 86%, ranking ninth among industrialized nations, a decline from its previous leading position.
Ethnic and Racial Differences in School Achievement
Achievement Gaps by Race/Ethnicity:
Black and Hispanic students, on average, perform lower than white students in grades and standardized test scores.
Asian American students tend to outperform white students academically.
The COVID-19 pandemic exacerbated achievement gaps, as minority and low-income students faced challenges like poor internet access, lack of study space, and additional family responsibilities.
Ogbu’s Theory of Involuntary vs. Voluntary Immigration:
Ethnic minorities who voluntarily immigrate tend to succeed more in school than those who were forced into a new culture.
Example: Korean immigrant children in the U.S. perform well, whereas descendants of Korean forced laborers in Japan struggle academically.
This theory suggests that the history of involuntary immigration, such as the forced enslavement of Black ancestors, may contribute to lower academic motivation among Black students.
High School Dropout Rates:
About 500,000 students drop out of high school each year.
Dropouts earn 20% less than high school graduates.
Reasons for dropping out include pregnancy, language barriers, financial strain, and academic or social disengagement.
Males are more likely to drop out than females.
Dropout rates have declined over the past two decades, particularly for Hispanic students.
Poverty is a key factor—students from low-income families are three times more likely to drop out than those from middle- and upper-income households.
Dropping out can perpetuate cycles of poverty, limiting economic opportunities.
Beyond High School: The Pursuit of Higher Education and Lifelong learning
Describe the nature of the US population
Who Goes to College?
Enrollment Statistics
43% of high school graduates enroll in a 4-year college immediately.
20% enroll in a 2-year institution.
College attendance by race (total enrollment rates):
Asian: 58%
White: 42%
Hispanic: 39%
Black: 36%
Pacific Islander: 21%
American Indian/Alaska Native: 19%
Two or more races: 42%
Graduation & Dropout Rates
Only 40% of college students graduate within 4 years.
About half of those who do not finish in 4 years eventually complete their degree.
The Black student dropout rate is 54% (measured over 6 years).
The Economic Impact of College Education
Higher education = lower poverty rates
Only 5% of college graduates live below the poverty line.
24.5% of high school dropouts live below the poverty line.
Racial Wealth Gap
College has not closed the Black-White wealth gap.
Black college graduates’ net worth has declined over 30 years to less than 1/10th of White households.
Student debt disparity:
84% of Black college graduates have student debt in their 30s.
53% of White college graduates have student debt.
Gender Stereotypes in Education
Course Enrollment Differences
More women in education & social sciences.
More men in STEM (science, technology, engineering, math).
Faculty Representation
Women are underrepresented in faculty, especially in prestigious institutions and STEM.
Classroom Bias
Professors tend to call on men more often and make more eye contact with them.
Male students often receive more positive reinforcement and extra help.
Confidence Gap
Men overestimate their academic abilities.
Women underestimate their academic abilities.
Single-Sex Education Benefits
Higher participation & success in sciences for women in all-female colleges.
More female professors = role models.
The Changing College Student
Older Students & Lifelong Learning
40% of university students are older than 24.
Community college average age: 28 (43% are aged 25-29, 10% are 40+).
Reasons for Older Adult Enrollment
Job advancement & skill updates.
Understanding aging & societal changes.
Preparation for retirement & lifelong learning.
Programs for Older Adults
Road Scholar: Educational programs for seniors, encouraging intellectual growth.
Many public colleges offer free tuition for seniors.
Who Goes to College?
College Enrollment Trends
43% of high school graduates enroll in a 4-year college immediately after graduation.
20% enroll in a 2-year institution (community college or technical school).
The remaining students may enter the workforce, join the military, or pursue other paths.
College Attendance by Race
Asian: 58%
White: 42%
Hispanic: 39%
Black: 36%
Pacific Islander: 21%
American Indian/Alaska Native: 19%
Two or more races: 42%
💡 Analysis:
Asian students have the highest college enrollment rate.
Indigenous and Pacific Islander students have the lowest rates, possibly due to financial barriers, lack of educational resources, or cultural factors.
Graduation & Dropout Rates
Only 40% of students graduate within 4 years.
Many students take 5-6 years to complete their degrees.
Dropout rates vary by race:
54% of Black students drop out within 6 years.
Reasons for dropouts include financial struggles, family obligations, lack of academic preparation, or mental health challenges.
Who is More Likely to Drop Out?
Students from low-income families (financial strain).
First-generation college students (lack of guidance).
Students attending part-time (balancing work & school).
The Economic Impact of College Education
College Degree & Poverty Rates
Only 5% of college graduates live below the poverty line.
24.5% of high school dropouts live in poverty.
💡 Key Insight: A college degree significantly reduces the risk of poverty, but this benefit is not equal across racial groups.
The Racial Wealth Gap & Student Debt
College education has NOT closed the racial wealth gap.
Black college graduates' net worth has declined over the last 30 years.
Today, Black households have less than 1/10th the wealth of White households.
Even with a degree, Black families struggle with wealth accumulation.
Student Loan Debt Disparities
84% of Black college graduates still have student debt in their 30s.
53% of White college graduates still have debt by this age.
💡 Why the Disparity?
Black students take out more loans because their families often have less generational wealth.
Job market discrimination makes it harder for Black graduates to pay off debt quickly.
Gender Stereotypes in Education
Gender Differences in Course Enrollment
Men dominate STEM fields (science, technology, engineering, math).
Women are more likely to enroll in:
Education
Social sciences
Health sciences
Computer science & engineering:
Only 18% of computer science degrees go to women.
Women in STEM often face bias and lack mentorship
Gender Bias in College Classrooms
Professors tend to:
Call on male students more often.
Make more eye contact with men.
Give more positive reinforcement to male students.
Women are more likely to:
Underestimate their abilities.
Receive less encouragement in STEM fields.
Example:
In math and science courses, men overestimate their skills, while women doubt themselves even when they perform well
Single-Sex Education & Gender Performance
All-female colleges have been shown to:
Improve female participation in STEM.
Increase confidence in math & science.
Offer more female professors as role models
The Changing College Student
Older Adults in College
40% of college students are older than 24.
Community college students:
Average age: 28
43% are aged 25-29
10% are aged 40+
Why Are More Older Adults Enrolling?
Career changes: Many want to switch industries.
Job market competitiveness: Advanced degrees help secure better jobs.
Personal growth: Many seek education for personal enrichment.
Programs for Older Adults
Road Scholar:
Provides travel & educational experiences for older adults.
Focuses on lifelong learning.
Public Colleges & Free Tuition for Seniors:
Many states offer free or reduced tuition for students over 60.