Hearing
Sound
What is sound?
Sound is the variation of pressure in the air through time
A simple sound (tone) is a periodic variation of pressure (at a given point) in time
Your ear ‘feels’ the periodic change of air pressure, and hears the sound
Sound Characteristics
A simple sound (tone) is a periodic variation of pressure (at a given point) in time
Note: pressure is n
The frequency F is the number of periods per second
measured in Hertz (Hz)
The higher the frequency the higher the perceived pitch
The amplitude A is the ‘height’ of the wave
the higher the amplitude, the louder the sound
Summarizing
Sound is the periodic variation of air pressure at a certain point in space
The frequency of a sound (in units of Hz) measure the rate of repetition of the sound wave
The higher the frequency, the higher the pitch of the sound
The amplitude of a sound measures the amount of variation of pressure in one period
For a given frequency, the higher the amplitude of the sound, the louder the sound
Sound Pressure Level (SPL)
The Sound Pressure Level (SPL) is an alternative measure of the intensity of sound
we already know that the amplitude A measures the sound intensity
the SPL measures intensity on a different scale (logarithmic):
SPL = 20 log10(A/A0)
where A0 is a constant (A0 = 20 muPa)
The SPL is measured in deciBels (dB)
SPL correlates more naturally than amplitude to the human perception of loudness
SPL = 20 log10(A/A0)
Remember that log10(1) = 0
Hence the SPL of a sound is equal to 0 dB when its amplitude A is equal to A0
If A = A0: log10 (A/A0) = log10-(A0/A0) = log10 (1) = 0
Important: 0 dB does not mean “no sound” !
a sound w/ SPL of 0 dB has amplitude A equal to A0
A sound with amplitude A less than A0 has negative SPL (e.g. - 10dB)
hence, we can have sounds w/ negative SPL
even though there are no sounds w/ negative amplitude A!
The value A0 is chosen to be the amplitude of a sound that is barely audible at 1000 Hz
Logarithm - Review
Summarizing
The Sound Pressure Level (SPL) is an alternative measure of the sound intensity
it is chosen because it correlates better than the amplitude to our sensation of “loudness”
given the amplitude of a sound, the SPL is equal to: SPL = 20 log10(A/A0), where A0 is a constant value
if the amplitude A of the sound is equal to A0, the SPL of the sound is 0 dB
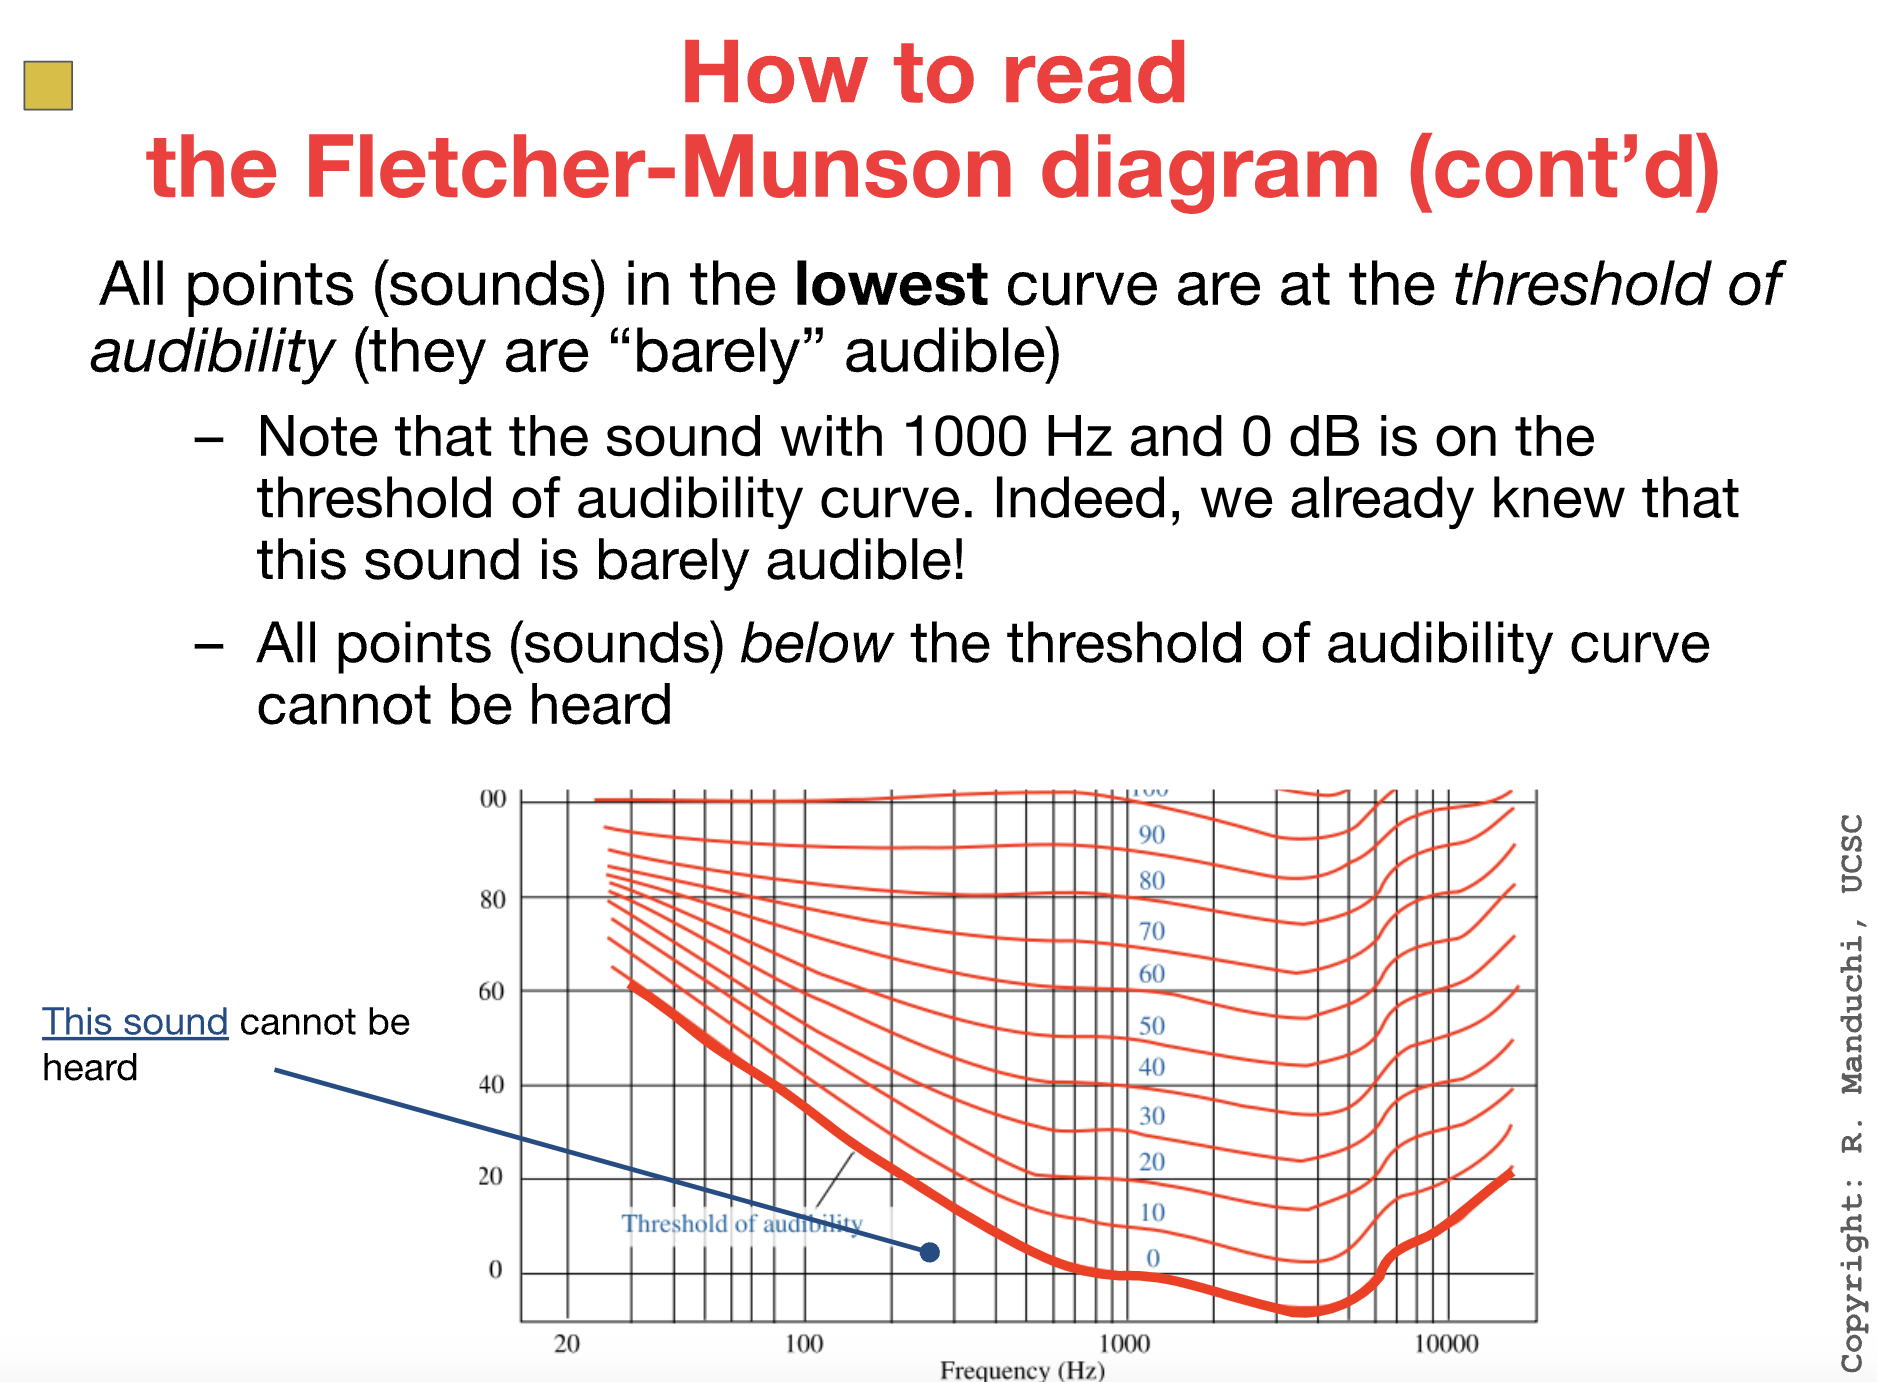
a sound w/ frequency of 1000 Hz and SPL of 0 dB is barely audible
if the amplitude A is larger than A0, the SPL is > 0 dB
if the amplitude A is smaller than A0, the SPL is < 0 dB
Audiometry
SPL vs. Loudness
SPL is an objective measure of the intensity of a sound
we can measure it w/ a sound level meter
Loudness is a subjective measure
It represents the subjective perception of how loud a sound is
SPL is a measure of the amplitude of a sound
It does not depend on its frequency!
Loudness is a subjective measure of how loud we perceive a sound
Important: Loudness depends on both SPL and frequency
Important concepts:
Two sounds w/ the same frequency and different SPL:
The sound w/ higher SPL always sounds louder than the sound w/ lower SPL
Two sounds w/ different frequencies and same SPL:
They may be perceived w/ different loudness
Fletcher-Munson Diagram
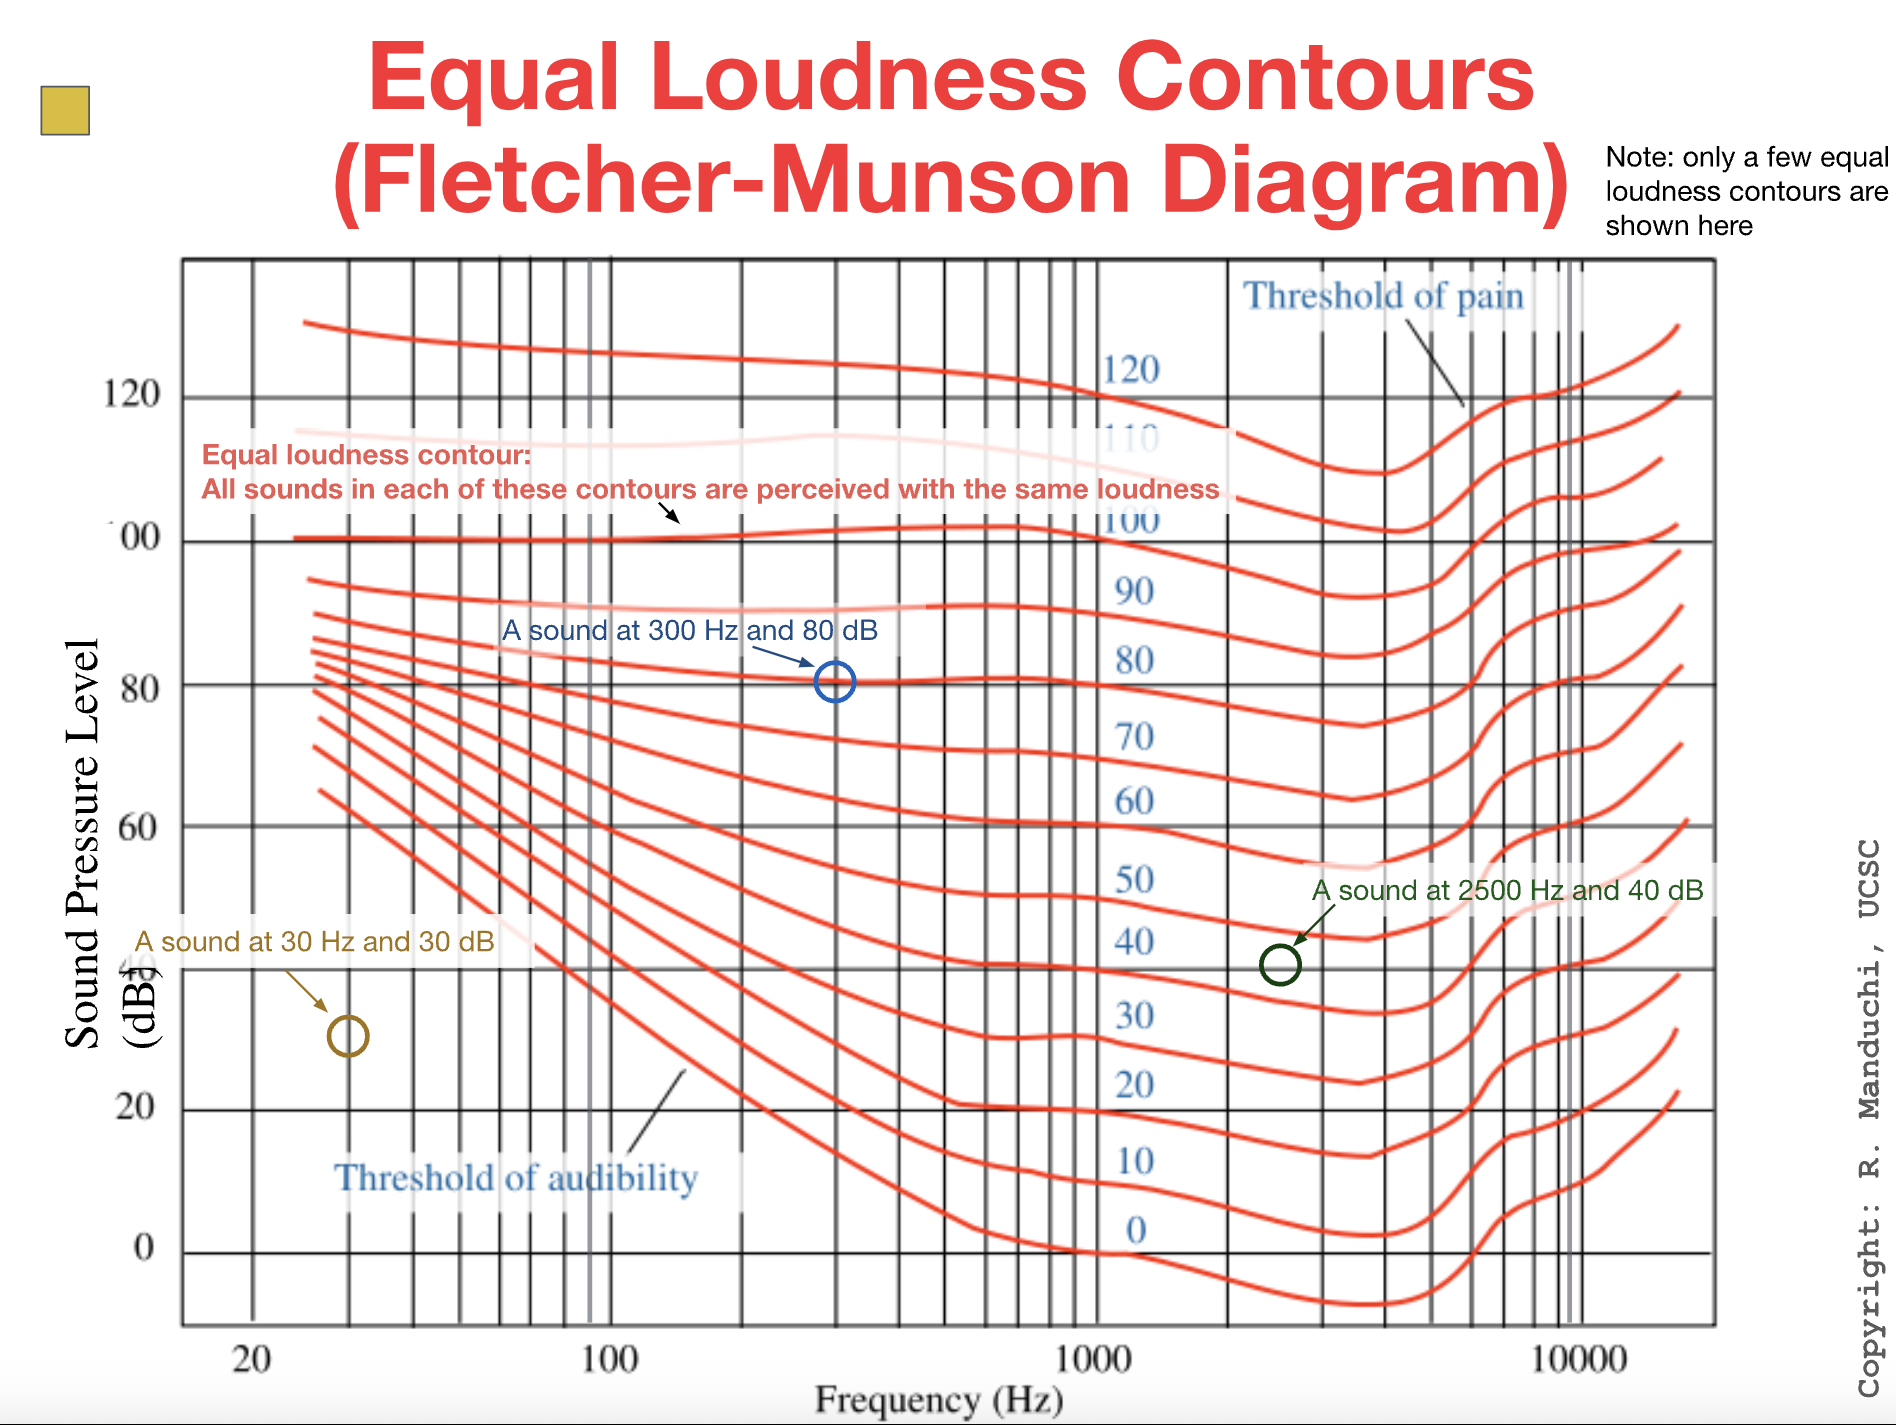
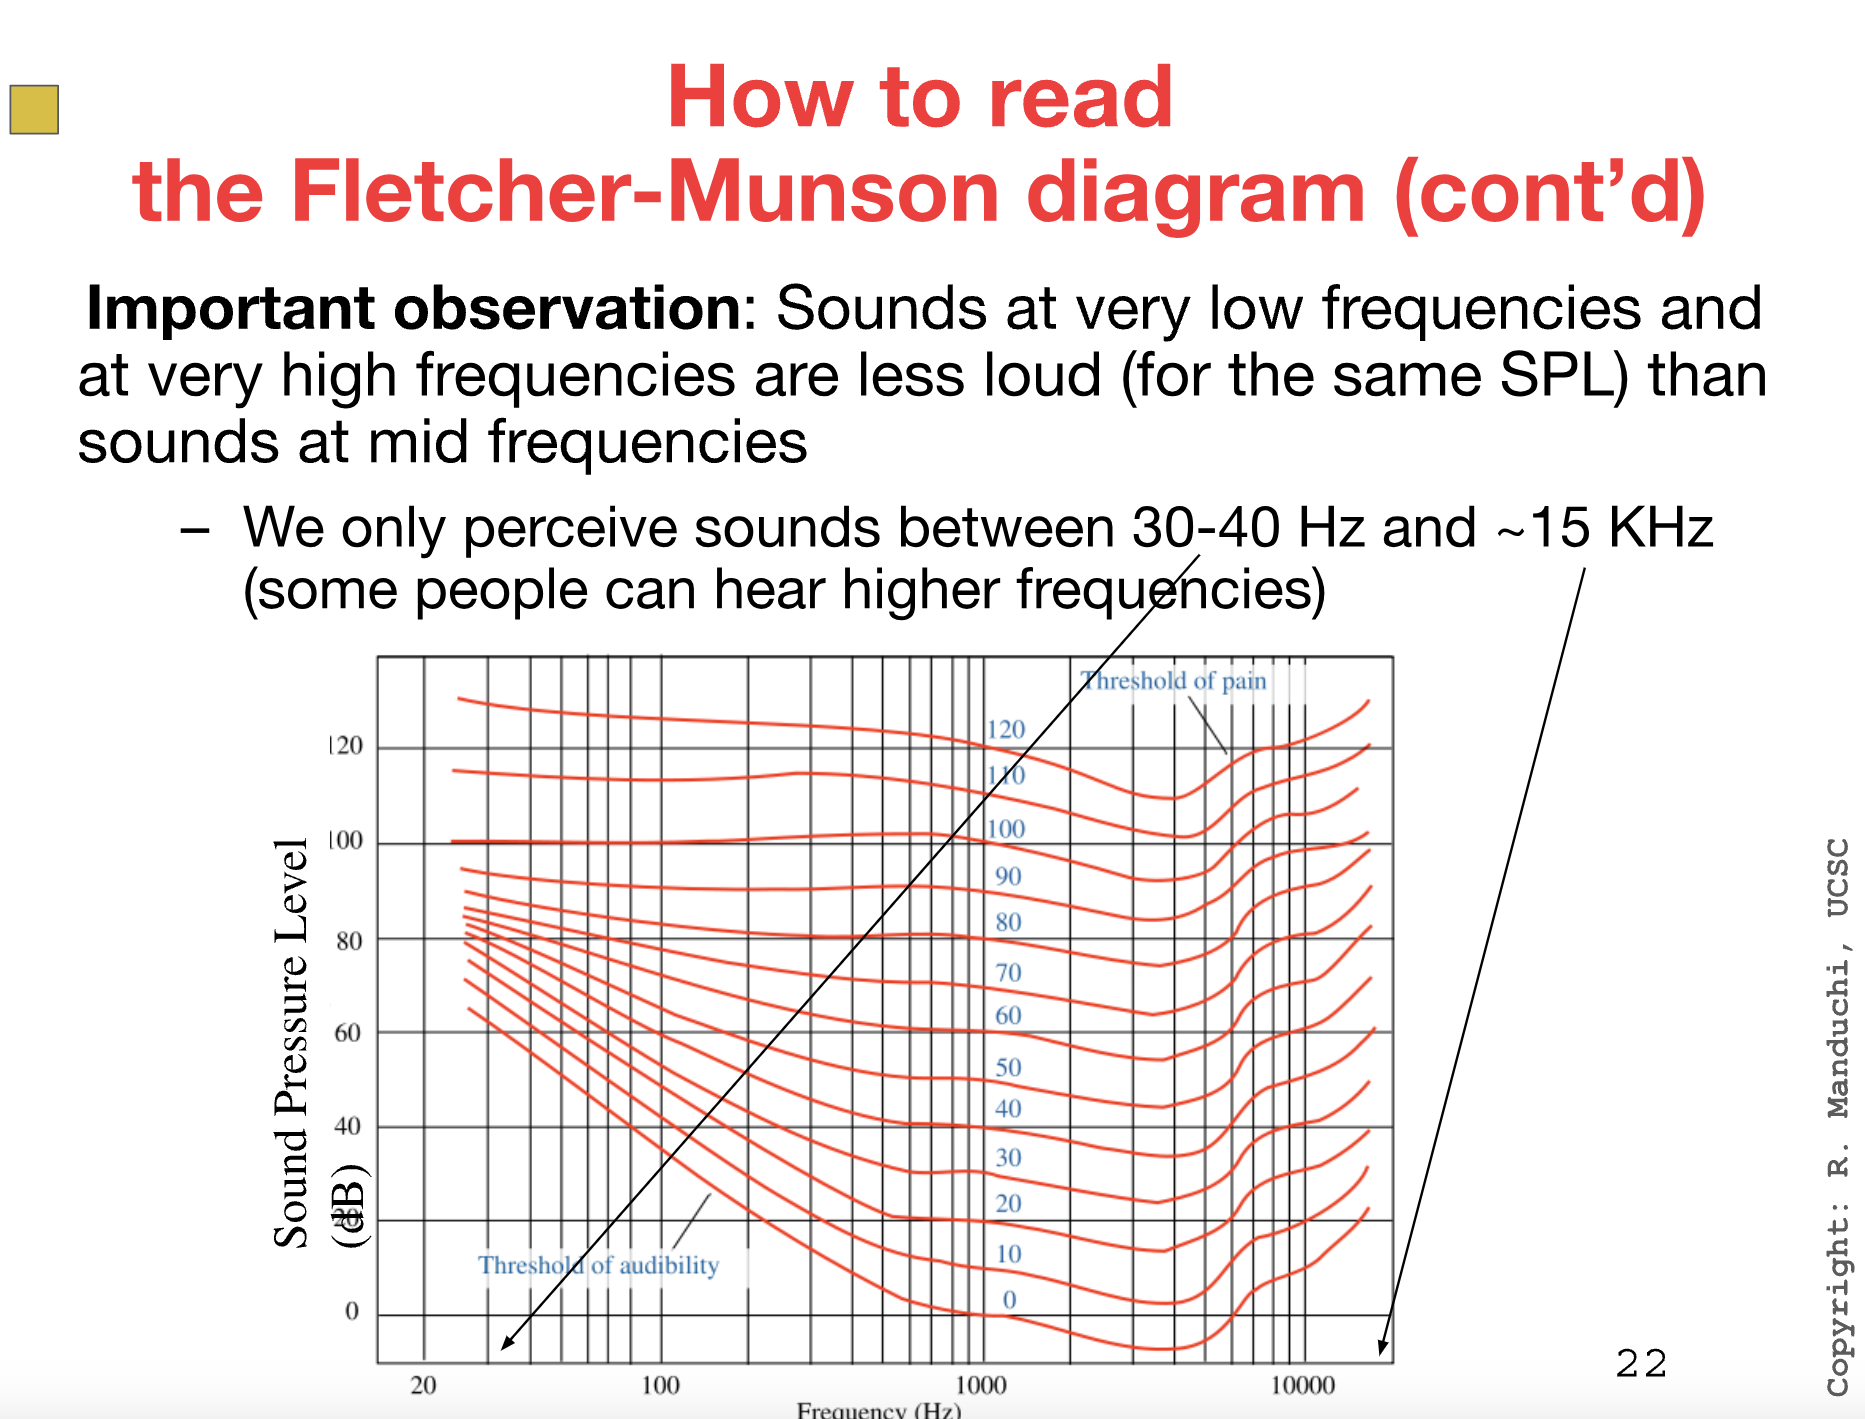
A Fletcher-Munson (F-M) diagram represents the sets of sounds w/ equal loudness
An equal loudness contour in a F-M diagram represents all of the sounds w/ the same loudness
Remember:
A sound is characterized by its frequency and SPL
The loudness of a sound depends on both its frequency and SPL
Important: Two equally loud sounds at different frequencies
may have different SPL
Hence, a F-M equal loudness contour is made w/ sounds w/ different frequencies and different SPL but perceived w/ the same loudness
The F-M contour are built from acoustic tests
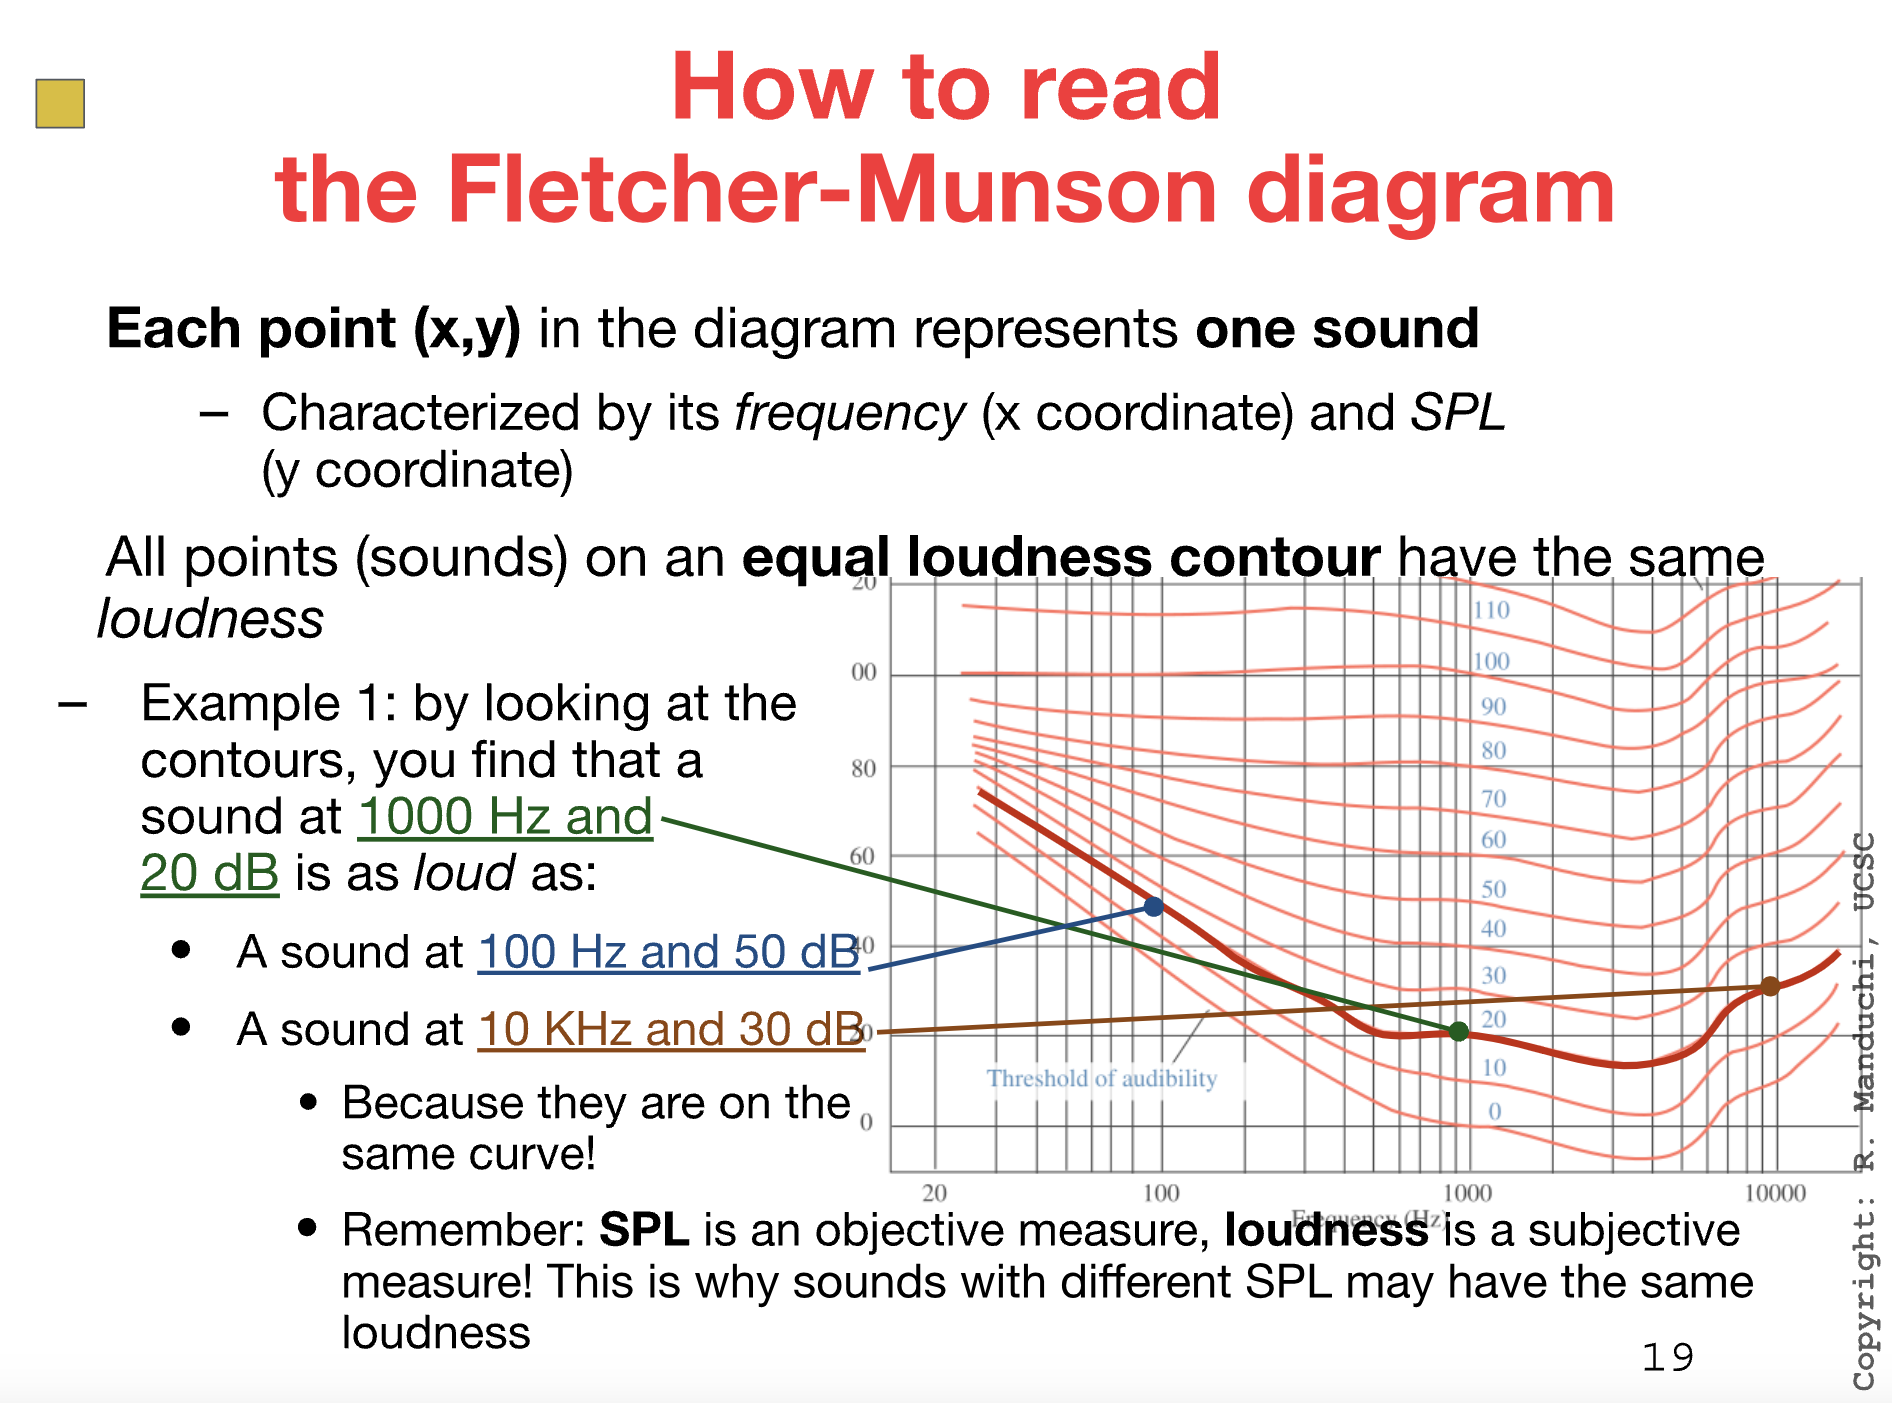
How to read the Fletcher-Munson diagram
each point (x,y) in the diagram represents one sound
characterized by its frequency(x-coordinate) and SPL (y-coordinate)
all points (sounds) on an equal loudness contour have the same loudness
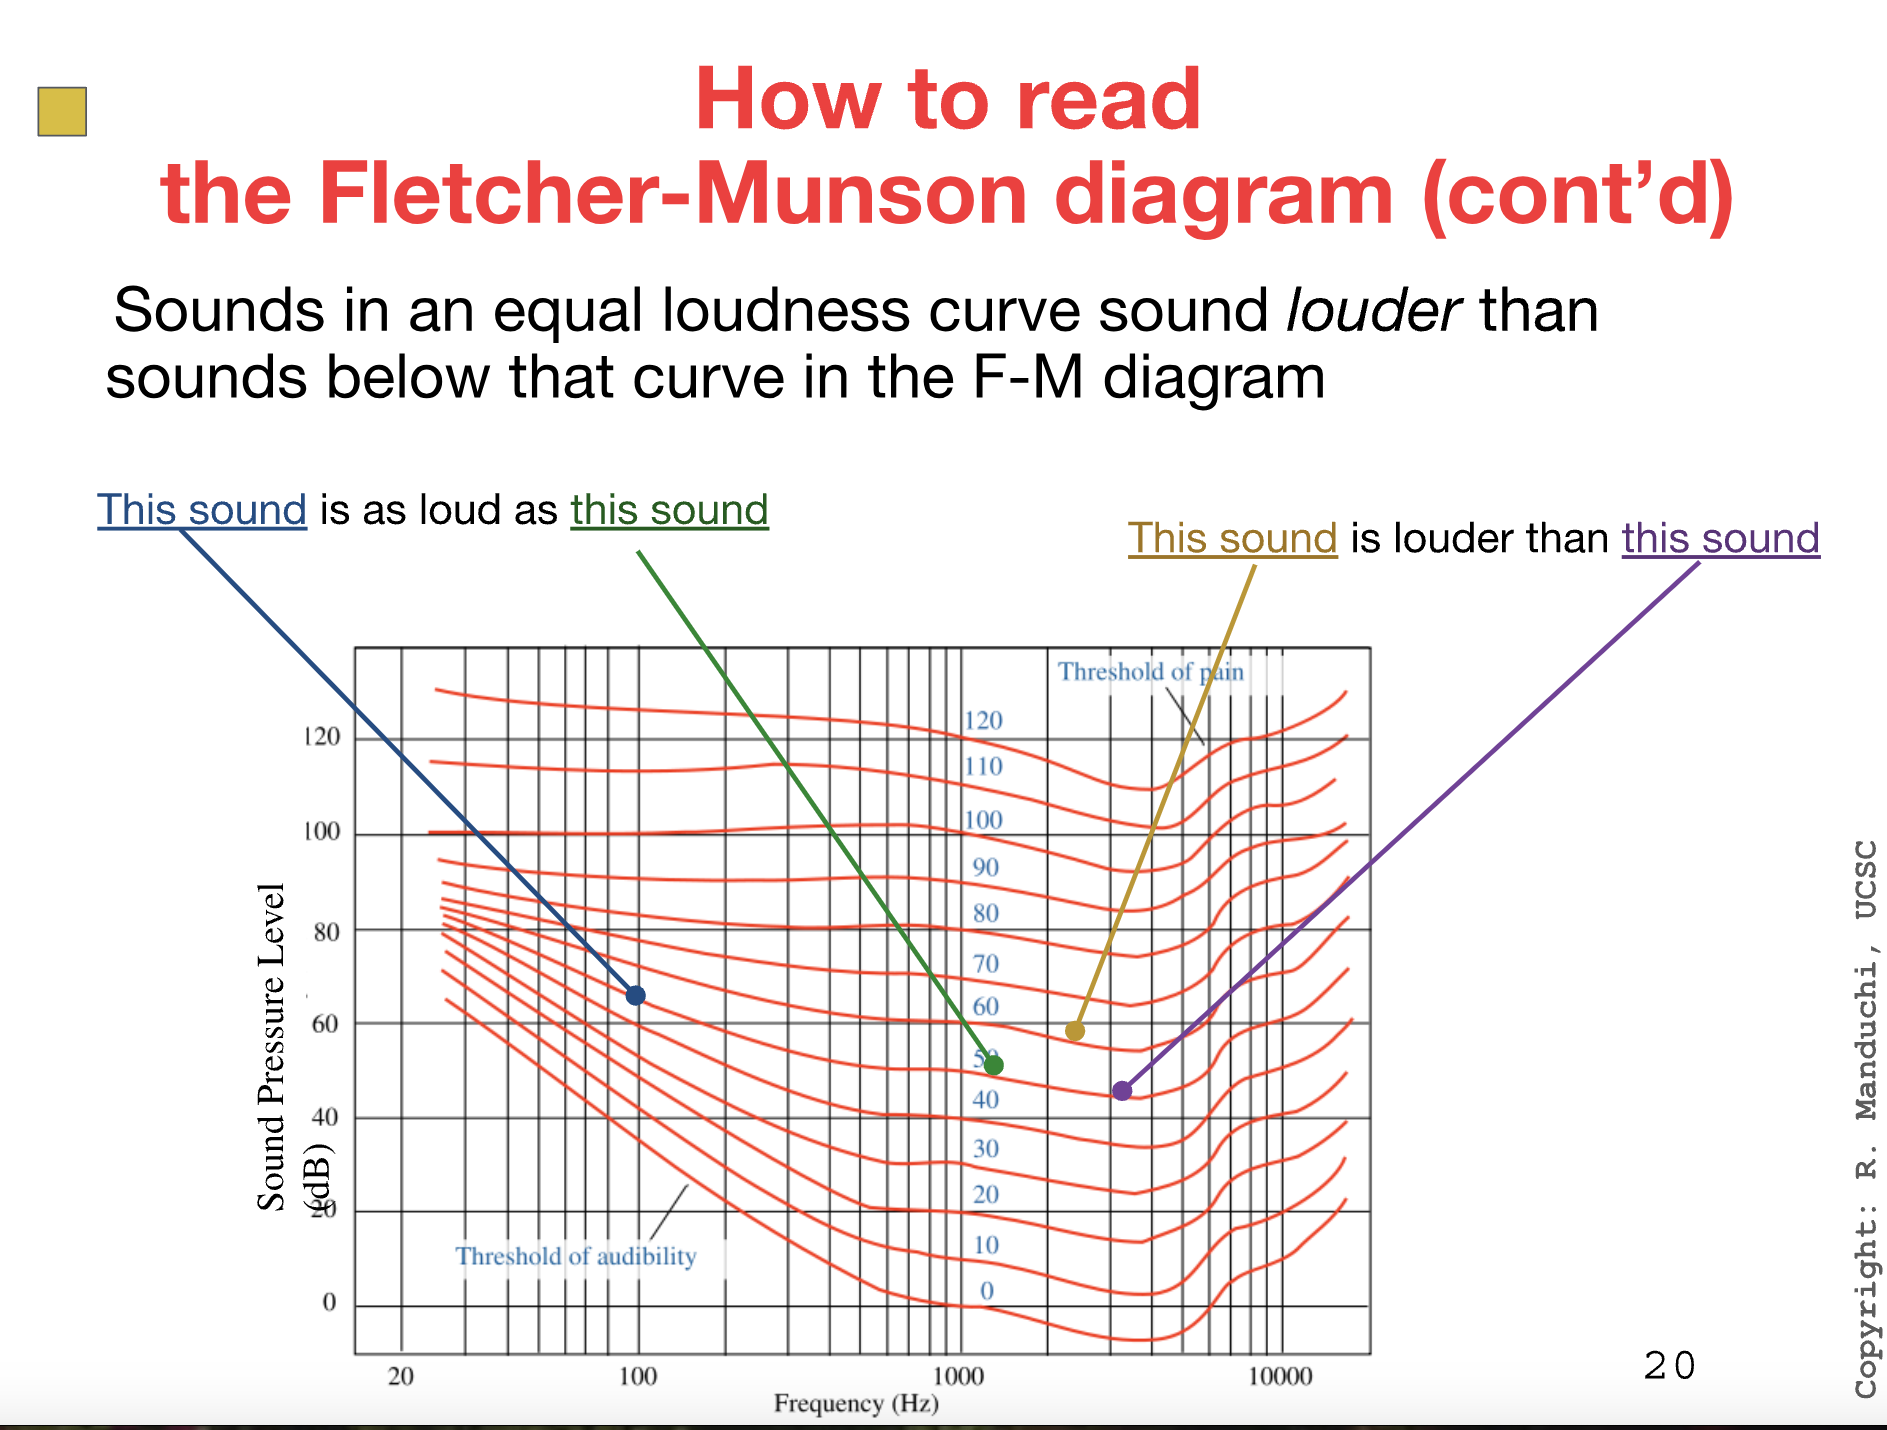
Sounds in an equal loudness curve sound louder than sounds below that curve F-M diagram
Hearing Loss
Intuitively: a person has some degree of hearing loss if, in order to hear a certain sound this person needs a higher SPL than a ‘normally hearing’ person
More formally: a person has a hearing loss if their threshold of audibility is higher than that of a normally hearing person
But we know that the threshold of audibility is actually a curve: it depends on the frequency of the sound
so, in order to quantify the degree of hearing loss of a person, we need to find (through audiometric tests) if and how their threshold of audibility curve has changed
Audiograms
An audiogram shows one’s hearing loss across frequencies
I.e. the difference between the threshold of audibility of a person being tested, and the threshold of a
It is not the same as the audibility threshold curve! a positive value of the audiogram for a certain frequency represents one’s hearing loss at that frequency
hence a normally hearing person has an audiogram that is all close to 0
Degrees of Hearing Loss
A simple (but incomplete) way to characterize one’s hearing loss is to look at their hearing loss at 1000 Hz:
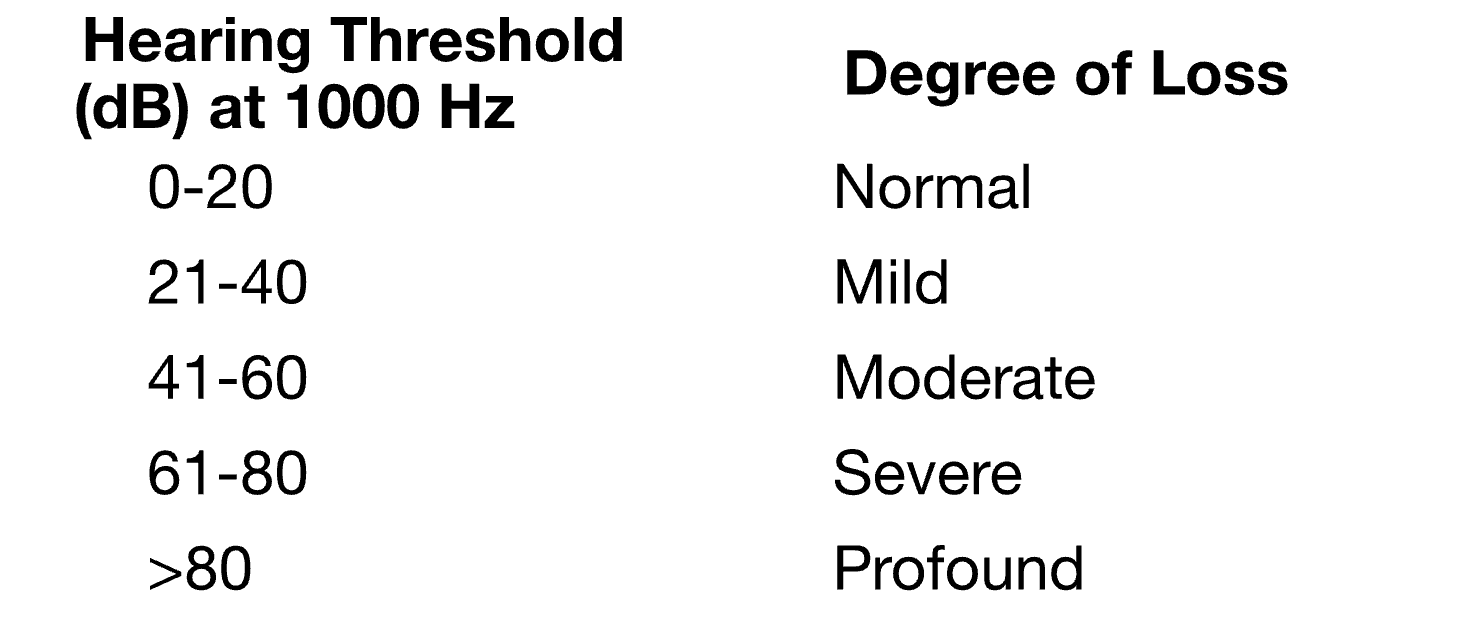
At 35 dB of hearing loss, one generally benefits from hearing aids
The Human Hearing System
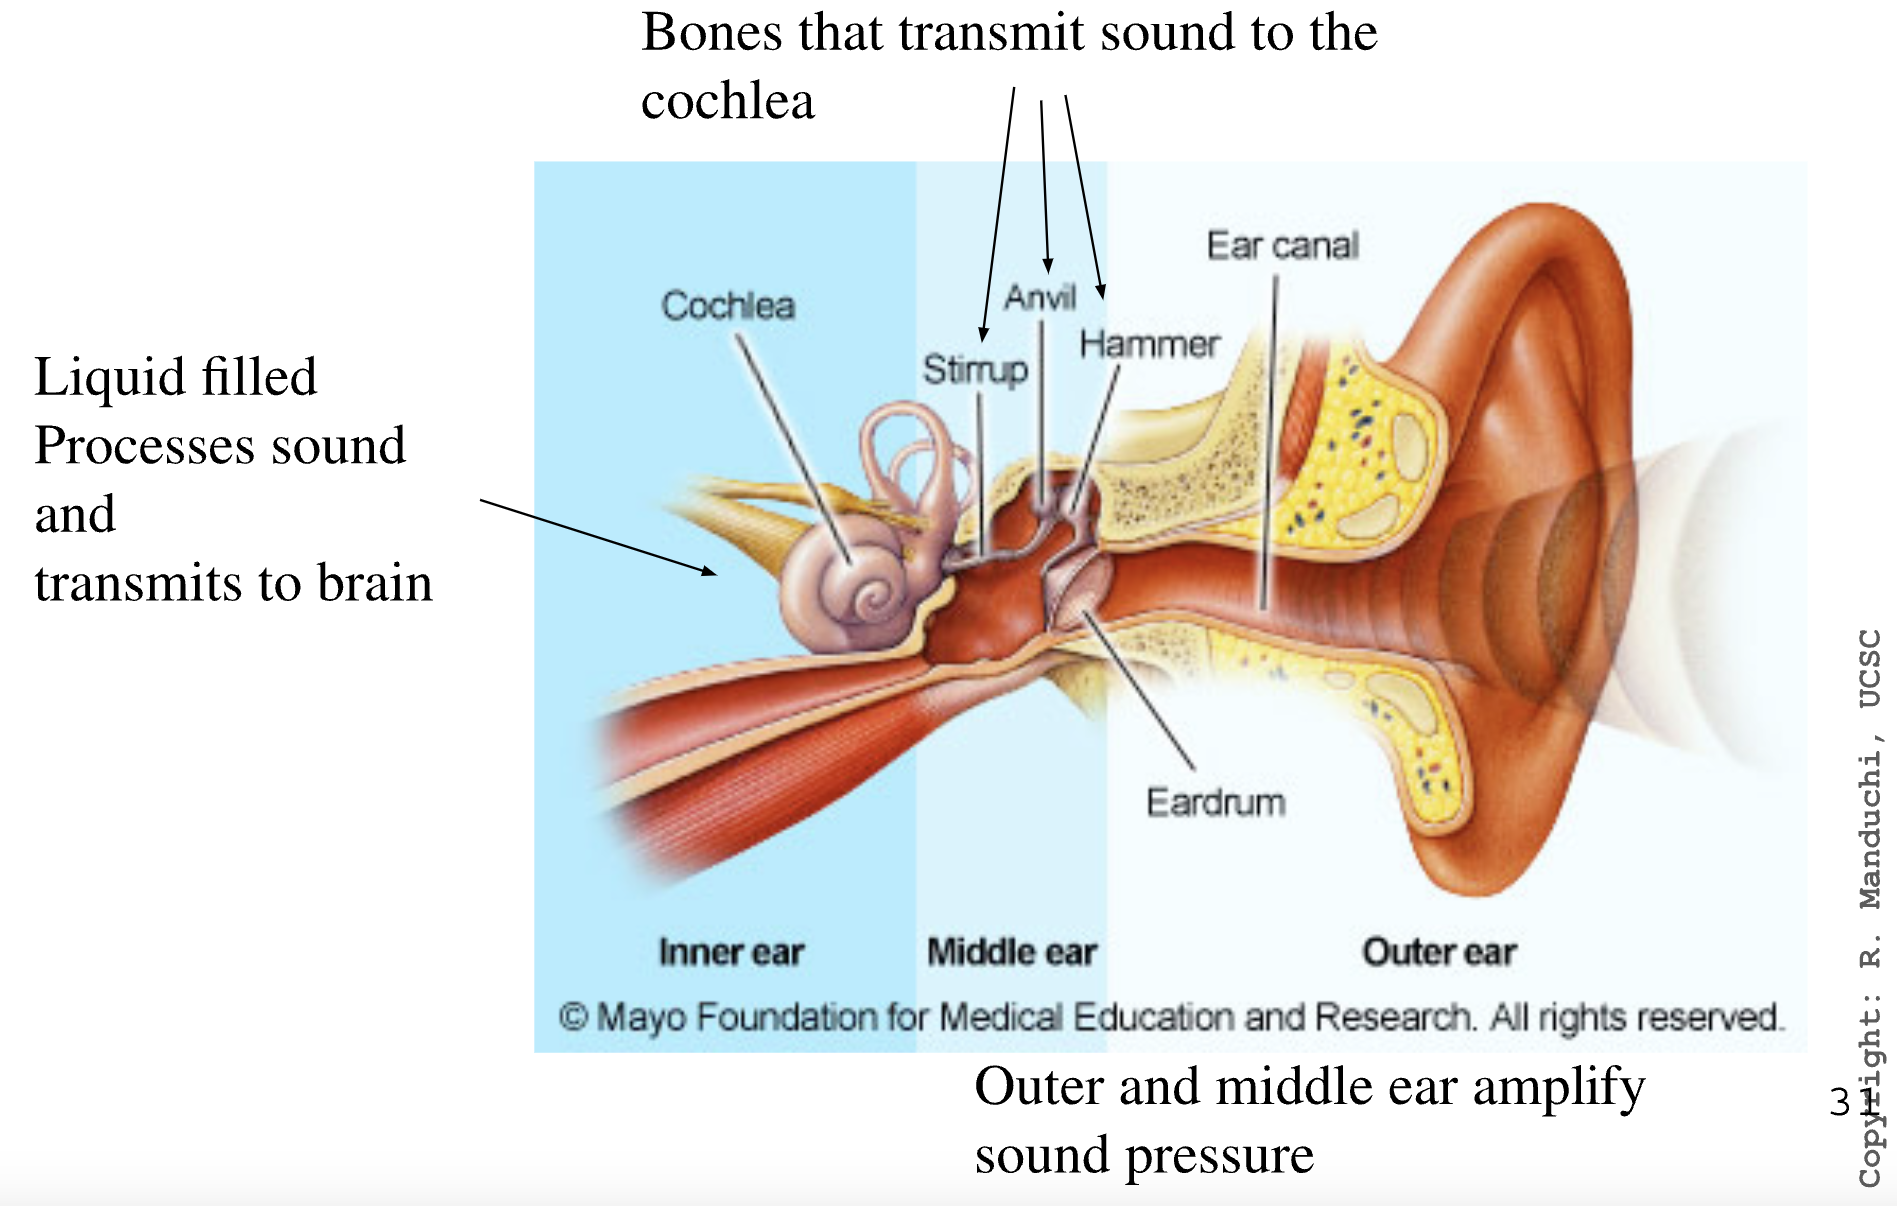
Ear anatomy
ear canal (outer ear)
ear drum (middle ear)
hammer (middle ear)
anvil (middle ear)
stirrup (middle ear)
cochlea (inner ear)
Tonotopy
the sound waves resonate at different points in the basilar membrane (tonotopic relationship)
The location of maximum resonance depends on the frequency of the sound
High frequencies: clsoe to the oval window (entrance of the cochlea)
low frequencies: closer to the apex
Causes of Hearing Loss
Deafness
30 mil in US aged 12 or older have bilateral hearing loss of 25 dB or more
48 mil in US have hearing loss in at least one ear
Proportion of U.S. ppl w/ loss of 35 dB or more in better ear
45 - 54 yrs : 2%
55 - 64 yrs : 8.5%
65 - 74 yrs : 25
>65 ys: 50%
Abt 1.4 in 1000 children 8 yrs of age in the U.S. have bilateral hearing loss of 40 dB or more
Hearing Loss
Two types of hearing loss
Conductive hearing loss
mechanical deficit in bringing vibrations to inner hear
sensory-neural hearing loss
problem converting sound to electrical signal that travels to the brain
Causes of Hearing Loss
Excessive noise, due to:
Occupation
e.g. factory noise, pneumatic hammer
recreation
e.g. shooting tange, hunting
noise exposure
e.g. loud music in concerts/clubs
most damaging noise: impulsive
e.g. gunshot
Presbycusis
Gradual loss of hearing as we get older
Due to loss of hair cells
Especially near the oval window (high frequencies)
if you cannot hear high frequencies, you cannot hear consonants (which contain a lot of high frequencies)
The hardest to tell apart are f, s, and th
inability to hear consonants leads to poor speech discrimination
Ear infection (Otitis)
if chronic, could cause long-term damage
Meningitis
deafness caused by disease or by antibiotics
3.2% of deaf and hard of hearing youth in the U.S. lost their hearing due to meningitis
Usher Syndrome
Affects both hearing and vision (causes retinitis pigmentosa)
prevalence in U.S.: 1/23,000
Conductive hearing loss
damage to eardrum or earbones (usually corrected by surgery)
wax or fluid in the middle ear
Autoimmune diseases
e.g. rheumatoid arthritis, lupus
Tinnitus (rining in the ear)
often accompanies hearing loss
Audiotry neuropathy
sound enter inner ear normally but transmission from inner ear to brain is impaired
may involve damage to hairy cells or faulty connection between hairy cells and audiotry nerve
When loss is progressive in only one ear, it may be due to causses beyond the inner ear
acoustic nerve or auditory part of the brain (e.g. stroke or truamatic brain injury)