Transport in cells
For an organism to function, substances must move into and out of cells. Three processes contribute to this movement – diffusion, osmosis and active transport.
Diffusion
Particles (molecules and ions) in a liquid and a gas move continuously. Because of this movement, particles will spread themselves evenly throughout a liquid or a gas.
If there is a situation where particles of a substance are in a higher concentration, they will move from this region to where they are in a lower concentration. This is called diffusion.
It is important to remember that the particles:
- will move in both directions, but there will be a net movement from high to low concentration
- will end up evenly spread throughout the liquid or gas, but will continue to move
Some examples of diffusion in biological systems
Some substances move into and out of living cells by diffusion.
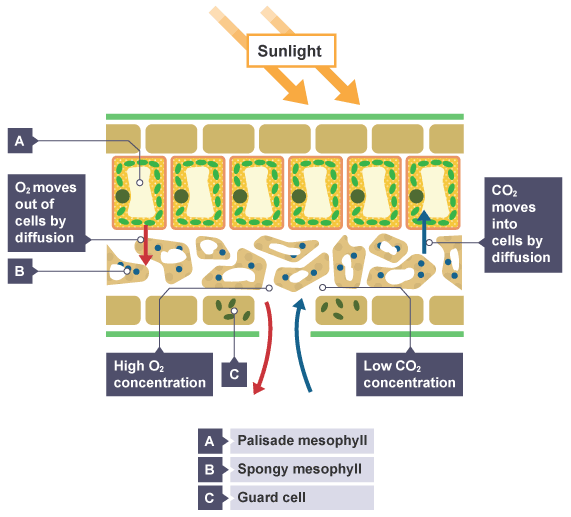
In a leaf
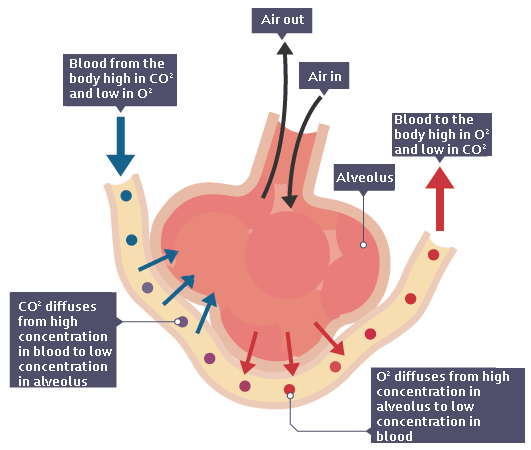
In the lungs
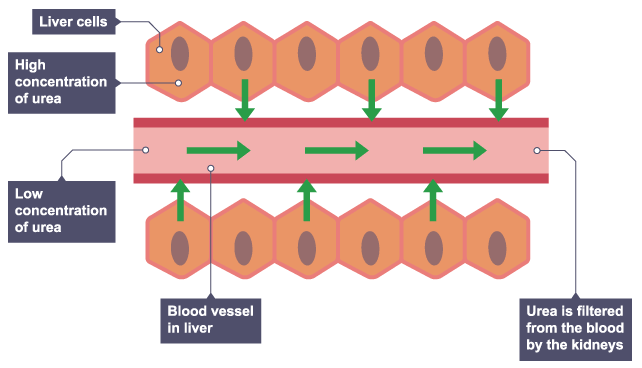
Liver cells
Mixing particles
If a crystal of a coloured chemical, eg potassium manganate (VII), is placed in water, the particles spread out and mix with the water particles.
- The potassium manganate (VII) is the solute.
- The water is the solvent.
- The potassium manganate (VII) has dissolved.
- The mixture that results is the solution.
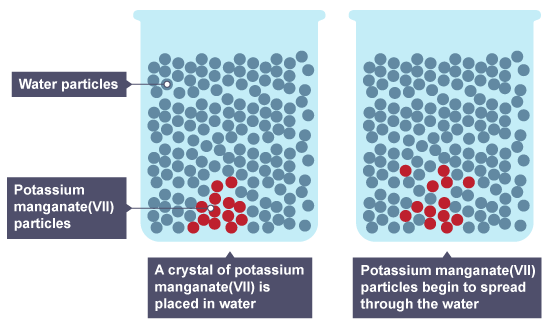
The particles have moved from a region of high concentration in the crystal to a low concentration in the water. This difference in concentration is called a concentration gradient. Particles will move down a concentration gradient, from a high concentration to a low concentration.
As well as diffusion occurring between different regions, it also occurs across membranes, between the outside and inside of cells.
The rate of diffusion
The rate of diffusion can be affected by a number of factors:
| Factor | Reason |
|---|---|
| The concentration gradient | The greater the difference in concentration, the quicker the rate of diffusion. |
| The temperature | The higher the temperature, the more kinetic energy the particles will have, so they will move and mix more quickly. |
| The surface area of the cell membrane separating the different regions | The greater the surface area, the faster the rate of diffusion. |
Diffusion, surface area and volume
For a bacterium, substances diffuse into and out of the bacterial cell across its surface. Once inside, because of the bacterium's size, substances will need to diffuse 1 μm or less to where they are needed, for instance for respiration.
For simple multicellular organisms, such as small plants like mosses, substances diffuse into the leaves and roots over their surface. Again, once inside the plant, they don’t need to move far.
Substances move into and around the moss plants by diffusion and osmosis.
Simple organisms take in substances over their body surface. Their needs are determined by their volume. As organisms increase in size, their surface area does not increase at the same rate as their volume. For example, the surface area to volume ratio of a puppy is several times greater than that of an adult dog.
Cell models
Cells can be modelled using cubes.
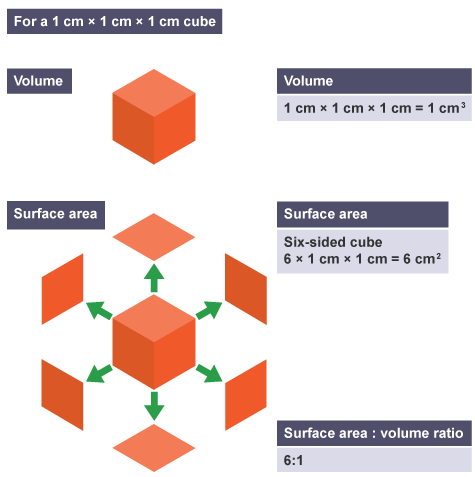
We can investigate the effect of increasing size on surface area to volume ratios using models based on cubes:
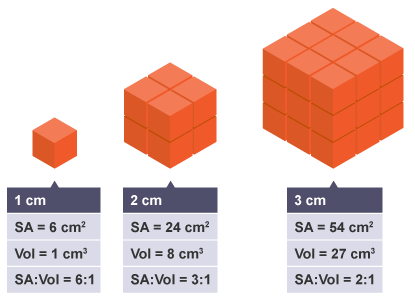
So, as the volume increases, the surface area does not increase at the same rate.
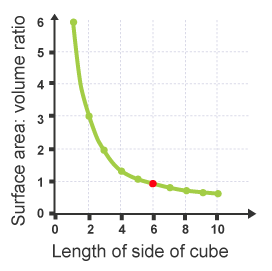
If a graph is drawn:
In the below table scientists have estimated the surface area : volume ratios of various organisms.
| Organism | Surface area (m2) | Volume (m3) | Surface area : volume |
|---|---|---|---|
| Bacterium | 6 x 10^-12 | 1 x 10^-18 | 6 000 000 : 1 |
| Blow fly | 6 x 10^-4 | 1 x 10^-6 | 600 : 1 |
| Whale | 6 x 10^4 | 1 x 10^6 | 0.06 : 1 |
Large organisms:
- have mechanisms to increase surface area proportionately, such as additional absorbing areas or adaptations of shape
- have transport systems and keep distances to a minumum for diffusion
Organisms living in harsh environmental conditions may reduce their surface area, eg cacti, to reduce loss of water.
Osmosis
Osmosis is the diffusion of water molecules, from a region where the water molecules are in higher concentration, to a region where they are in lower concentration, through a partially permeable membrane.
A dilute solution contains a high concentration of water molecules, while a concentrated solution contains a low concentration of water molecules.
Osmosis refers to the movement of water molecules only.
The images below show an example of osmosis showing the direction of movement of water between two different concentrations of sugar solutions.
Step one
The beaker contains water and sugar molecules
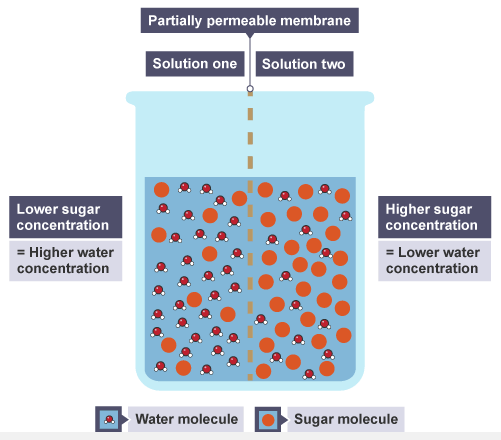
Step two
Water molecules pass through from solution one to two
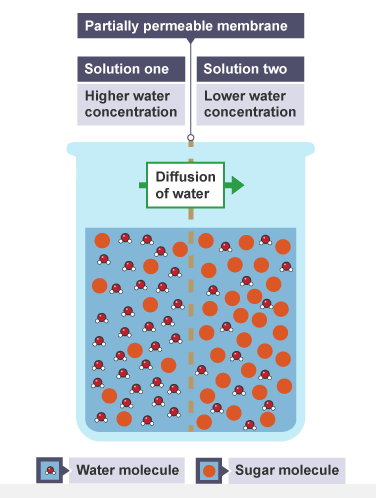
When the concentration of water is the same on both sides of the membrane, the movement of water molecules will be the same in both directions. There will be no net movement of water molecules. In theory, the level of solution two will rise, but this will be opposed by gravity and will be dependent on the width of the container.
Similar observations will be made with solutions containing different solutes, for instance, salt instead of sugar.
Osmosis across living cells
Cells contain dilute solutions of ions, sugars andamino acids.
The cell membrane is partially permeable.
Water will move into and out of cells by osmosis.
Plant cells
Isolated plant cells placed in a dilute solution or water will take in water by osmosis. Root hair cells, if the soil is wet or moist, will also take up water by osmosis. Leaf cells of land plants, unless it is raining or the humidity is high, will have a tendency to lose water.
Plant cells have a strong cellulose cell wall outside the cell membrane. The cell wall is fully permeable to all molecules and supports the cell and stops it bursting when it gains water by osmosis.
If plant cells are placed in solutions of increasing solute concentration:
Pure water
In pure water, the cell contents (the cytoplasm and vacuole) push against the cell wall and the cell becomes turgid.
Fully turgid cells support the stems of non-woody plants.
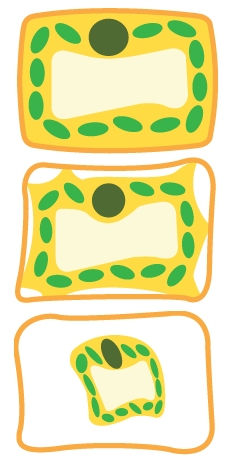
Concentrated solution
In a more concentrated solution, the cell contents lose water by osmosis. They shrink and pull away from the cell wall. The cell becomes flaccid. It is becoming plasmolysed.
Highly-concentrated solution
In a very concentrated solution, the cell undergoes full plasmolysis as the cells lose more water.
Plants would be exposed to higher concentrations of solutes if there was less water in the soil - for instance, if plants were not watered, or plants in drought conditions. Plant cells would then lose water by osmosis.
Aquatic, freshwater plants placed in the sea, or a seaweed in a rock pool where the water evaporated in the Sun, would also lose water by osmosis.
Animal cells
Animal cells also take in and lose water by osmosis. They do not have a cell wall, so will change size and shape when put into solutions that are at a different concentration to the cell contents.
For example, red blood cells could:
- lose water and shrink
- gain water, swell and burst in a more dilute solution
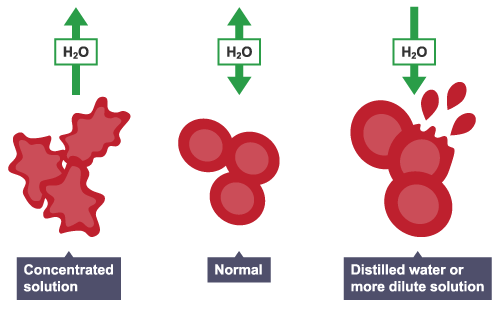
In animals, the concentration of body fluids – blood plasma and tissue fluid – must be kept within strict limits – if cells lose or gain too much water by osmosis, they do not function efficiently.
Required practical - the effect of osmosis on plant tissue
Investigate the effect of a range of concentrations of salt or sugar solutions on the mass of plant tissue
Scientists investigate the effects of osmosis on living cells. They either:
- Observe (with a microscope),cells or tissues placed in solutions of different concentration.
- Measure changes in cylinders or discs of fresh potato or beetroot. Cylinders will have a larger mass than discs, so scientists will have larger measurements to work with.
The following experiment investigates the effect of different concentrations of sucrose on potato tissue. It could also be carried out using salt – sodium chloride solution – instead of sucrose.
Aims of the experiment
- To investigate the effect of a range of sucrose solutions on the mass of potato cylinders.
- To determine the concentration of the cell sap of potato cells.
Method
- Prepare a range of sucrose (sugar) solutions. The concentration of a solution is measured in moles per cubic decimetre written as mol dm-3. For example, in this experiment your range could be from 0.2 mol dm-3 to 1.0 mol dm-3. A 1.0 mol dm-3 solution of sucrose will contain up to 342 g of sucrose per dm-3. A 1.0 mol dm-3 solution of a substance contains one mole of the substance per dm3 of a solution, or one mole per litre of solution.
- Set up a series of boiling tubes with each of these solutions. Also, set up one containing distilled water. This will have a concentration of sucrose of 0.0 mol dm-3 and will act as the control in the experiment.
- Make sure each tube is labelled with the concentration.
- Carry out the investigation. Prepare a blank results table before you begin. Make sure when weighing the potato cylinders, that their masses are not mixed up when recording them. Each cylinder will have a different mass before and after the investigation.
- For each sucrose concentration, repeat the investigation for several potato cylinders. This allows you to make the experiment more repeatable – not all potato cylinders might behave in the same way. Making a series of repeat experiments means that any anomalous results can be identified and ignored when a mean is calculated.
Risks
- Make sure that the potato is placed on a ceramic tile when using the cork borer – do not cut the potato cylinders towards your hand.
- Care must be taken when using the scalpel.
- Wear eye protection when using chemical solutions.
This experiment shows the effect of osmosis on plant tissue. The cylinders will decrease or increase in mass if they lose or gain water by osmosis.
The effects on plant tissues at a cellular level can be observed using a microscope. Another way of looking at osmosis in plant cells is to mount a piece of onion skin, or beetroot on microscope slides in drops of different concentrations of sugar or salt. Observe the cells for a few minutes. It is easy to see the process of plasmolysis in beetroot because the cell sap is red.
Scientific calculations - simple compound measures of rate
Example results
For the potato cylinder placed in distilled water - a sucrose concentration of 0 mol dm-3 - the following results were obtained.
| Concentration of sucrose | Mass of potato cylinder at start (g) | Mass of potato cylinder at end (g) | Change in mass (g) |
|---|---|---|---|
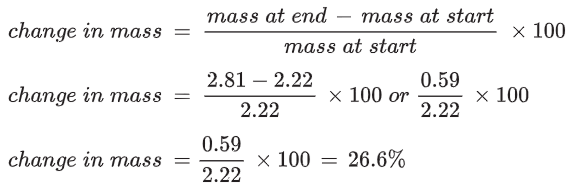
| 0 | 2.22 | 2.81 | + 0.59 |
The increase in mass is the result of water being taken up by osmosis.
The rate of water uptake
In this experiment, 0.59 grams of water were taken up by the potato cylinder.
This took place over 40 minutes, so the water uptake in an hour, assuming that the rate was constant, would be:
Water uptake in 1 hour =
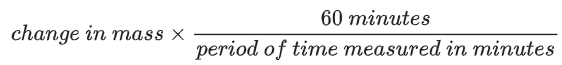
Water uptake in 1 hour =
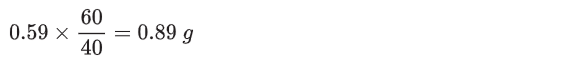 The rate of water uptake is therefore 0.89 g/hour.
Percentage change in mass
There is some variation in mass between the potato cylinders at the beginning of the experiment as it would be impractical to prepare the cylinders so that they were identical in mass.
To compare changes in mass of different potato cylinders, calculate the percentage change in mass.
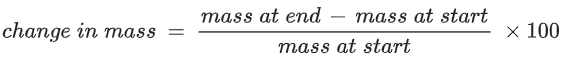
Some of the values obtained for percentage change in mass will be positive, some will be negative.
For the potato cylinder in the distilled water:
The changes in mass, as percentages, must be calculated for each potato cylinder.
Analysing results and using percentiles
The investigation cannot be based on changes in mass from just one potato cylinder.
In scientific tests, ensure a number of measurements are made to allow for uncertainty and error in data and anomalous results.
Percentage changes in mass must be calculated for each cylinder. A mean value for the change in mass of potato cylinders at each concentration – measured in moles of sucrose per dm^3 of solution, or mol dm^-3 – should be calculated.
A graph is plotted of change in mass, in per cent, against concentration of sucrose.
Where potato cylinders have gained in mass, the change will be positive.
Where potato cylinders have decreased in mass, the change will be negative.
| Concentration of sucrose | Average change in mass (%) |
|---|---|
| 0.0 | +26.8 |
| 0.2 | +5.0 |
| 0.4 | -7.7 |
| 0.6 | -17.9 |
| 0.8 | -26.0 |
| 1.0 | -31.4 |
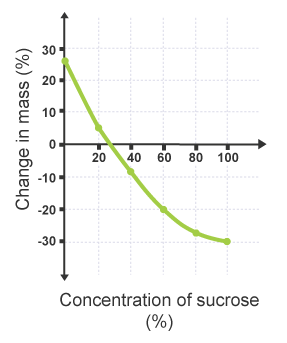
Where the plotted line crosses the horizontal axis at 0 per cent change in mass, the sucrose concentration is equal to the concentration of dissolved substances in the potato cells.
This can be identified on the graph as the point which shows no change in mass, and therefore represents no net movement of water by osmosis.
Percentile
The concentration of dissolved solutes in the cells of different potatoes will vary slightly from potato to potato. A set of data for a range in concentrations can look at the range, and the mean, but these do not show whether data is evenly spread or whether it is clustered together within a certain range.
Scientists use percentiles to divide a set of data into 100, and look to see where the data lie within these divisions.
The median – the point in a set of data where 50 per cent of the data fall above this value, and 50 per cent below it – is the 50th percentile.
The 75th percentile is where 75 percent of the data fall below this value.
There are several methods of finding a percentile. The simplest is the nearest rank method.
Begin by putting the data into order. For a range of values for the concentration of potato cell sap:
| 0.27 | 0.32 | 0.25 | 0.24 | 0.28 | 0.31 | 0.30 | 0.26 | 0.29 | 0.29 | 0.31 | 0.35 | 0.21 | 0.28 | 0.28 | 0.26 |
|---|---|---|---|---|---|---|---|---|---|---|---|---|---|---|---|
| 0.35 | 0.22 | 0.27 | 0.26 | 0.24 | 0.23 | 0.39 | 0.28 | 0.29 | 0.27 | 0.26 | 0.25 | 0.30 | 0.27 | 0.25 | 0.26 |
Arranged in order:
| 0.21 | 0.22 | 0.23 | 0.24 | 0.24 | 0.25 | 0.25 | 0.25 | 0.26 | 0.26 | 0.26 | 0.26 | 0.26 | 0.27 | 0.27 | 0.27 |
|---|---|---|---|---|---|---|---|---|---|---|---|---|---|---|---|
| 0.27 | 0.28 | 0.28 | 0.28 | 0.28 | 0.29 | 0.29 | 0.29 | 0.30 | 0.30 | 0.31 | 0.31 | 0.32 | 0.35 | 0.35 | 0.39 |
To find, for example the 50th percentile, first find the rank:
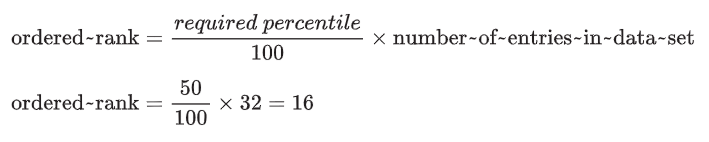
So the 50th percentile will be the 16th number in the ordered data set, starting from the left.
The 50th percentile is 0.27.
| 0.21 | 0.22 | 0.23 | 0.24 | 0.24 | 0.25 | 0.25 | 0.25 | 0.26 | 0.26 | 0.26 | 0.26 | 0.26 | 0.27 | 0.27 | 0.27 |
|---|---|---|---|---|---|---|---|---|---|---|---|---|---|---|---|
| 0.27 | 0.28 | 0.28 | 0.28 | 0.28 | 0.29 | 0.29 | 0.29 | 0.30 | 0.30 | 0.31 | 0.31 | 0.32 | 0.35 | 0.35 | 0.39 |
Where the ordered rank is not a whole number, round the number up.
Percentile rank
The percentile rank will show the position of a value within a range.
To find the percentile rank of a value, x:
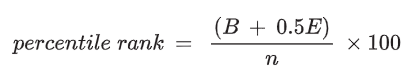
Where:
B = number of values below x
E = number of values equal to x
N = number of values
So, for the student's value of 0.27 mol dm^-3.
Active transport
Substances are transported passively down concentration gradients. Often, substances have to be moved from a low to a high concentration - against a concentration gradient.
Active transport is a process that is required to move molecules against a concentration gradient.The process requires energy.
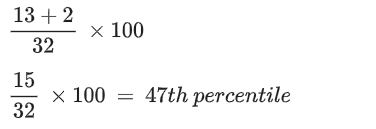
Active transport in plants
For plants to take up mineral ions, ions are moved into root hairs, where they are in a higher concentration than in the dilute solutions in the soil. Active transport then occurs across the root so that the plant takes in the ions it needs from the soil around it.
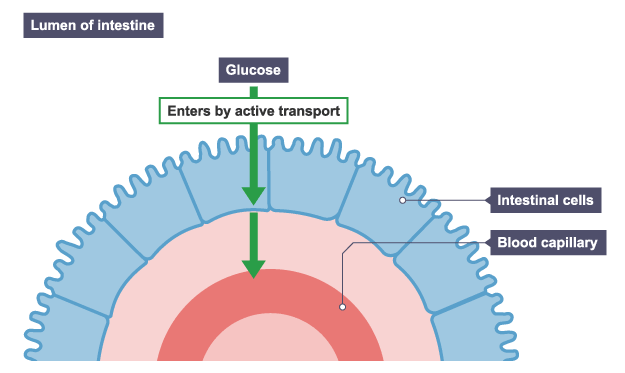
Active transport in animals
In animals, glucose molecules have to be moved across the gut wall into the blood. The glucose molecules in the intestine might be in a higher concentration than in the intestinal cells and blood – for instance, after a sugary meal – but there will be times when glucose concentration in the intestine might be lower.
All the glucose in the gut needs to be absorbed. When the glucose concentration in the intestine is lower than in the intestinal cells, movement of glucose involves active transport. The process requires energy produced by respiration.
Comparing diffusion, osmosis and active transport
In animals, plants and microorganisms, substances move into and out of cells by diffusion, osmosis and active transport.
| Process | Descriptions | Substances moved | Energy required |
|---|---|---|---|
| Diffusion | Substances move from a high to a low concentration down a concentration gradient | Carbon dioxide, oxygen, water, food substances, wastes, eg urea | No |
| Osmosis | Water moves from a high to a low concentration across a partially permeable membrane and down a concentration gradient | Water | No |
| Active transport | Substances move against a concentration gradient | Mineral ions into plant roots, glucose from the gut into intestinal cells, from where it moves into the blood | Yes |