Chapter 1: Introduction to Thematic Mapping
The Realm of Maps
Professional cartographers think of maps as vehicles for the transmission of knowledge and for analysis for discovery
The map defined
A map is a graphic representation of the milieu
Milieu include all aspects of the cultural and physical environment
A map is also described as ‘a model of reality’
The most basic map distinctions in modern cartography:
Tangible (real) vs. Virtual
Tangible map: printed hard copy
Virtual map: viewable but without a physical or tangible reality- computer monitor display or projected display in a classroom
Cf. mental maps:
defined as a mental image that have spatial attributes
Are developed in our minds over time by the accumulation of many sensory inputs
Can be either tangible or virtual
e.g. what is a mental map of your home town? Your mental map may be different from your brother’s or sister’s because everybody has their own perception even about the same object
What is Cartography
Definition of mapmaking or mapping
refers to all of the processes of producing a map, whether the person is collecting data, performing the design of the map, or preparing the map for distribution as a hardcopy or for the web
‘ the process of designing, compiling, and producing maps’
Definition of Cartography
Cartography is viewed as broader than mapping
Defined as the study of the artistic and scientific foundations of mapmaking
Geographic Cartography
Geographic cartography, although a part of all cartography, should be defined a bit further because it is a main tool and a product of a geographer
Is defined as a subfield that requires:
Understanding of the spatial perspective of the physical environment
Understanding of areal relationship
Skills in map projection selection
Knowledge of the map scale
to be adapt at map reading (interpretation)
Kinds of Maps
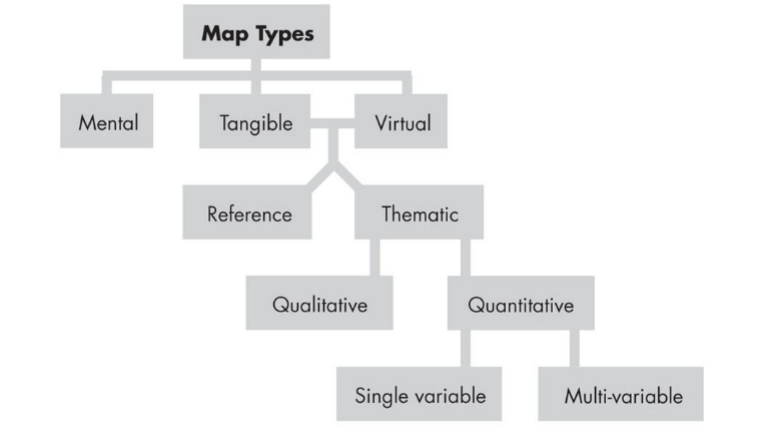
General Purpose Maps vs. Thematic Maps
General Purpose Map:
Also called a reference map
displays a variety of features of the world or a portion of it
ex. coastlines, water features, political boundaries, roads, cities, and other similar objects
Includes topographic maps, maps of countries and states, atlas maps, etc.
topographic map: general-use maps that show elevation (contour lines), hydrography, geographic place names, and a variety of cultural features
Thematic Maps
Also called a special-purpose, single-topic, or statistical map
Defined as “A map designed to demonstrate particular features or concepts”
Note: Topographic maps show more details of elevation, but are still considered a general purpose map because it includes other feature as well as elevation.
Two subdivisions of thematic maps: Qualitative vs. Quantitative
Qualitative
Show the spatial distribution or location of a single theme of nominal data
No quantitative (numbers) information is presented
ex. maps of ecoregions, geology, soil types, and land use/land cover maps
Quantitative
Display the spatial aspects of numerical data
The principal operation is in the transformation of tabular data into the spatial format of the map
The numerical values are generalized with symbols, so the map does not usually show exact amounts
Common Quantitative Thematic Maps
Choropleth, Dot, Proportional symbol, Isarithmic (or contour map), Value-by area cartogram, Flow
Types of Quantitative Thematic Maps
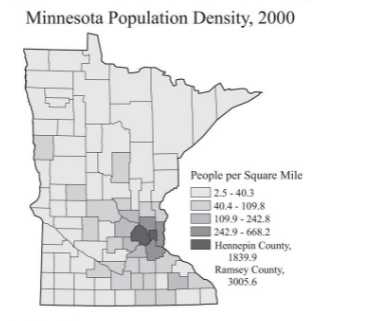
Choropleth map: shows data collected in enumeration units
Each unit in a map, such as a county, is shaded according to a variable or attribute, such as population density
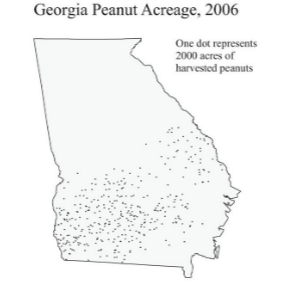
Dot map: shows variations in spatial density
One dot represents so many units of some commodity
Proportional symbol map: has symbols that are scaled to values at points
The point may be an actual point feature, such as a city
The point may also derived from an area unit, such as the center of state
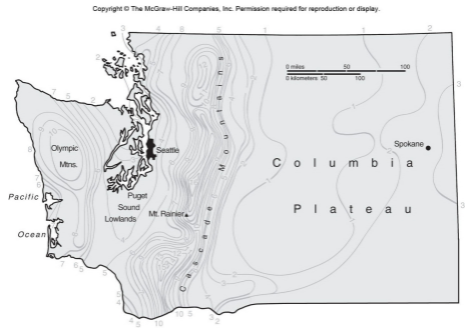
Isarithmic map: shows 3-D continuous volumes, such as elevation, temperature, or precipitation
Isarithms (isolines) connect points or places of equal values
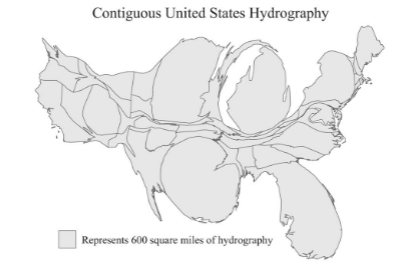
Value-by-Area Cartogram:
The enumeration units’ area values are replaced by the variable being represented, often creating a very striking appearance in the map
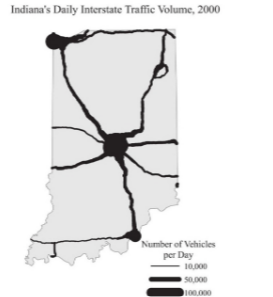
Flow map: show linear movement between places
The lines’ thickness and/or color indicate the magnitude of the flow or movement
Components of the Thematic Map
Three important component
A geographic or base map: provides basic locational information to which the thematic overlay can be related
A thematic overlay: theme that will be displayed
A set of ancillary map elements: titles, legends, compilation credits, neat lines, and others
Titles: the main map title and/or subtitles
Legends: help readers correctly interpret symbols, data ranges, etc.
Compilation credits (source statements): acknowledge the source for any data used in the map; they may include the map authorship
Neat lines: are usually a thin, unobtrusive line that surrounds the mapped area
Map Scale
Map scale: a ration of map distance to earth distance
Large-scale map vs. Small-scale map
Large-scale map: shows small portions of the Earth’s surface
Therefore, detailed information is shown (Large in detail)
Small-scale map: shows large area
Therefore, limited detail or generalized situations can be displayed on the map (small in detail)
Another important consequence of scale selection is its impact on symbolization
At large scales, the outlie and area of a city may be shown in proportion to its actual size- that is, it may occupy areas on the map proportional to the city’s area
At smaller scales, whole cities may be represented by a single dot having no size relation to the city’s real size
Modern View of Map Communication
Traditionally, maps have been used as communication tools using visualization → emphasis on communication
Now, maps are seen as tools in finding patterns and relationships among mapped data, not simply for the communication of ideas to others → more emphasis on ‘analysis’
Cartographic Communication: Three Parts
Map author: someone who wishes to convey a spatial message (may or may not be a mapmaker (=cartographer))
Cartographer (=mapmaker): a trained scientist who creates a map using cartographic abstraction (generalization)
Map reader (=map percipient): an end user who gains a spatial knowledge by looking at a map with t he following three steps in order
Map reading: map readers see what is displayed and how the mapmaker did it
Map analysis: map readers begin to see different patterns on a closer inspection
Map interpretation: finally map readers are able to explain what these patterns show
Cartographic Abstraction (Generalization)
Cartographic Abstraction (Generalization)
Is transforming unmapped data into map form and selecting and organizing the information necessary to develop the user’s understanding of the concepts
There are four elements:
Selection
Classification
Simplification
Symbolization
Four Elements of Cartographic Abstraction (Generalization)
Selection
Involves an early decision regarding the geographic space to be mapped, map scale, map projection and aspect, which data variable are appropriate for the map’s purpose, and any data gathering or sampling methods that must be employed
Classification
Is a process in which objects are placed in groups having identical or similar features
The individuality and details of each element is lost
Reduces the complexity of the map image, helps to organize the mapped information, and thus enhances communication
e.g. map of wheat area, corn area, rice area, and millet area vs. map of crop area (four different areas vs. on simple area)
Simplification
e.g. A path (a road) can be straightened if the purpose of a map is simply to show connectivity between two points, not to illustrate the road's precise locational features
Symbolization
Is required because it is not possible to create a reduced image of the real world without devising a set of marks (symbols) that stand for real-world things
Two major class of symbols: Replicative vs Abstract
Replicative symbols: those that are designed to look like their real-world counterparts, such as coastlines, trees, railroads, house, and cars
Abstract symbols: usually take the form of geographic shapes, such as circles, squares, and triangles; for this type of symbols, a detailed legend is required
Whether replicative or abstract symbols are used also depends on the map scale: at smaller scales, it is virtually impossible to represent geographical features
Difference between Cartography and GIS
GIS (Geographic Information Systems)
Cartography plus a computer0based system with data management and the ability of spatial analysis
Ethics in Cartography
Because maps are made by humans, they may contain purposeful errors (lies) or errors of oversight and poor judgement or both as a consequence
There are no governing bodies charged with guiding the ethical practices of thematic mappers
Thus, the intent, honesty, and credentials of each cartographer must be dealt with on an individual basis and his or her reputation must be considered