W2 L2 - The beast of bias
detecting outlier
graphs
sctterplots
histograms
standardized residual
in an average sample, 95% of standardized residuals should lie between +- 2
99% of standardized residuals should lie between +- 2.5
any case for which the absolute value of the standardized residual is 3 or more, is likely to be an outlier
detecting influential cases
actually affect data
there is a chnage in b when the case is removed
DF beta - the difference between coefficient values with and without influential case
do not just remove influential cases - instead look for explanations of why it is different; present results with and without it.
cook’s disntance
measures the influence of a single case on the model as a whole
absolute values greater than 1 are cause for concern
robust estimation
lmRob function - same information but uninfluenced by influential cases
key assumptions of the general linear model
linearity and additivity
Spherical errors
the population model should have:
homoscedastic errors - inspect the model residuals
independent errors - inspect the model residuals
Normality of something-or-other
population model errors
sampling distribution
residuals - distance between model prediction and variables observed
residuals vs. predicted values
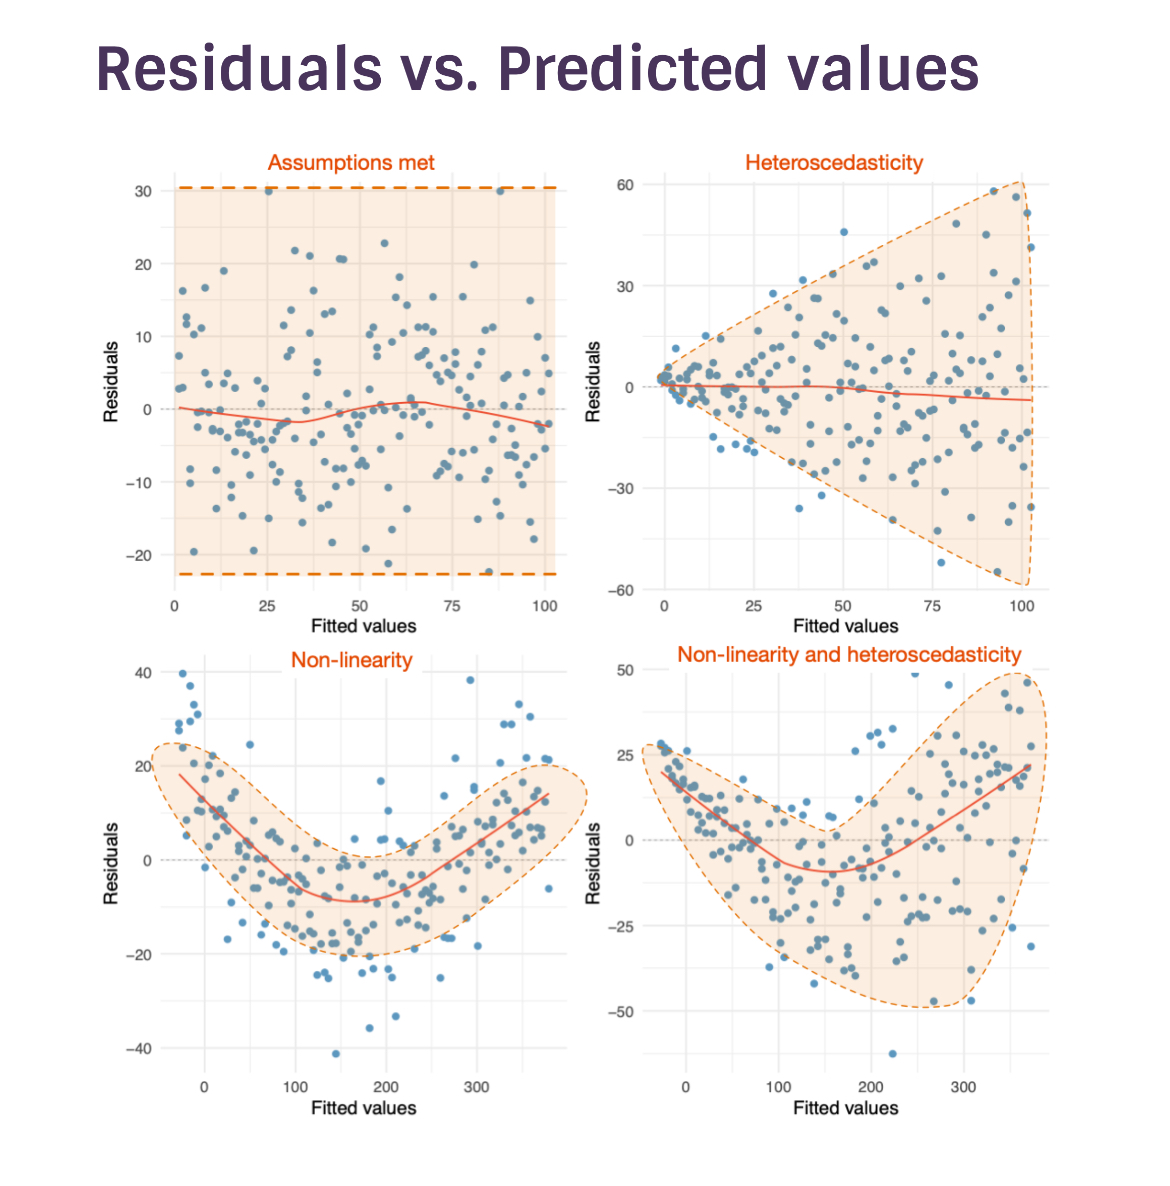
homoscedastic and heteroscedastic
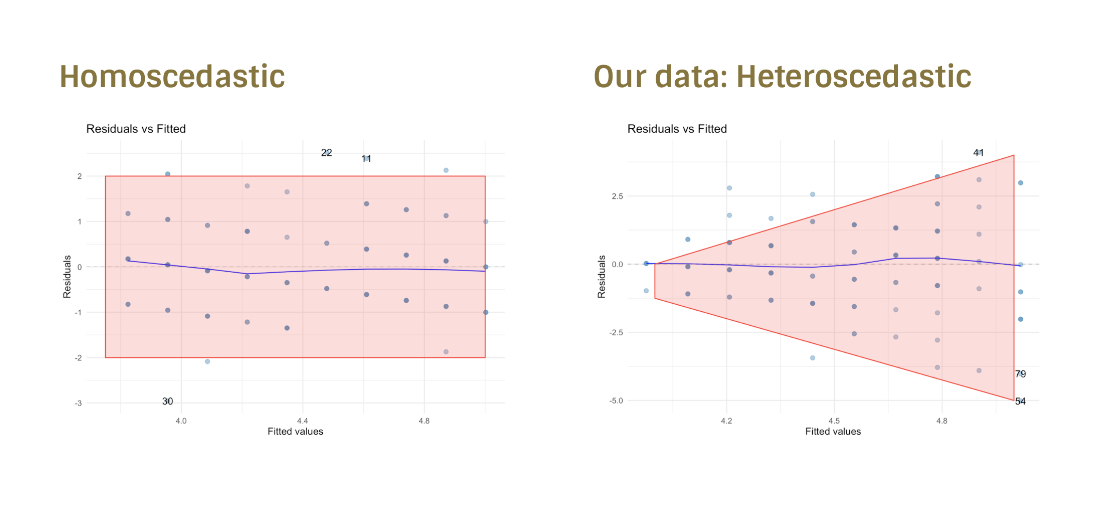
lenght between the first and the last few scores should be around the same
levene’s test
significance test - really useless
tells us to worry when its not needed and not to worry when its needed
normally distributed errors
estimation
normal errors dont really matter
when errors are not normally distributed, b will be unbiased and optimal, but there will be classes of estimator that are more accurate
confidence intervals and significance tests
- when residuals are normal
it can be shown that the bs have a normal sampling distribution
test statistics of bs (usually testing the null of b = 0) follow a t-distribution
- if they are not normal then
we cant base confidence intervals on the properties of the normal distribution
we dont know what distribution tests statistics have.
the central limit theorem (CLT)
bigger samples → normal distribution
smaller samples → estimate distributions looks more abnormal
use bootstrap in small samples to get an emperical confidence interval and standard error
the K-S test
do not use
normal residuals
diagonal line if perfectly normally distributed
curvature, snake, etc. - non-normality
correcting problems
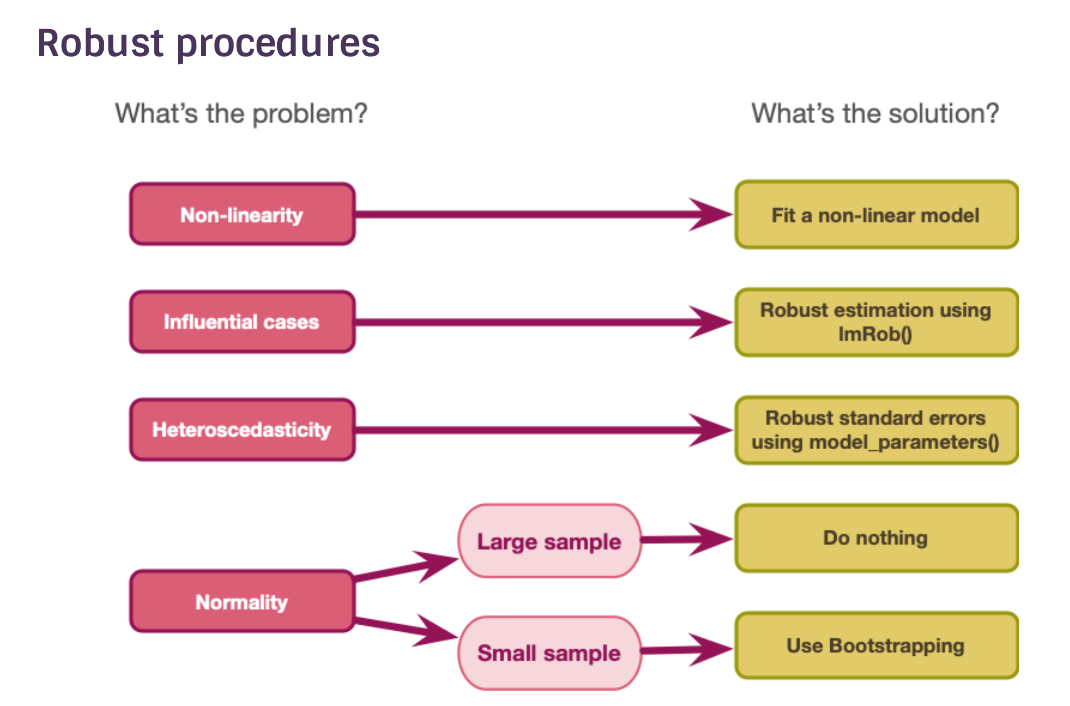
the bootstrap
take different sample groups within the same sample
extract scores at random but reput them so they can be picked up a second time randomly - different sample group
we can get an estimate destribution from the bootstrap samples as well as derive a confidence interval from the spread of the scores