Binding energy graphs
Interpretation and Calculations
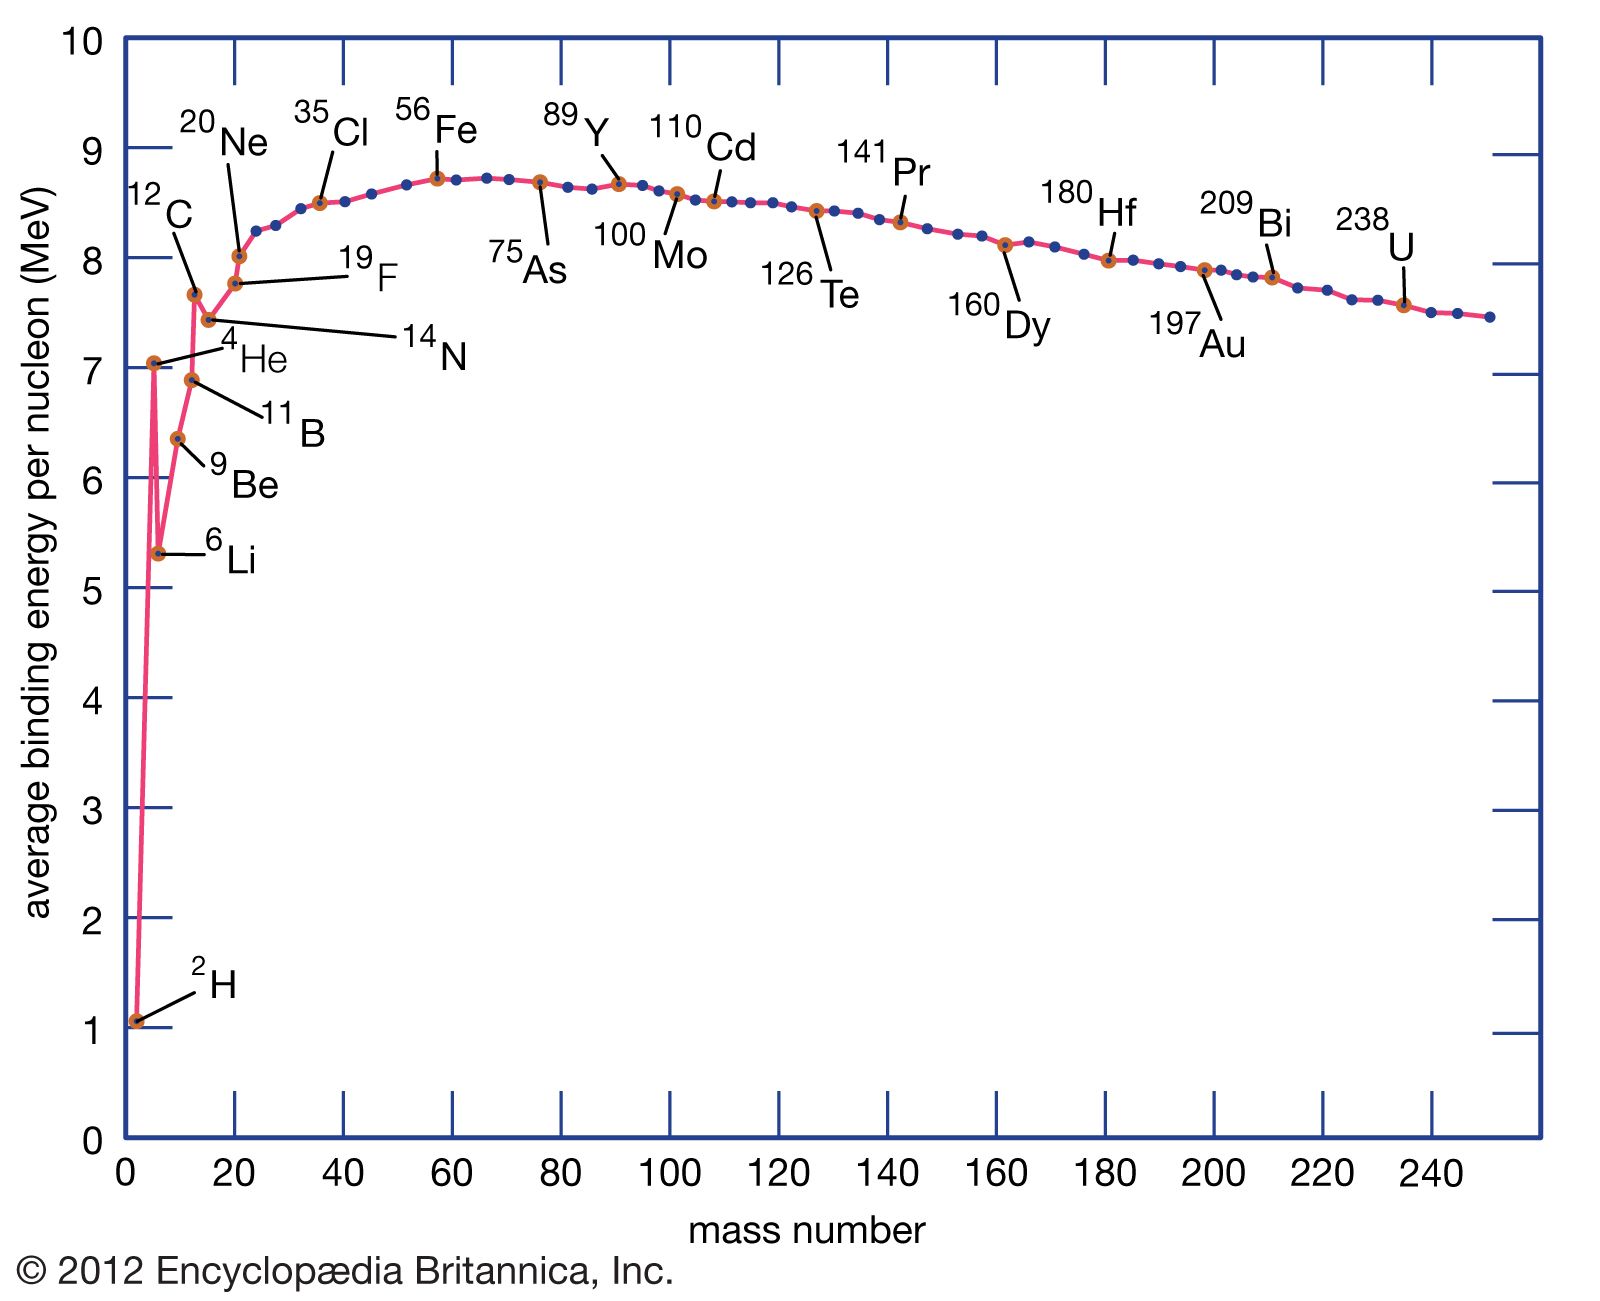
Binding Energy per Nucleon vs. Mass Number Graph
A binding energy per nucleon vs. mass number graph shows the variation of binding energy per nucleon across different nuclei.
The graph typically has the mass number (A) on the x-axis and the binding energy per nucleon (MeV/nucleon) on the y-axis.
Key Features of the Graph
Peak at Iron (Fe):
The graph peaks around iron-56, indicating that it has one of the highest binding energies per nucleon (~8.8 MeV/nucleon), making it one of the most stable nuclei.
Lighter Nuclei (A < 56):
For lighter nuclei (such as hydrogen, helium, etc.), the binding energy per nucleon increases with the mass number. This increase is because forming larger nuclei releases more energy as nucleons are bound more tightly.
Heavier Nuclei (A > 56):
For nuclei heavier than iron, the binding energy per nucleon decreases. This decrease indicates that very heavy nuclei are less stable and more prone to fission.
Interpretations from the Graph
Fusion:
Lighter nuclei can undergo fusion to form heavier nuclei up to iron-56. This process releases energy because the resulting nucleus has a higher binding energy per nucleon.
Fission:
Heavier nuclei (A > 56) can undergo fission into smaller nuclei. This process also releases energy because the smaller nuclei formed have higher binding energy per nucleon compared to the original heavy nucleus.
Stability:
Nuclei with higher binding energy per nucleon are more stable. The peak at iron-56 indicates that mid-sized nuclei are the most stable.
Calculations from the Graph - Energy Released in Fusion or Fission:
The graph can be used to estimate the energy released during nuclear reactions. The difference in binding energy per nucleon before and after a reaction gives the energy released.