ECO
Exam 1: Thursday, 10/15/26
Exam 2: Tuesday, 12/15/26
ECO 8/27/26: Opportunity Cost, PPF, and the Circular Flow Model
Scarcity, Opportunity Cost, and Decision Making
Opportunity cost is the value or benefit of the single next best alternative given up when making a choice, rather than the sum of all available options.
Individual preferences and opportunity costs are subjective and non-static, changing over time based on circumstances.
Rational decision-makers evaluate choices using marginal analysis, taking an action only when the marginal benefit () exceeds (or equals) the marginal cost ().
Rational decision-making assumes individuals understand costs and benefits and act to maximize net benefit.
Production Possibility Frontier
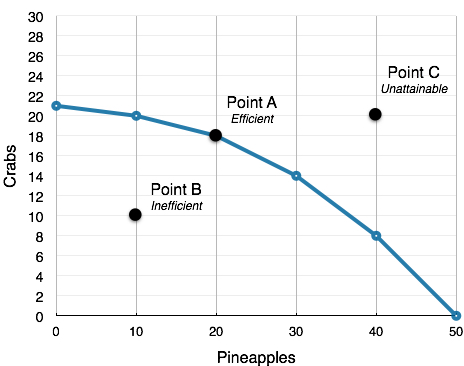
The Production Possibility Frontier () illustrates the maximum combination of two goods or choices an individual or economy can produce with limited resources.
Key regions of the :
Points on the frontier: Possible and efficient. Producing more of one good requires giving up units of another.
Points inside the frontier: Possible but inefficient. Resources are underutilized or wasted.
Points outside the frontier: Impossible given current resource constraints.
A linear signifies a constant opportunity cost.
Opportunity cost is calculated using the slope of the frontier:
Comparative Advantage, Specialization, and Trade
Comparative Advantage: The ability of an individual or firm to produce a good or service at a lower opportunity cost than others.
Specialization occurs when producers focus efforts entirely on activities where they hold a comparative advantage.
Specialization and trade allow individuals and societies to produce more in total and consume combinations outside their individual .
Adam Smith's Economic Theories:
Published Theory of Moral Sentiments and An Inquiry into the Nature and Causes of the Wealth of Nations ().
Introduced the concept of the "invisible hand," demonstrating that market coordination and trade are driven by self-interest and comparative advantage rather than pure benevolence.
The Circular Flow Model
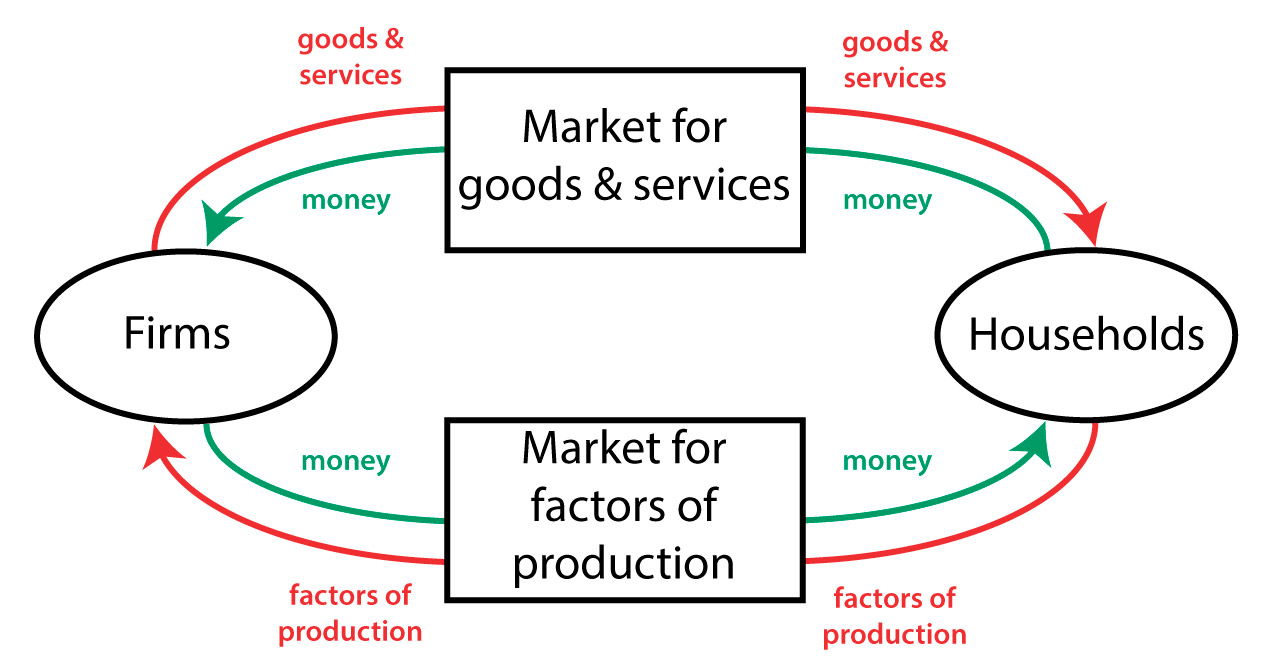
The circular flow model depicts the interaction between two key sets of decision-makers in an economy:
Households: Consume goods and services and own the factors of production.
Firms: Produce goods and services using factors of production.
Economic exchanges take place across two primary markets:
Market for Goods and Services: Households purchase output from firms (Households generate consumer spending; Firms receive revenue).
Market for Factors of Production: Firms hire or purchase resources from households (Households supply inputs; Firms make payments as household income).
Four Factors of Production:
Land: Natural resources used in production.
Labor: Human effort, time, and work provided to firms.
Capital: Goods and services used to make other goods and services (e.g., equipment, tools, furniture).
Entrepreneurship: The organization of land, labor, and capital to produce goods and services efficiently.
Macroeconomic flow dynamics: Reductions in household spending decrease firm revenues, leading to reduced production and lower demand for factor inputs such as labor.
ECO 9/8/26: Introduction to Demand and Demand Shifters
Fundamentals of Demand
Scarcity vs. Demand:
Scarcity pairs unlimited wants with limited resources.
A want becomes demand only when backed by willingness and purchasing power (cash, credit, or loans).
Marginal Decision-Making:
Consumers purchase up to the point where marginal benefit equals marginal cost ().
Even free goods are constrained by non-monetary costs such as time, transport, and storage.
The Law of Demand and Curve Movements
Graphing Conventions:
Quantity () is strictly plotted on the x-axis.
Price () is strictly plotted on the y-axis.
Law of Demand:
As price falls, quantity demanded increases, creating a downward-sloping demand curve.
A change in a good's own price causes movement along the curve (changing quantity demanded).
Determinants of Demand (Demand Shifters)
Factors other than the good's own price shift the entire curve right (increase) or left (decrease):
Tastes and Preferences:
Favorable changes increase demand; unfavorable changes decrease demand.
Consumer Income:
Normal Goods: Demand increases when income rises (e.g., houses, new cars).
Inferior Goods: Demand decreases when income rises (e.g., generic brands, Top Ramen).
Prices of Related Goods:
Substitutes: Goods used in place of one another. Higher substitute price increases demand for the target good.
Complements: Goods used together. Higher complement price decreases demand for the target good.
Consumer Expectations:
Expecting higher future prices increases current demand.
Number of Consumers:
An increase in buyers in a geographic market increases total demand.
Key Examples
Price Changes: Price increases cause a drop in quantity demanded (e.g., eggs, sparkling ice).
Substitutes: Cookies vs. cupcakes, Pepsi vs. Coke, Great Value vs. Windex.
Complements: Brownies and ice cream, pizza and wings, burgers and fries.
ECO 9/17/26: Market Equilibrium and Comparative Statics
Market Equilibrium
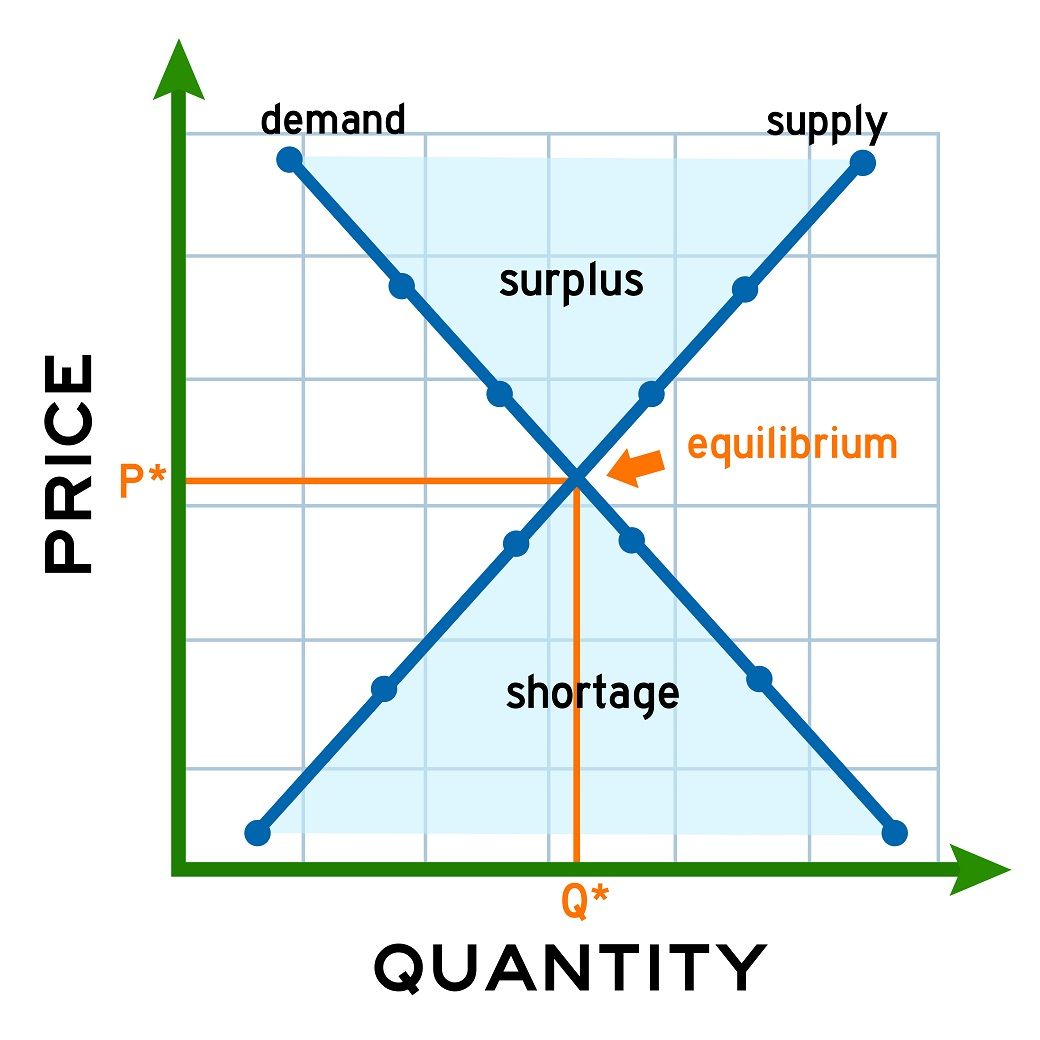
Market Equilibrium Cross: Graphing framework with quantity () on the x-axis and price () on the y-axis, featuring a downward-sloping demand curve and an upward-sloping supply curve.
Equilibrium Definition: The unique market point where quantity demanded () equals quantity supplied ().
Equilibrium Price (): The market-clearing price at which the price sellers are willing to accept equals the price buyers are willing to pay.
Equilibrium Quantity (): The market-clearing quantity where all units brought to market are sold, and all desired units are consumed.
Disequilibrium: Surplus and Shortage
Surplus ():
Occurs when market price is above equilibrium ().
Unsold excess inventory prompts sellers to offer discounts.
Price reductions send signals to producers to decrease production and consumers to increase consumption until is reached.
Shortage ():
Occurs when market price is below equilibrium ( ).
Excess demand leads buyers to bid up prices or buy for resale.
Price increases send signals to producers to increase output until the market clears at and .
Comparative Statics
Definition: An economic method that compares two static market snapshots before and after a single variable changes.
Application (Producer Taxes / Tariffs):
Affected Curve: Supply curve decreases (shifts left).
Initial Effect: Creates a shortage at the original equilibrium price.
Outcome: Equilibrium price increases () and equilibrium quantity decreases ().
Substitute Effect: An increase in price for new goods increases consumer demand for substitute goods, driving up the price of substitutes.
Market Efficiency
Pre-Tax Equilibrium: At price P* and quantity Q*, total surplus (Consumer Surplus + Producer Surplus) is maximized, achieving allocative efficiency with zero Deadweight Loss.
Post-Tax Shift: A per-unit tax increases input costs, shifting supply from S to S’. Price rises to P’, quantity contracts to Q’, and market welfare is split into four distinct outcomes:
Consumer Surplus
Producer Surplus
Government Revenue
Deadweight Loss

Efficiency Concepts
Productive Efficiency: Producing goods at the minimum possible cost along the supply curve (e.g., standard fast-food items). Luxury items deliberately violate this principle to maintain brand prestige and exclusivity.
Allocative Efficiency: Ensuring goods go to buyers who value them most highly. Secondary and resale markets increase allocative efficiency by reallocating goods to higher-valuation buyers.
Monopolistic Competition and Oligopoly
Imagine walking down a busy street in a town. Every business you pass falls into a different category based on how many competitors they have and how much power they have to set prices.
In economics, these categories are called Market Structures. Two of the most common ones in real life are Monopolistic Competition and Oligopoly.
Monopolistic Competition: A market with many small businesses selling similar but slightly different products (like coffee shops, fast food, or hair salons).
Oligopoly: A market dominated by just a few giant companies whose actions directly affect one another (like cell phone carriers, airlines, or car manufacturers).
/

Production