Economic activity
The relative importance of different economic sectors and the location of economic activity varies spatially, and changes over time
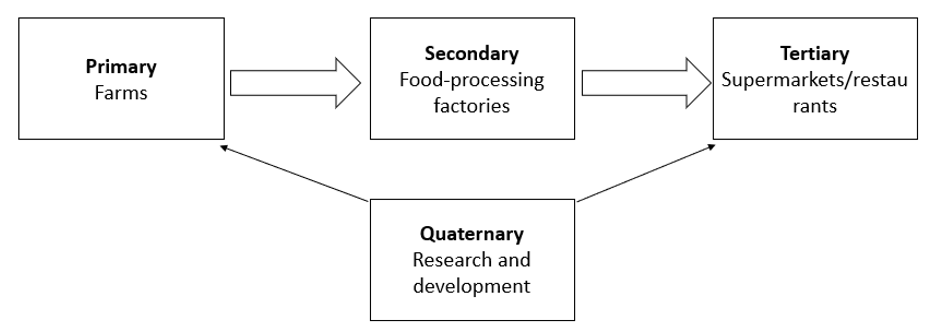
Classification of employment by economic sector and reasons for differences (Clark Fisher Model)
Economic sectors group jobs by the type of activity carried out.
Primary sector
Extraction of raw materials from the Earth.
Examples: farming, fishing, mining, forestry.
Dominant in low-income countries where technology is limited and many people rely on subsistence farming.
Secondary sector
Manufacturing and construction.
Raw materials are processed into finished goods.
Includes factories, shipbuilding, steel production, electronics.
Tertiary sector
Provision of services to individuals and businesses.
Examples: healthcare, education, retail, banking, tourism, transport.
Quaternary sector
Knowledge-based and research services.
Examples: IT, scientific research, biotechnology, media, data analysis.
Clark Fisher Model
Explains how employment structure changes as a country develops.
Stage 1 (pre-industrial): majority in primary sector due to low productivity and subsistence farming.
Stage 2 (industrial): growth of secondary sector as factories develop; rural–urban migration increases.
Stage 3 (post-industrial): tertiary sector becomes dominant as incomes rise and demand for services increases.
Stage 4 (advanced): quaternary sector expands due to high education levels and technological innovation.
Mechanisation reduces need for agricultural workers.
Rising wages increase consumer demand for services such as leisure and healthcare.
Global trade allows manufacturing to shift internationally.
Factors affecting the location of economic activity
Primary
Climate, rainfall, soil fertility.
Presence of minerals or oil reserves.
Access to water and flat land.
Secondary
Proximity to raw materials (historically near coalfields).
Energy supply.
Cheap labour availability.
Transport infrastructure and access to ports.
Government incentives (tax breaks, SEZs).
Over time, containerisation and global shipping reduced importance of raw material proximity.
Tertiary and quaternary
Skilled workforce.
Reliable internet and communications.
Large urban markets.
Attractive environments to draw skilled workers.
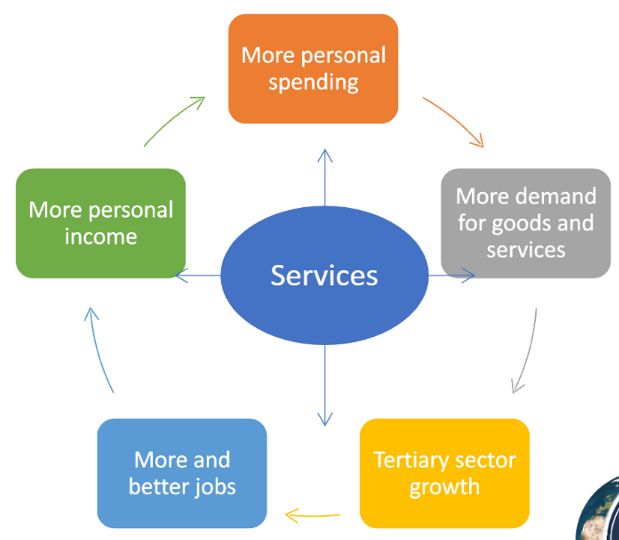
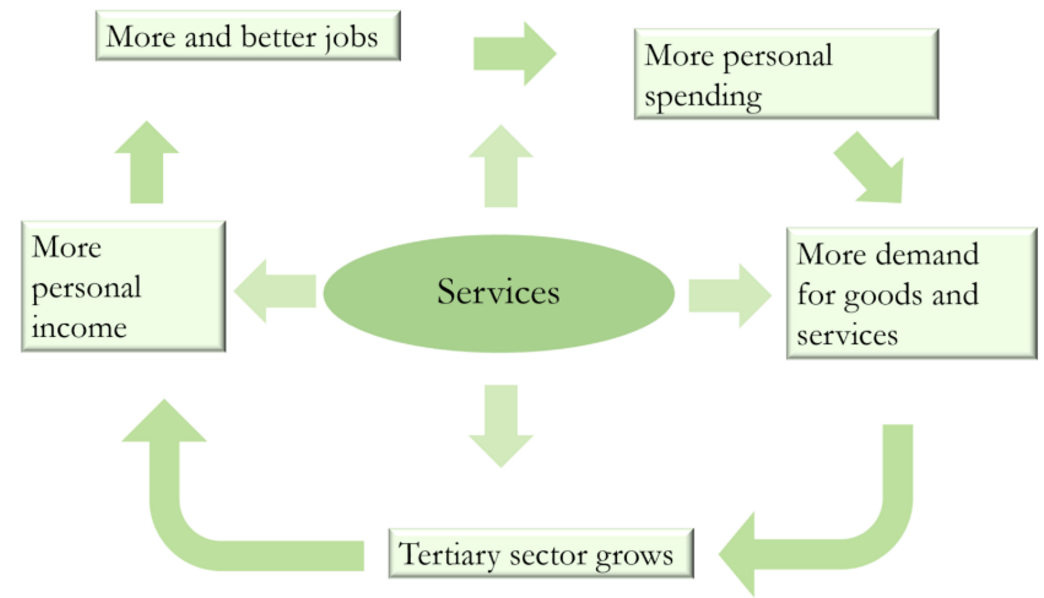
The tertiary sector:
As well as the cycle on the above various other changes can affect different parts of the tertiary sector
For example as disposable income increases and technologies change peoples taxes and desires also change
More luxury services
Rental DVD/video shops
IT technologies
The tertiary share of employment and GDP has been inflated, but there is decline in primary and secondary sectors
The rise of the ‘grey pound’ the spending of people who are retired of age
15% of the UK is over 64
Shoppers and tourists
SKI-era (spending the kids inheritance)
Traditional locational factors for services:
Services rely on:
Threshold: The minimum number of people required to make a service visible
Range: The maximum distance a customer is likely to travel for a particular service
Sphere of influence: The area served by a particular service
Low/high order (convenience/comparison)
Space of premises
Linked to market
Linked to suppliers
Many shops, offices and entertainment cluster in CBDs:
High accessibility, high footfall
However, certain services do not benefit from cramped conditions and competition for space (therefore high rent)
Services with high space requirements all that require customers to have easy access to cars/transport (superstores, outliers)
Industry/officers that have no need to be so central and require space for expansion
Tourism: Can occur anywhere there are primary or secondary resources for tourism, Sometimes in cities but often in beautiful rural environments
Decentralisation:
Since the 1980s that has been a big rise of ‘out of town’ locations for tertiary industries
Locally, these include:
John Lewis and Asda by the M40 Junction
Cressex industrial estate
New Cressex/business leisure Park
Reasons for changes in employment numbers in each sector
Availability of raw materials:
Depletion leads to decline (e.g. UK coal mining).
Discovery can cause growth (e.g. oil in Middle East).
Globalisation:
Globalization is the process by which the world is becoming increasingly interconnected
It is the spheres of culture and movement of people money goods and ideas (and sometimes problems) around the world
We now communicate, trade, travel and share each other’s cultures more easily around the world
Manufacturing outsourced to countries with lower wages.
Growth of multinational corporations.
Increased foreign direct investment.
Transport developments:
Container ships make transporting bulky goods quick and easy
Air transport means people and goods move quickly from one place to another. In recent years the cost of air travel has reduced.
ICT developments:
The internet allows people and businesses to communicate instantly
Satellite communications allow a global view and communications links even in very remote areas. They enable TV and telephone communications.
Mobile phone enable people to communicate and to access the internet wherever they are
Social networking brings people from all around the world in contact with one another
Technological advancements:
Technological advances in transport have also reduced friction of distance
Friction of distance has reduced as we can transport goods much quicker and relatively cheaply
Communications have become quicker and easier on a global scale
New industries have also been created by technological advances, such as aerospace, biotechnology and robotics
New products such as smart phones, 4G boxes etc have all appeared in the last 20 years
New services are also now needed for us to use our new technology such as broadband providers, software programmers and website designers.
Mechanisation and automation:
Tractors reduce need for farm labour.
Robots replace factory workers.
AI affecting tertiary and quaternary jobs.
Demographic changes:
Ageing populations increase healthcare demand.
Youthful populations provide industrial labour supply.
Government policies:
Investment in education supports quaternary sector growth.
Industrial policies encourage manufacturing (e.g. China’s SEZs).
Environmental regulations can reduce heavy industry.
E.g. Government intervention to support some industries can ensure certain types of jobs are secure in a changing world e.g. The chocolate law in Switzerland 1974
Swiss food manufacturers pay 2/3 more for raw materials such as milk and wheat than foreign competitors
High custom duties prevent them importing cheap foreign imports
Swiss government play subsidies to the manufacturers to make their products viable on the market
This is because Swiss food manufacturing industry accounts for round 10% if all Swiss produced cereals and 7% of milk. It protects jobs in both agriculture and manufacturing in Switzerland.
How could a growing population affect this cycle?
Growing population mean more young people
More need and demand for good such as baby products and also a requirement for more services
However having more children means that there is less of a personal income to spend on excess products
Sometimes the government would lose money as they have to pay and support parents
There may be an increase in personal spending to provide for the babies however there could also be a decrease as parents get work harder and give less time for themselves to go shopping due to increased pressure in the household
What about an aging population?
Government loses much more money because there are less people to support the economy
There might be an increase in personal spending as the ageing population would look to spend their pension
The tertiary sector could grow as the ageing population requires more people in services to take care of them
Less personal income as more people are retired
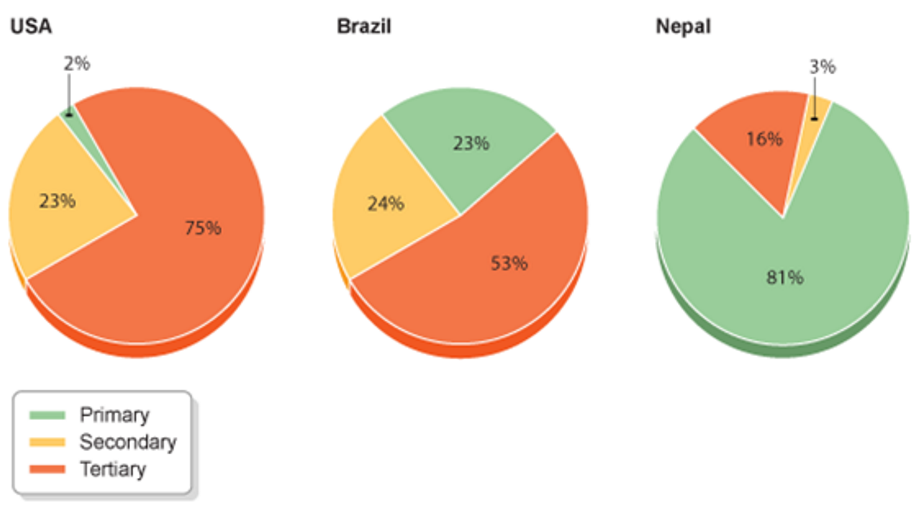
The employment structure of HICs, NICs and LICs
The employment structure of a given country can tell you quite a lot about its economy
In the richest countries, for example, there will usually be ,pre people working in the tertiary/quaternary sector than in the primary and secondary sectors
In the poorest countries there tend to be more people working in the primary sector than in either secondary or tertiary sectors
Different reasons for the employment structure in HICs and LICs
HIC | LIC |
|
|
The growth and decline of different economic sectors has resulted in a range of impacts and possible resource issues
Over the past 50 years there has been a significant global shift of the location of manufacturing
Since the 1970s the HICs share of world manufacturing has declined form 88% to 70%
Around 25% now occurs in middle income countries particularly BRIC (Brazil, Russia, India, China) countries
Deindustrialisation:
Deindustrialisation is the reduction of industrial activity or capacity in a region or economy, especially of heavy industry or manufacturing industry
It is one of the most significant economic processes to occur in the UK
Deindustrialisation in the UK has involved the decline of heavy industries such as coal mining shipbuilding and steel manufacturing. During the twentieth century, the UK went from over 3000 coal mines to just 30. The last working deep coal mine in the UK closed in December 2015
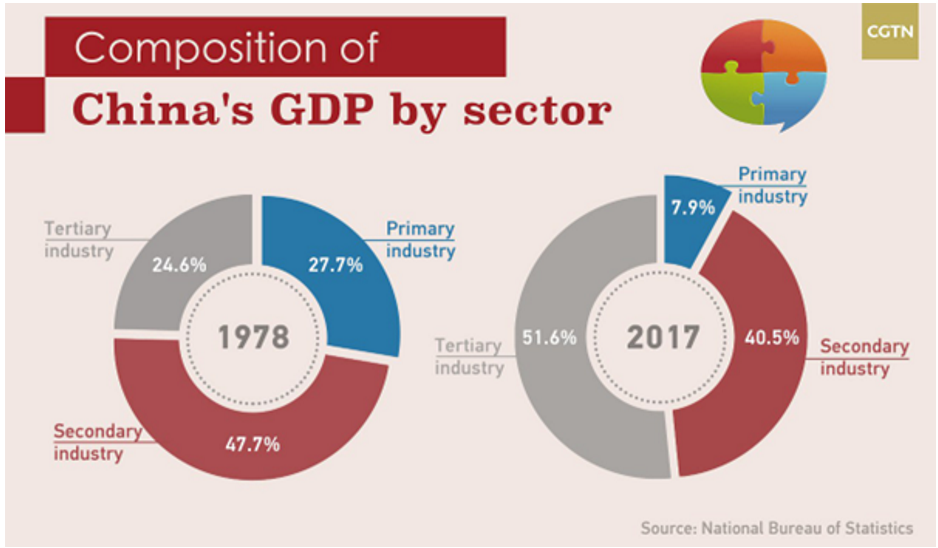
China: growth of secondary and tertiary sectors
Since 1980s economic reforms under Deng Xiaoping, China shifted from agricultural economy to global manufacturing powerhouse.
Secondary sector success
Special Economic Zones (e.g. Shenzhen) attracted foreign companies.
Cheap labour and large workforce encouraged export-led growth.
Became “world’s factory” producing electronics, textiles, steel.
Massive infrastructure development (ports, highways, high-speed rail).
Rapid GDP growth averaging around 8–10% for decades.
Tertiary sector expansion
Growth of finance, retail, technology, and e-commerce.
Companies such as Alibaba and Tencent dominate digital markets.
Rising middle class increased demand for services, tourism, healthcare.
Service sector now contributes over 50% of GDP.
Positive impacts
Over 800 million people lifted out of extreme poverty.
Improved education and life expectancy.
Urban development and global economic influence.
Negative impacts
Severe air pollution in cities like Beijing.
Water contamination from industry.
Regional inequality between east coast and inland regions.
Ageing population due to former one-child policy.
Dependence on exports makes economy vulnerable to global downturns.
Why have the Secondary and Tertiary sectors succeeded in China?
Secondary Sector Success (Manufacturing)
Huge labour force – China has a massive population, meaning lots of workers available, which kept wages low and attracted foreign factories.
Government support – The government created Special Economic Zones (SEZs) like Shenzhen with low taxes and fewer rules to attract foreign companies.
Foreign investment – Global companies (Apple suppliers, car firms, electronics brands) moved production to China to cut costs.
Improved infrastructure – Major investment in ports, roads, railways and airports makes exporting goods fast and efficient.
Access to raw materials – China has coal, iron ore and imports resources easily due to strong trade links.
Economies of scale – Huge factories can produce goods cheaply in bulk.
Export-led growth – China became the “world’s factory,” selling electronics, clothes and machinery worldwide.
Tertiary Sector Success (Services)
Rising incomes – As people earn more, they spend more on services like shopping, travel, healthcare and entertainment.
Urbanisation – Millions moved to cities, increasing demand for banks, transport, education, retail and housing services.
Growth of technology – Companies like Alibaba and Tencent boosted finance, online shopping and digital services.
Tourism growth – Both domestic and international tourism have increased.
Education expansion – More universities and skilled workers support finance, research and IT industries.
Government shift in focus – China is moving from manufacturing to a service and knowledge-based economy.
Global trade links – As trade grew, so did finance, shipping, insurance and logistics services.
The Primary sector is shrinking fast. What impact could this have? How will they feed everyone?
Possible Impacts
Food supply pressure – Less farmland and fewer farmers may reduce food production.
Greater food imports – China may depend more on buying food from other countries.
Rural unemployment – Farmers losing jobs may migrate to cities, increasing urban overcrowding.
Loss of traditional lifestyles – Rural communities and farming knowledge could decline.
Environmental issues – Abandoned or overused land may lead to soil degradation.
Regional inequality – Cities grow richer while rural areas fall behind.
How will China feed everyone despite this?
Mechanised farming – Using machines instead of people increases efficiency.
Improved technology – GM crops, better irrigation, fertilisers and scientific farming methods increase yields.
Large-scale commercial farms – Bigger farms are more productive than small family plots.
Food imports – China buys soybeans, grain and meat from countries like the USA and Brazil.
Government policies – Protecting key farmland and investing in agricultural research.
Vertical/urban farming – Growing food in cities using modern techniques.
Better transport and storage – Reduces food waste between farms and cities.
Ethiopia Case Study: Changes in Employment
Changes in Employment
Employment is shifting from agriculture toward factory work, retail, and office services.
Rural populations are migrating to cities for paid labour.
Young people and women are entering the workforce in record numbers.
High youth unemployment persists, and many roles remain informal or part-time.
Manufacturing is expanding, particularly in textiles and industrial parks.
Reasons for These Changes
Government initiatives and investment are driving non-farm job creation.
Rapid population growth adds a massive volume of new seekers to the market annually.
Low productivity, land scarcity, and droughts are pushing people out of farming.
Improving education systems are slowly addressing the "skills gap" for employers.
Urban centres provide significantly more wage-earning opportunities than rural areas.
Social Impacts
New opportunities for women and youth promote independence and social mobility.
High youth unemployment rates can fuel frustration and social tension.
Fast-paced urban migration overburdens city housing, schools, and healthcare.
Informal jobs lack benefits and stability, impacting overall quality of life.
Economic Impacts
Industrial and service growth helps diversify the economy away from agriculture.
Manufacturing jobs provide steady income and reduce extreme poverty for many.
Low average wages continue to limit domestic consumer spending.
Underemployment and high jobless rates hinder national productivity and growth.
Environmental Impacts
Climate-driven droughts reduce farm yields, accelerating the move to cities.
Urban sprawl increases pollution and demand for limited land and energy.
Reduced farming may ease pressure on rural ecosystems but shifts the environmental footprint to urban areas.
Informal employment:
This employs millions of people across the world, especially in LICs, but it is unofficial/often illegal
It is estimated that in some countries it could account for up to 50% of GDP (in USA only 9%)
People don’t pay tax, but are often not protected by government laws, so people can be exploited
They often ‘do’ jobs which could be classified as primary, secondary or tertiary, but don’t get included in official data
Examples of jobs | Advantages | Disadvantages | Why has it grown? |
Street vendors Rubbish collection Prostitution Drug dealing Begging Rickshaw driving | Gives people a living Products and services are cheap enough for others to afford | Children often involved and exploited Working conditions can be very inconsistent/poor hours No tax is paid - bad for the country
| Lack of education in a country Rural to urban migration - competition for jobs in city Development of slums - people work in small factories or on the streets, often in their own home |
Developed countries:
An informal economy (informal sector or grey economy) is the part o any economy that is neither taxed nor monitored by any form of government
It makes up a significant portion of economies in developing countries
It is sometimes stigmatised as troublesome and unmanageable
Workers typically evade taxes
May involve illegal immigrants
Including jobs like childminding and cleaning
Refereed to as the black economy
Workers are paid daily and hourly
Payments are usually paid in cash
Workers can be exploited and treated poorly
Developing countries:
Unregulated
Involves a wide range of people and jobs
Includes street vendors shoe shine boys car washers and litter pickers
Often feature low pay and long working hours
Can occur in hazardous backstreet workshops
Can contribute significantly to a countries income
Informal employment in Mumbai
Mumbai is India’s financial capital but also contains large informal economy.
Causes
Rural–urban migration from poorer states.
Limited formal sector jobs.
Rapid population growth (over 20 million people).
High education inequality.
The population of large urban areas have grown rapidly due to natural increase
Intense competition for formal sector jobs
Most people end up having to look to the informal sector to meet their basic needs
Over three quarters of Mumbai’s informal workers are in the service sector
Some people working in the formal sector look to the informal sector for a second income
75% street vendors were dependent on street vending as a source of income
Characteristics
Street vendors, taxi drivers, waste pickers, domestic workers.
Dharavi slum contains many small-scale recycling industries.
Cash-based economy, no contracts, no taxation.
Highly labour intensive work
Low and unreliable pay
Work is often temporary in nature and/or part time
Poor job security, with an absence of fringe benefits
Poor working conditions and a high exposure to health and safety risks
High potential for exploitation especially for children
Illegal untaxed and thriving
300 bakeries
15000 factories
Cheap labour keep costs low
25% sleep in the factories
Not much crime, very communal
Advantages
Provides survival income.
Encourages entrepreneurship.
Supplies cheap goods and services.
It provides cheap goods ad services for the lower income population
People working in the informal sector can develop skills which may later lead to employment in the formal sector
Businesses at a smaller scale in the informal sector may grow to a larger size operating in the formal sector
Some people can become self made and become very rich in the slums
There is a turnover of over 1 billion dollars a year
Disadvantages
No job security or pensions.
Unsafe working environments.
Low and unstable wages.
Reinforces inequality and poverty cycle.
It operates outside of the tax system
Most informal workers have incomes below the threshold of paying tax
Most Mumbai’s informal workers live in areas of urban deprivation
Population and resources:
Natural resources:
Coal
Oil
Water
Wind
Sun
Wood
Rocks and minerals
Precious stone (diamond)
Cruel oil
Natural gas
Animal resources
What factors will influence how many resources we use? -
Quality of life
Lifestyle
Water usage
Good consumption
Supply vs demand
What factors will influence how many resources are available? -
Population density
Populations growth
Demand and need
Overuse and overconsumption
Environmental factors
What is the main threat to the amount of natural resources available to us?
Non-renewable resources
Population density The money a people in an areas (Total population/the total area) |
Overpopulation When there are t oo many people in an area relative to the resources ad level of technology locally to maintain a high standard of living. It is characterized y low per capita income, high unemployment and underemployment and outward migration |
Underpopulation Occurs when there are too he people in an area to use the resources efficiently for a given level of technology. Characterized by high per capita incomes (but not maximum incomes), low unemployment and inward migration |
Optimum population This is the theoretical population which working with all the available resources, will produce the highest standard of living for the people in that area. It is dynamic (improving technology, new prospects meaning more people can supported) |
Theories explaining population and resources
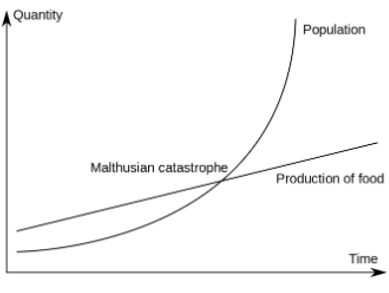
Malthus (1798)
As the population increases the human for food and natural resources increases.
A point will be reached where the supply of food does not reach the demands from the growing populations.
At this point there will be a crisis.
Argued population grows geometrically while food supply grows arithmetically.
Predicted food shortages leading to famine, disease, and war (positive checks).
Preventative checks included moral restraint and delayed marriage.
On a graph:
Population curve rises steeply (exponential).
Food supply line rises slowly (linear).
Gap between them widens over time.
Evidence supporting Malthus
Famines in Ethiopia (1980s).
Resource shortages in rapidly growing regions.
Environmental degradation due to overpopulation.
Famine and hunger in low income countries
Prevailing levels of poverty
Lots of wars in the world
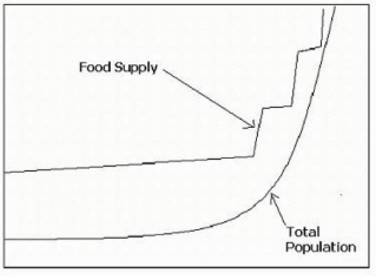
Boserup (1965)
As the population increases, the demand for food and natural resources increases.
However as the population increases so too does technology and development.
This allows for development of farming techniques and mechanisation in order to increase the supply and feed the growing population
Believed population growth stimulates innovation.
Farmers intensify agriculture using fertilisers, irrigation, mechanisation.
Technological advances increase food supply.
On a graph:
Population and food supply both rise sharply.
Food supply curve increases when innovation occurs.
Evidence supporting Boserup
Green Revolution increased crop yields in India and Mexico.
GM crops and improved irrigation boosted productivity.
Increasing intensification of agriculture
Green revolution where HYV seeds are introduced alongside fertilisers
Differences
Malthus pessimistic; Boserup optimistic.
Malthus sees population as problem; Boserup sees it as driver of progress.
Malthus assumes fixed technology; Boserup assumes technological advancement.
Similarities
Both focus on link between population growth and food supply.
Both recognise resource pressure as key issue.
Modern evaluation
Global food production has increased faster than population (supports Boserup).
However, food distribution inequality still causes hunger (partial support for Malthus).
Countries increasingly experience an energy gap and seek energy security
Key terms |
Primary Energy Fuels that provide energy without undergoing any conversion process (coal, gas, fuel, wood) |
Secondary Energy Made from the processing of primary fuels (electricity, petrol, coke) |
Renewable Sources of energy that can be used again and again and are not finite (within human timespans) |
Non-Renewable Sources of energy that are finite and once used up cannot be replaces (in human timespans) |
What is driving energy demand:
Rising population - more people need more energy
Development - as countries develop, energy use increases and the you of energy used changes
Wealth - more people using machinery transport etc
Technological advancements - more demand for oil and coal due to industrialization. Ability to adapt to renewable resources.
The greatest rise in energy demand was expected from LICs/MICs
This is due to urbanization and increased technological advancements
HIC demand is set to level off as there are more rentable resources and also a more active effort to reduce demand
As the global population rises this puts increased pressure on energy sources
More people living in urban areas
Higher number of people using cars etc
Industrialisation - change in type of energy used
Demand for food water etc
Increased car ownership
Travel - for work and holidays
Government investment into energy production
More people each electricity
Development of transport
Change in energy use due to industrialisation
New technological - more renewable energy
Government overdrives and pressure - change the type of energy used
Climate - impact amount of energy used. If it is cold more energy is used for heating
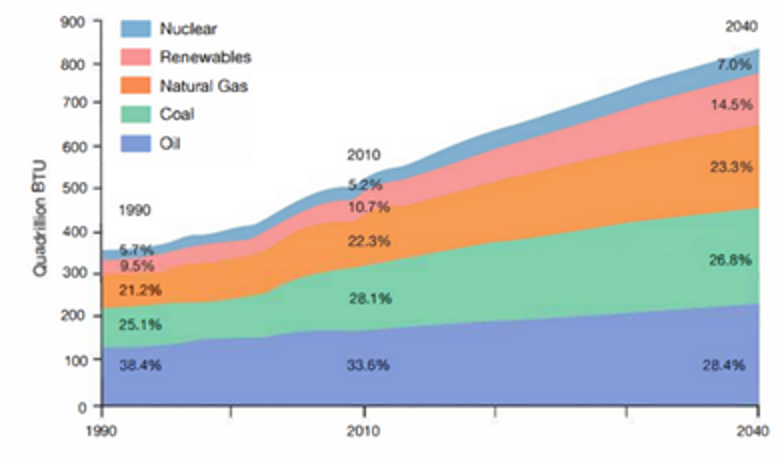
DESCRIBE what is being shown -
The overall demand for energy has increased significantly
Oil can be seen to be the main source of energy with 28.4% of usage
Despite this, its usage however has decreased from past uses with past recent ages being lower
Non-renewable is starting to level off with renewable increasing
Finite resources are depleting
More money and technology invested into developing renewables
More sustainable
The political landscape of the world is changing
Energy Gap | Energy available as supply - energy demand of citizens and industry |
Energy Surplus | When a country or region has an excess of energy for its needs and can export it |
Energy Deficit
| When a country or region has insufficient energy to meet demands so need to import it |
Energy Mix (comes up later in the power point!) | The specific combination of primary energy sources (fossil fuels, nuclear, renewables) a country uses to meet it total energy needs |
Energy security | This is when a country is able to meet all of its energy needs, preferably from within its own borders |
Non-renewable resources:
Type of fuel | Where it is from | Advantages | Disadvantages |
Coal (fossil fuel) | Formed from fossilised plants and consists of carbon with organic and inorganic compounds. It is mined from seams of coal found between layers of rock in the earth. | Coal is a ready-made fuel which is cheap to mine and convert to electricity – it lasts longer than oil or gas. | When burned, coal gives off atmospheric pollutants, including greenhouse gases. |
Oil (fossil fuel) | Carbon-based liquid formed from fossilised animals. Lakes of oil are found between seams of rock in the earth. | Oil is a ready-made fuel which is cheap to extract and convert into energy. It is used in industry and transport. | When burned, oil gives off atmospheric pollutants, including greenhouse gases. There is a limited supply of oil. |
Natural gas (fossil fuel) | Methane and other gases trapped between seams of rock under the earth are released through pipes sunk into the ground. | Gas is a ready-made fuel and relatively cheap. It is used in houses for heating and cooking and is a slightly cleaner fuel than coal and oil. | When burned, it gives off atmospheric pollutants, including greenhouse gases. There is a limited supply of gas. |
Nuclear | Radioactive minerals such as uranium are mined. Electricity is generated from the energy that is released when atoms from these mineral split. | A small amount of radioactive material produces a lot of energy, it’s relatively cheap and can last a long time. It doesn’t give off pollutants. | Nuclear reactors are expensive to run and nuclear waste is highly toxic. Leakage of nuclear materials can have a devastating impact on people and the environment. |
Biomass | It is generated from decaying plant or animal waste, or organic material and can be burned to provide energy. | It is a cheap and readily available source of energy. If crops are replaced, it can be a long-term, sustainable energy source. | When burned, it gives off atmospheric pollutants, including greenhouse gases. |
Wood | Obtained from felling trees, burned to generate heat and light. | A cheap and readily available source of energy. If trees are replaced, wood burning can be a long term sustainable energy source. | When burned, it gives off atmospheric pollutants, including greenhouse gases. |
Renewable resources:
Type of energy | Where it is from | Advantages | Disadvantages |
Solar | Energy from sunlight is captured in solar panels and converted into electricity. | Potentially infinite energy supply. Single dwellings can have own electricity supply. | Manufacture and implementation of solar panels can be costly. |
Wind | Wind turbines (modern windmills) turn wind energy into electricity. | Can be found singularly, but usually many together in wind farms. Wind is a potentially infinite energy supply. | Manufacture and implementation of wind farms can be costly. Some local people object to on-shore wind farms, arguing that it spoils the countryside. |
Tidal | The movement of tides drives turbines. A tidal barrage (a kind of dam) is built across estuaries, forcing water through gaps. In the future underwater turbines may be possible out at sea and without dams. | Ideal for an island such as the UK. Potential to generate a lot of energy. Tidal barrage can double as a bridge, and help prevent flooding. | Construction of barrage is very costly. Only a few estuaries are suitable. Opposed by some environmental groups as having a negative impact on wildlife. May reduce tidal flow and impede flow of sewage out to sea. |
Wave | The movement of seawater in and out of a cavity on the shore compresses trapped air, driving a turbine. | Ideal for an island country. More likely to be small local operations, rather than done on a national scale. | Construction can be costly. May be opposed by local or environmental groups. |
Geothermal | In volcanic regions it is possible to use the natural heat of the earth. Cold water is pumped under ground and comes out as steam. Steam can be used for heating or to power turbines creating electricity. | Potentially infinite energy supply. Used successfully in some countries, such as New Zealand and Iceland. | Can be expensive to set up and only works in areas of volcanic activity. Geothermal and volcanic activity might calm down, leaving power stations redundant. Dangerous elements found underground must be disposed of carefully. |
Hydro-electric Power (HEP) | Energy harnessed from the movement of water through rivers, lakes and dams. | Creates water reserves as well as energy supplies. | Costly to build. Can cause the flooding of surrounding communities and landscapes. Dams have major ecological impacts on local hydrology. |
Biomass | It is generated from decaying plant or animal waste, or organic material and can be burned to provide energy. | It is a cheap and readily available source of energy. If crops are replaced, it can be a long-term, sustainable energy source. | When burned, it gives off atmospheric pollutants, including greenhouse gases. |
Wood | Obtained from felling trees, burned to generate heat and light. | A cheap and readily available source of energy. If trees are replaced, wood burning can be a long term sustainable energy source. | When burned, it gives off atmospheric pollutants, including greenhouse gases. |
What are the main negative impacts of using non-renewable energy sources?
Greenhouse gases are released
Global warming and climate change
Defforestation
Create political conflicts
Which resource do you think is the most sustainable & why?
Solar energy as it’s renewable but also in abundance
Why is it possible that more HICs are able to use more renewable energy than LICs?
More income to be able to spend on renewable resources
More developed technology
Able to conduct more research
More aware of it importance of using renewable energy
Non-renewable energy production:
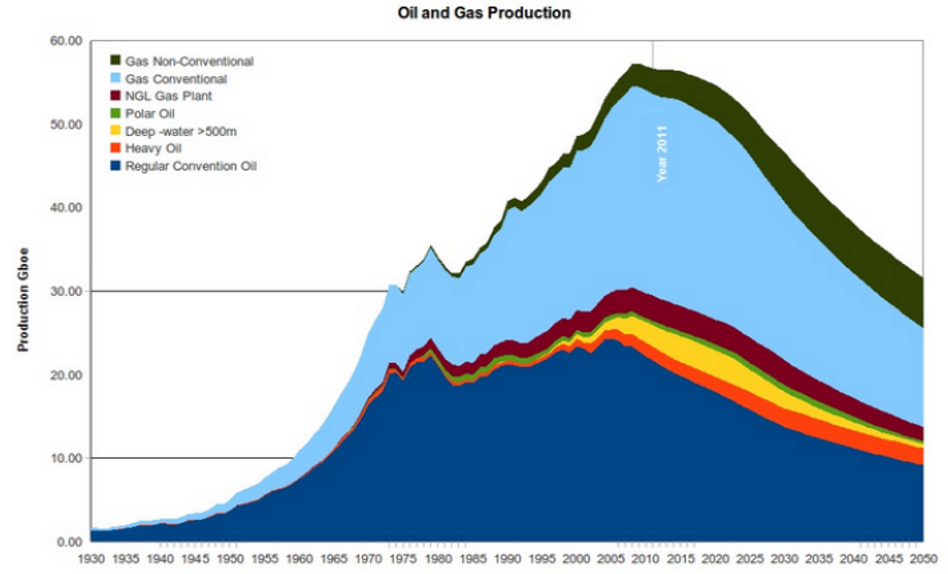
Non renewable energy sources are finite
There will come a point when they will run out too
What is ‘peak oil’ and when will we reach it?
Peak oil is the point at which the production of oil will start to decline
Estimated metric 2015-2050
What might drive the UK’s increasing energy gap and what will the main impact be?
The UK potentially has an increased energy gap in the future for 2 main reasons
Firstly if finite local supplies start to run out (e.g. north sea gas/oil)
Secondly if older more polluting energy sources are phased out (e.g. coal and oil) - we need to find new replacements
If demand continues to grow and supplies reduce then the result will be that prices will increase
Why do we need to be more energy efficient?
If costs rise globally
Economic development is much harder
Countries with an energy gap will suffer the most
Countries with a surplus grow in power - possible conflict or war
If non-renewables are continued to be used
CO2 emissions will increase, thus fuelling global warming
Exploration in environmentally subserve areas will be encouraged - e.g. drilling in the arctic
What does being sustainable with our energy mean?
The purpose of sustainability is to manage resources or run projects or industries, so future generations can use the resources too
Countries find new types of energy, while developing and expanding existing sources that are more sustainable than fossil fuels
Industry and domestic users of energy use it more efficiently (ie stop wasting it)
HICs start to switch from fossil fuels to alternative sources
As LICs start to use more energy they are encouraged to develop more sustainable sources of energy
Ways to be more sustainable:
Education
|
Transport
|
Industry
|
Denmark energy management (developed country)
Key facts and figures
Located in Northern Europe (Scandinavia) between the North Sea and Baltic Sea
Capital: Copenhagen
Population: ~5.9 million
Currency: Danish Krone (DKK)
Government: Constitutional monarchy with parliamentary democracy
Major cities: Aarhus, Odense, Aalborg
Main industries: Renewable energy, pharmaceuticals, shipping, agriculture, food production, technology
Climate: Temperate maritime (cool summers, mild winters)
Long coastline important for trade, fishing and wind energy
Level of development
Highly Developed Country (HIC) with very high GDP per capita
Strong mixed economy with global companies in shipping, energy and medicine
Free healthcare and government-funded education
Strong welfare system with low poverty and inequality
Advanced infrastructure and digital technology
Very high Human Development Index (HDI) and quality of life
Why Denmark needs to manage energy use and use renewables
Limited and declining fossil fuel resources (oil and gas in the North Sea)
National target to become climate neutral by 2050
Renewable energy reduces reliance on imported fuels
High living standards, transport and industry increase energy demand
Why Denmark is suitable for renewable energy
Windy climate and flat land ideal for wind power
Long coastline provides excellent offshore wind conditions
Strong government support through investment and subsidies
High public support for renewable energy
How development helps reduce non-renewables
Advanced technology supports smart grids and wind turbine innovation
Wealth allows large government investment in renewable projects
Strong education system encourages research in green energy
How renewable energy is used
Electricity generation (wind sometimes provides over 50% of electricity)
District heating powered by biomass and waste
Power for electric vehicles
Exporting excess wind energy to neighbouring countries
Where renewable energy is generated
Offshore wind farms in the North Sea
Horns Rev Wind Farm and Anholt Offshore Wind Farm
Solar farms in southern Denmark
Biomass plants in cities such as Aarhus
Renewable Energy Examples
Wind Energy
Where generated
Offshore: North Sea and Baltic Sea
Onshore: Western Denmark (Jutland Peninsula)
Examples
Horns Rev Wind Farm
Anholt Offshore Wind Farm
Facts
Denmark was an early global leader in wind energy
Wind can produce over half of Denmark’s electricity
Home to major turbine company Vestas
Positives
Very low carbon emissions
Renewable and sustainable
Creates jobs and export income
Offshore wind is highly efficient
Negatives
Offshore turbines expensive to build
Electricity output depends on wind speed
Onshore turbines can affect views and create noise
Biomass Energy
Where generated
Power stations in cities such as Copenhagen
Former coal plants converted to use biomass
Example
Avedøre Power Station
Facts
Widely used in district heating systems
Some biomass (e.g. wood pellets) is imported
Positives
Uses waste materials
Can produce continuous energy
Reduces landfill waste
Negatives
Burning biomass still releases CO₂
Risk of deforestation if poorly managed
Some fuel must be imported
Limited fossil fuel reserves; imports much energy.
Major investment in wind energy since 1970s oil crisis.
Over 50% of electricity generated from wind.
Large offshore wind farms (e.g. Hornsea projects in North Sea region).
Strong government subsidies and carbon taxes.
District heating systems improve efficiency.
Encourages cycling and electric vehicles.
Aims for carbon neutrality by 2050.
Success due to political commitment, public support, and high investment capacity.
India energy management (emerging country)
Key facts and figures
Location: South Asia
Population: ~1.4 billion (largest in the world)
Capital: New Delhi
Climate: Tropical south, desert west, mountains north
Economy: Rapidly growing with strong manufacturing, technology and services
~75% of electricity traditionally from fossil fuels (mainly coal)
One of the world’s largest energy consumers
Major total CO₂ emitter but low emissions per person
Government target: 500 GW renewable capacity by 2030
Level of development
Newly Emerging Economy (NEE)
Rapid economic growth but uneven development
Mix of high-tech cities (e.g. Bengaluru) and poorer rural areas
Many rural areas still have limited electricity access
Still reliant on coal but increasing investment in renewables
Why India needs to manage energy use and increase renewables
Rising energy demand from population growth and development
Heavy coal use causes:
Air pollution
Health problems
Climate change impacts
Some areas still lack reliable electricity
Renewables help:
Improve energy security
Reduce reliance on imported fuels
Meet climate targets
Renewable energy potential and challenges
Potential
High sunshine levels year-round
Long coastlines and open plains for wind
Large desert and unused land areas
Challenges
High initial installation costs
Energy storage needed for intermittent power
Electricity grid not always reliable
Continued dependence on coal for base-load power
Why energy demand is increasing
Rapid industrialisation
Urbanisation and expanding cities
Increased use of air conditioning, transport and appliances
Growing middle class with higher living standards
How renewable energy is used
Electricity for homes and industry
Power for transport (e.g. electric trains)
Solar panels on:
Large solar farms
Rooftops of homes, schools and factories
Wind farms connected to regional and national grids
Where renewable energy is generated
Solar: Rajasthan, Gujarat
Wind: Tamil Nadu, Gujarat
Large solar parks in desert regions with high sunlight
Renewable Energy Examples:
Solar energy in India
Where generated
Bhadla Solar Park (Rajasthan)
Gujarat and the Thar Desert
Facts
India is one of the largest solar producers
Solar capacity has grown rapidly since 2015
Positives
Renewable and low carbon
Ideal climate with strong sunlight
Can be installed on rooftops in rural areas
Negatives
Only produces electricity during daylight
Large land areas required
Battery storage is expensive
Wind energy in India
Where generated
Muppandal Wind Farm (Tamil Nadu)
Coastal Gujarat
Facts
India is among the world’s top wind producers
Strong seasonal winds, especially during monsoons
Positives
Clean and renewable energy
Reduces fossil fuel use
Creates rural employment
Negatives
Wind supply is variable
Can impact landscapes and wildlife
High installation costs
Rapidly growing demand due to population (1.4 billion) and industrialisation.
Heavy reliance on coal (over 50% electricity generation).
Air pollution major issue in cities like Delhi.
National Solar Mission aims for 100+ GW solar capacity.
Development of large solar parks (e.g. Bhadla Solar Park).
Expanding wind power in Tamil Nadu and Gujarat.
Hydroelectric dams provide renewable energy but cause displacement.
Challenges: energy poverty in rural areas, funding constraints, balancing development and sustainability.
Sustainable energy management case study example: Freiburg, Germany
Known as “Green City”.
Extensive use of solar panels on homes and public buildings.
Excellent public transport and cycling infrastructure.
Energy-efficient housing (Vauban district).
Community involvement in renewable projects.
Demonstrates education, conservation, and efficiency working together.