Chi-Square Goodness-Of-Fit Test & Chi-Square Test of Independence
Definition (#f7aeae)
Important (#edcae9)
Extra (#fffe9d)
Non-parametric test: Analysis which are carried out when the assumptions for parametric test are not met.
Unequal group sizes, data not normally distributed, variances not equal
Assumptions:
Non-parametric tests don’t require assumptions about the shape of the underlying distribution.
The data are assumed to be a random sample.
Chi-square (χ²):
Variables which are categorical, specifically nominal.
Values are frequencies.
To determine how often observations fall into a particular category.
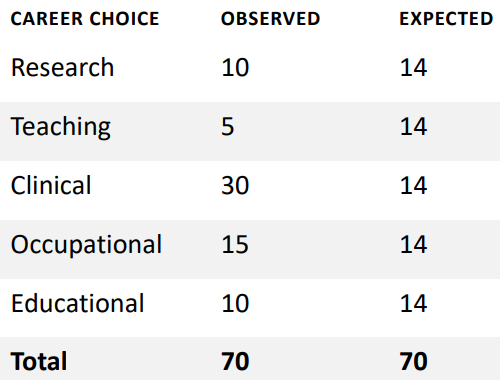
Ex:
Observed frequency is the actual frequency obtained.
Expected frequency is the ideal frequency.
All the categories have equal frequencies.
Formula:
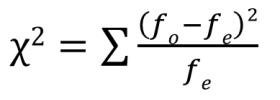
f0 is the observed frequency (for that cell).
fe is the expected frequency (for that cell).
Chi-square goodness-of-fit test:
When there is only 1 variable which is nominal.
Determines whether observed/actual frequencies differ from the expected frequencies.
The expected frequencies for each category should be at least 1.
The categories are also required to be mutually exclusive.
Degrees of freedom:
df: The number of categories – 1.
Ex:
Choice of drinks: Tea, coffee, juice, water, alcohol.
5 different categories.
df: 5 -1 = 4
Analysis:
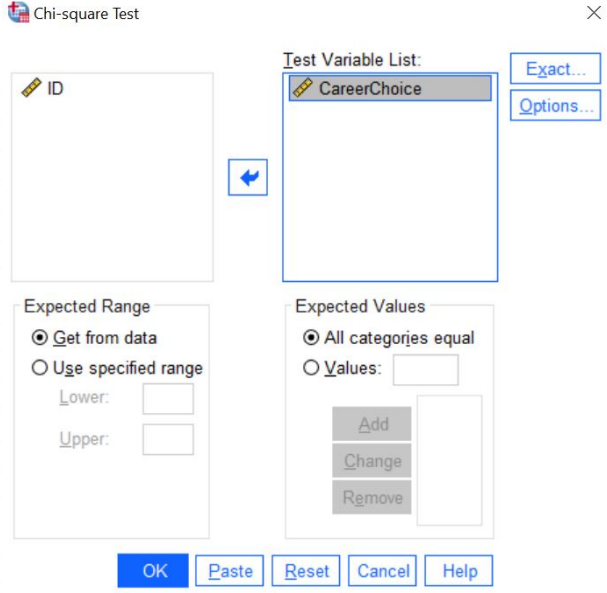
Analyze → Nonparametric Tests→ Legacy Dialogues → Chi-Square.
Put variable in “Test Variable List” → Click “OK”.
Template:
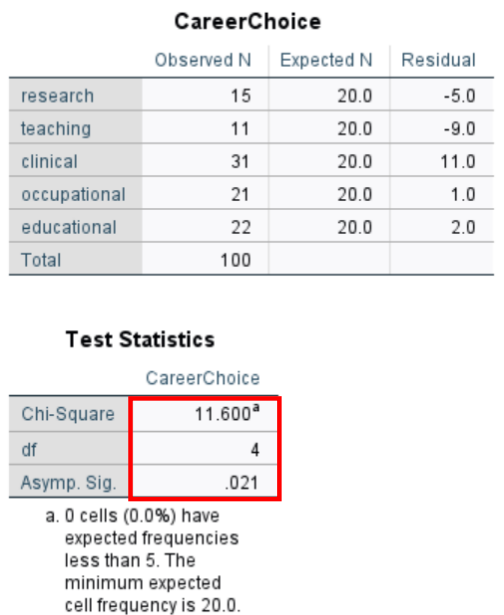
What test you ran & what variables were plugged in.
Is there a significant difference between frequency and expected.
Report the “equation” with the values.
Interpretation:
If significant: Some categories may have higher/lower frequencies than other.
If not significant: Similar frequencies across categories.

Chi-square Test of Independence: Degrees of freedom
df: (rows- 1)(columns-1).
Ex:
Choice of drinks: Tea, coffee, juice, water, alcohol, gender: Male and female.
There are 5 x 2 categories.
df: (5-1) x (2-1) = 4
Expected values:
Difference between chi-square tests with 1 versus multiple IV lies in how the expected values are calculated.
The formula for calculating an expected value is:
Expected: (Row Total × Column Total) ÷ Grand Total
Ex:
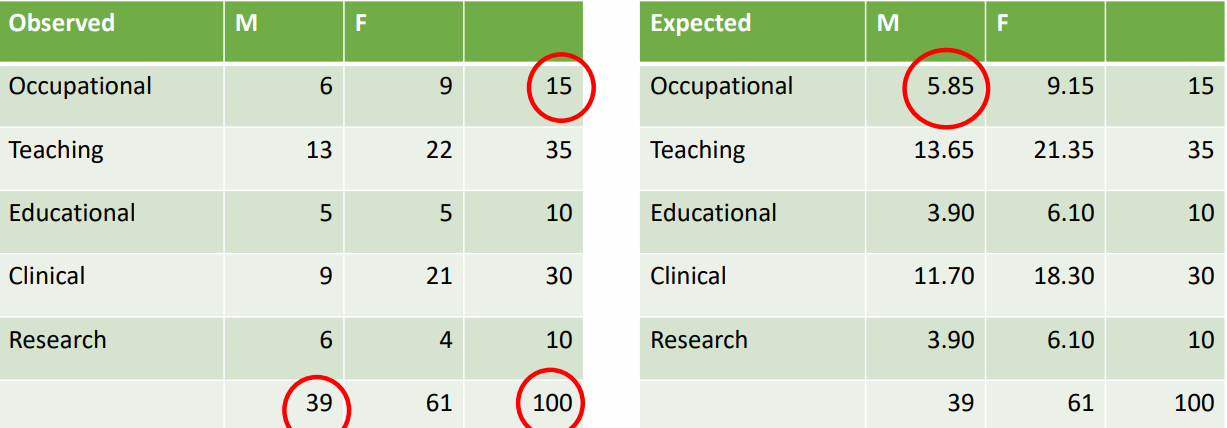
Assumptions:
The expected frequencies for each category should be at least 1.
No more than 20% of the categories should have expected frequencies of less than 5.
The categories are also required to be mutually exclusive and exhaustive.
Violation ex:
Violation: 20% of our cells had an expected frequency of less than 5.
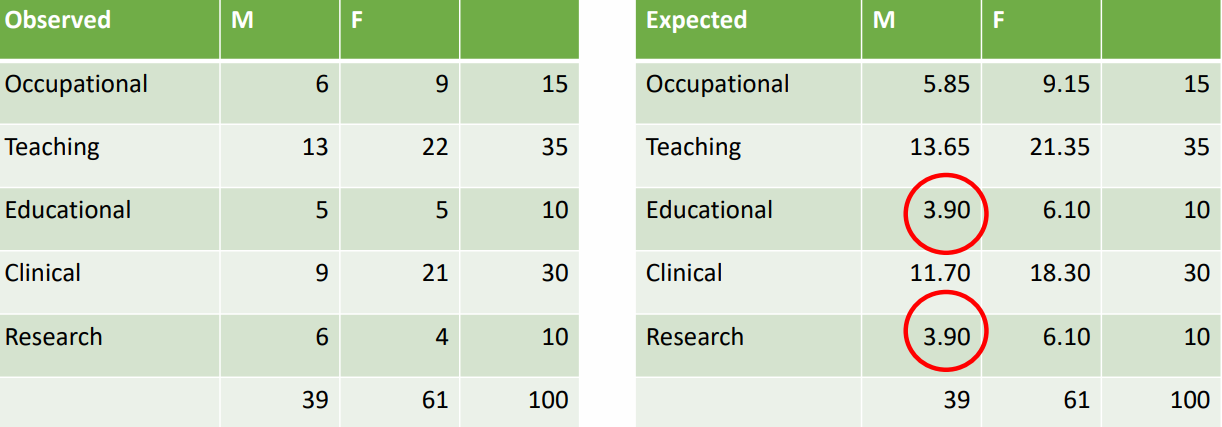
How to handle assumption violations:
Combine categories:
Combining categories that have low expected frequencies into a single category.
This can help increase the expected frequency and ensure that no category falls below the threshold of 5.
Increase sample size:
Collect more data to increase the sample size.
With a larger sample size, the expected frequencies for each category are likely to be higher.
Reducing the likelihood of having categories with expected frequencies below 5.
Analysis:
Analyze → Descriptive Statistics→ Crosstab.
Put one variable in “Row” and other variable in “Column”.
Click “Statistics” and tick “chi-square” → Click “continue” → Click “OK”.
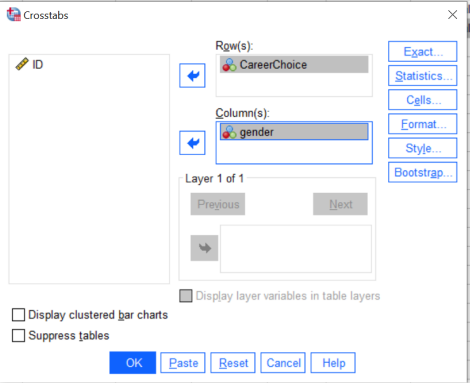
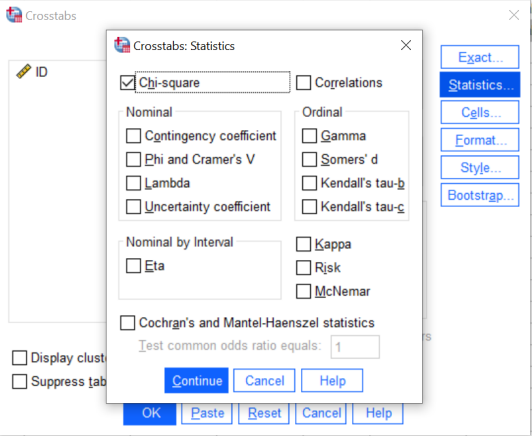
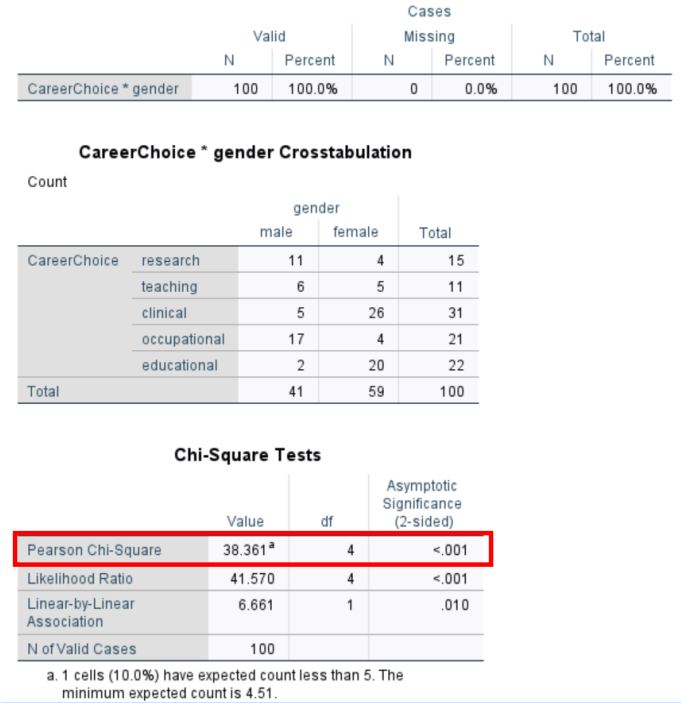
Template:
What test you ran & what variables were plugged in.
Is there a significant difference between frequency and expected.
Report the “equation” with the values.
Interpretation:
If significant: Some categories may have higher / lower frequencies than other.
If not significant: Similar frequencies across categories.
