Example of Steeple Graph and its Analysis
Here's an example of a STEEPLE analysis graph.
Analysis
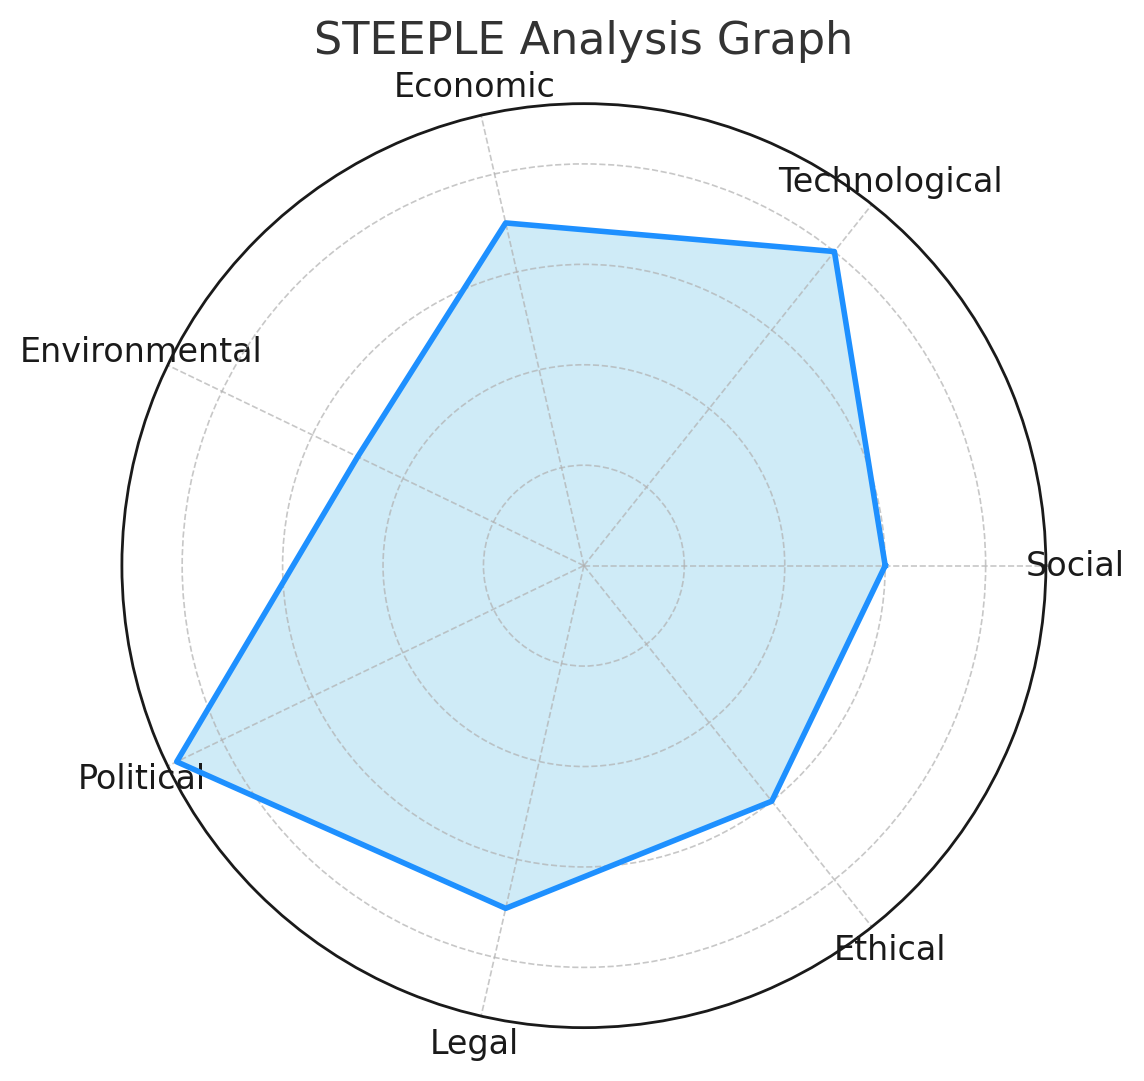
In this graph:
- Political factors score the highest (9), indicating strong governmental influence or stability, which could be favorable or risky depending on the context.
- Technological factors have a high score (8), suggesting a well-developed or rapidly advancing tech environment, which could support business growth.
- Economic and Legal factors are moderately strong (7 each), pointing to a stable economy with clear regulations.
- Social and Ethical factors score (6 each), indicating moderate societal acceptance and ethical considerations.
- Environmental factors are the lowest (5), implying potential challenges related to environmental sustainability or natural conditions that could impact business.
This STEEPLE graph helps visualize key influences across different categories, guiding strategic planning and risk management.