India's Development Story
India's Development Story (1947-2024)
The Four 'L's of Change
Luck
Legacy
Linkages
Leadership
Economic Development in Pre-Colonial Period
GDP growth rate was more than 23% before colonization.
Colonial India was an agrarian economy.
The average annual growth rate was around 4%.
India had the world's largest jute manufacturing industry and the fourth-largest cotton textile industry.
During 1800-1900, Indian exports increased five times with a 70 to 80 percent share of non-manufactured goods.
During 1860-1914, exports were approximately 20 percent.
Problems & Challenges - Eve of Independence
A weakened economy.
Low living levels.
Predominance of agriculture occupations.
Unification of Princely States.
India’s Development Story
Ideas are Implemented.
Ideas are in Progress.
Ideas are in Conflict.
Ideas can be Anticipated.
Idea’s are Implemented
Nation-building process (Democracy and Secularism).
State-led development (Five Year Development Plan).
Economy on Import substitution industrialization.
Emphasized on AgricultureGrowth/Industrialization.
Emphasis on Education, Science and Technology.
Emphasis on Democratic Socialism principles (Land Reforms, CDP-1952).
Green Revolution (1970).
Integrated Rural Development Programme.
→ Nehru’s Visit to Bakaro Steel Plant & Hirakud Dam
Idea’s in Progress
State Driven-Market Driven
Economic Reforms with emphasis on LPG (Liberalization, Privatization, Globalization).
Reforms of Major Laws (SEZ, 2004).
Minimum Government to Maximum Governance.
Emphasis on Single Market (GST).
Emphasis on Infrastructure Development.
Emphasis on Urban Cities.
Political Reforms & Decentralization of power.
Shift from Command Politics to Demand Politics.
Identity politics to development politics.
The Economic Crisis 1991-92
Current Account Deficit - CAD WAS BILLION
The External Debt BILLION
FOREIGN EXCHANGE RESERVES BILLION
HINDU GROWTH RATE OF
INFLATION WAS AT
Decentralisation - 73rd & 74th Amendment
ADMINISTRATIVE STRUCTURE OF INDIA
1) Government of India
2) State Government(s)
3) Division(s)
4) District(s) (Zilla-Parishad)
5) Block(s) (Tehsils)
6) Village(s) (Gram Panchayat) OR
5) Municipal Corporation(s) (Mahanagar-Palika)
5) Municipality(s) (Nagar-Palika)
5) City Council(s) (Nagar-Panchayat)
6) Ward(s)
Government to Governance
GOOD GOVERNANCE
Consensus-oriented
Participatory
Follows the rule of law
Accountable
Transparent
Responsive
Equitable and inclusive
Effective and Efficient
GDP per capita, 1950 to 2018 (GRAPH)
GDP per capita adjusted for price changes over time (inflation) and price differences between countries
It is measured in international-$ in 2011 prices.
Includes chart comparing China and India from 1950 to 2018
INDIA 75 - Where are we heading (GRAPH)
COMPETITIVE VALUE OF THE RUPEE
Rs. COST OF LIVING IN INDIA AMONG LOWEST IN THE WORLD
CURRENCIES CAN BUY MORE (Switzerland, Saudi Arabia, Brazil, China, Mexico, Turkey, Malaysia, India, South Africa, Indonesia, Romania)
GDP growth rate compared to previous year (GRAPH)
India: GDP Growth Rate from 2004 to 2014
Includes bar graph showing India's GDP growth rate
INDIA 75 - Where are we heading (GRAPH)
SUSTAINING HIGH GROWTH IS DIFFICULT
INDIA HAS DONE WELL SO FAR (COUNTRIES WITH 5% GROWTH) - Includes details of countries with 5% growth for:
One Decade
Two Decades
Three Decades
Four Decades
Five Decades
Our Progress So Far - INDIA COMES FULL CIRCLE 1950-2020 - (GRAPH)
WORLD RANKINGS BY NOMINAL GDP - Includes charts of World Rankings by Nominal GDP for years: 1950, 1960, 1970, 1980, 1990, 2000, 2010, 2020
India’s Impressive Growth
World’s 4 largest economy ( Trillion USD), high growth rates, amongst world’s richest persons, a billion mobile phones, better services for middle class
Annual growth of GDP per capita, 2021 (GRAPH)
This data is adjusted for inflation.
GDP Rates in State Domestic Products Across Plan Periods (GRAPH-2)
States/Union Territories - Includes table of GDP rates for States across plan periods (Eight, Ninth, Tenth, Eleventh Plan)
Policies Related to Economic Development
Monetary and Fiscal Policy (, March 2024)
Foreign Direct Investment (US billion for the financial year 2022 to 2023)
Easy Doing Business (134 in 2014 to 63 in 2021)
Urban Development Programmes (100 Smart City)
Diversification of Economy (Industry, Agriculture, Service)
Make in India Programme
Start-up and Innovation, Mudra Yojana (SMES)
GST (One Nation-One Tax Policy)
Strengthened Supply Chain (Infrastructure Development)
URBAN DEVELOPMENT PARADOX:
While urban areas have witnessed significant growth and investment, challenges like housing scarcity and pollution persist, highlighting the need for sustainable urban planning strategies.
Right Based Approach - 2004-2014
Right to Information Act-2005
Right to work Act (MGNREGA)-2005
Right to Forest Act-2006
Right to Education Act-2009
Street Vendors (Protection of Livelihood and Regulation of Street Vending) Act, 2012
Right to Food Security Act-2013
Right to Land, Resettlement and Rehabilitation Act-2013
Indian Companies Act-2013
Prohibition of Manual Scavengers Act-2013
Idea’s in Conflict
Social Divisive System (Caste, Religion)
Labour Reforms
Educational Reforms
Displacement
Disaster
Disparity
Decline
Labour Issues and Need For Reforms in India
Educational Reform
Pressure or Perfection
The NCRB 2023 report added, “The incidence of student suicides continues to surpass both population growth rates and overall suicide trends. Over the last decade, while the population of 0-24-year-olds reduced from 582 million to 581 million, the number of student suicides increased from 6,654 to 13,044.”
The report reveals that Maharashtra, Tamil Nadu, and Madhya Pradesh have the highest rates of student suicides, representing one-third of the total incidents nationwide.
The report also highlighted a significant rise in student suicides, showing a 50 per cent increase in male suicides and a 61 per cent increase in female suicides over the last ten years.
Dominant vision of 'development'
Violence against nature, communities, and cultures …
Displacement
Impact on Livelihood through Displacement
The natural rights of the tribals on forest land and forests are being progressively appropriated by Indian corporations and MNCs, thus causing serious disadvantage to both income and employment of tribals.
As s result of globalization and liberalization, a systematic process of exploitation of tribal communities has been unleashed.
Forced displacement in the name of Development
In many places tribals have been displaced irrespective of their protest, to meet the requirements of MNCs
Question comes here : Development for whom? At what cost? Who should pay that cost?
Since Independence around 60-65 million people have been displaced in India due to development project, Majority are SC and STs ( IDMC, 2018)
Results of Forced Displacement: Joblessness, Homelessness, Social Exclusion, Marginalization, Food Insecurity,Loss of Culture and tradition
Left-wing extremism (GRAPH)-MAP
Includes details from 2015 data from South Asia Terrorism Portal (Number of LWE districts, Worst affected LWE districts, LWE districts to be taken off, Number of LWE areas, Police station wise LWE areas to be taken off)
Urban Development and Displacement
Various Causes of Urban Displacement:
(i)Urban Economic growth
(ii) Environmental improvements
(iii) Slum Upgrading
(iv) Bourgeois Environmentalism
Magnitude of Displacement:
90,000-Mumbai, Mumbai Metro, Navi Mumbai Airport (2004-05)
77,000-Kolkata,Salt Lake City, New Town ship (2004-05)
300,000-Delhi, Riverfront, Common Wealth Game (2010)
35,000-Ahemdabad, Sabarmati Riverfront project (2005-06)
19,000-Bangalore Metro project (2009-10)
27,000-Hyderbad, MMTS Rail project, New Airport (2003-06)
Disaster
‘Development’ has destroyed India’s environment & livelihoods
50% forest destroyed in last 200 years
70% waterbodies polluted or drained out
40% mangroves destroyed
Nearly 10% wildlife threatened with extinction
Many lakes and cities drowning in garbage
Disastrous impacts on ecosystem-dependent people (60-70% of India’s population)
POLLUTION, WATER, LAND STRESS
AIR POLLUTION:-
“14 OF THE WORLD’S 20 MOST POLLUTED CITIES – IN INDIA”, “caused the deaths of 1.2 million people in India in 2017”
of India's Land area under Severe Degradation/ Undergoing desertification
CLIMATE CRISIS: In 12 days, August 2019, 1,000 extreme rain events; Forest fires increased 158% in 6 years; Heat waves in India to increase 3-4 times.
Disparity
South vs North - BOOK
State’s share of national GDP (GRAPH)
All figures in percentage %
India is presently on track to become the 3rd-largest economy by 2030
Includes percentage of states share of national GDP
Socio-economic impacts: growing inequities
Richest - 10% & they earn 57% of national income
The middle class is also relatively poor, with an average wealth of only Rs 723,930
Includes depiction of Wealth Distribution in India
Disparity - Monthly Income of Farmers in India
Includes chart of Monthly Income of Farmers in India by state.
OVERALL INDIA - Rs. 10218
Business, Politics & Media Nexus
Politics, Business and Media Nexus
The new age of Crony Capitalism
INDIA 75 - OUR PROGRESS SO FAR (GRAPH)
Idea’s Can be Anticipated
Deepening Democracy
Decentralization (Globalisation to Localisation)
Diversification of Economy (Juggad to Innovation, Digitalisation )
Demographic Dividend
Democracy with Development
Direct democracy / swaraj (local to national): power in hands of people: gram sabhas, urban area sabhas, adivasi assemblies, etc.
Recognising traditional governance institutions, with necessary modifications
Delegated/representative democracy, with mechanisms of accountability (right to recall, public audit, reporting back…)
SOCIO-CULTURAL DEMOCRACY
Culture / knowledge
Respecting language/cultural diversity (e.g. education in mother tongue)
Recognising multiple knowledge systems (e.g. amchi & allopathy)
Integrating them in educational and R&D institutions (e.g. DDS Krishi Vigyan Kendra)
Encouraging knowledge commons, rather than privatisation (e.g. open source technologies & software)
Recognising ‘ordinary’ people as innovators(e.g. Honeybee network)
SUSTAINING RELATIONSHIP WITH/IN NATURE
Eco Democracy/ Recognising humans as part of nature
Respecting rest of nature (ethical / spiritual / rights)
Conservation, sustainable use
SUSTAINING RELATIONSHIP WITH/IN NATURE
Gram swaraj & rural revitalisation: Outmigration is not inevitable
Ralegan Siddhi & Hivare Bazaar (Maharashtra), Kuthambakkam (TN),Kudumbashree (Kerala)
Can India achieve rural revival to stem out migration?
Self-governance & conservation: Mendha-Lekha (Maharashtra)
All decisions by consensus in gram sabha (village assembly)
“Our government in Mumbai and Delhi, we are the government in our village”
2013: all private farmland converted to village commons
Dalit women farmers of Deccan Development Society (Telangana)
Organic agriculture, seed diversity, land rights: anna swaraj
Seeds, water, media as the commons, not privatised
Run Krishi Vigyan Kendra with agricultural scientists
Transformation in nutrition/food security, & in gender, caste, class relations
Dalit women farmers of Deccan Development Society (Telangana)
Kudumbashree, Kerala: dignified livelihoods, empowerment of women, rapid COVID response
Diversification of Economy
Localisation of economy
Self-reliance for basic needs
Economy of caring & sharing
Re-commoning nature, knowledge, technology
Beyond GDP: real indicators of well-being & happiness
Juggad to Innovation
Kachchh / Ladakh - Water self-sufficiency in low rainfall regions in face of climate change
From Villain to Hero of 21st Century
India has 112 million working-age people between the ages of 20 and 24, compared to China’s 94 million.
In the absence of government jobs, this demographic dividend is accelerating the country’s startup culture.
As of August 29, 2022, India had emerged as the world's third-largest startup ecosystem.
Over 77,000 DPIIT-recognized startups spread throughout 656 districts.
These startups are simultaneously enabling more jobs than large companies or enterprises in the same industry.
INDIANS WHO GAVE UP THEIR CITIZENSHIP FOR
Includes List of top countries where Indians are giving up their citizenship.
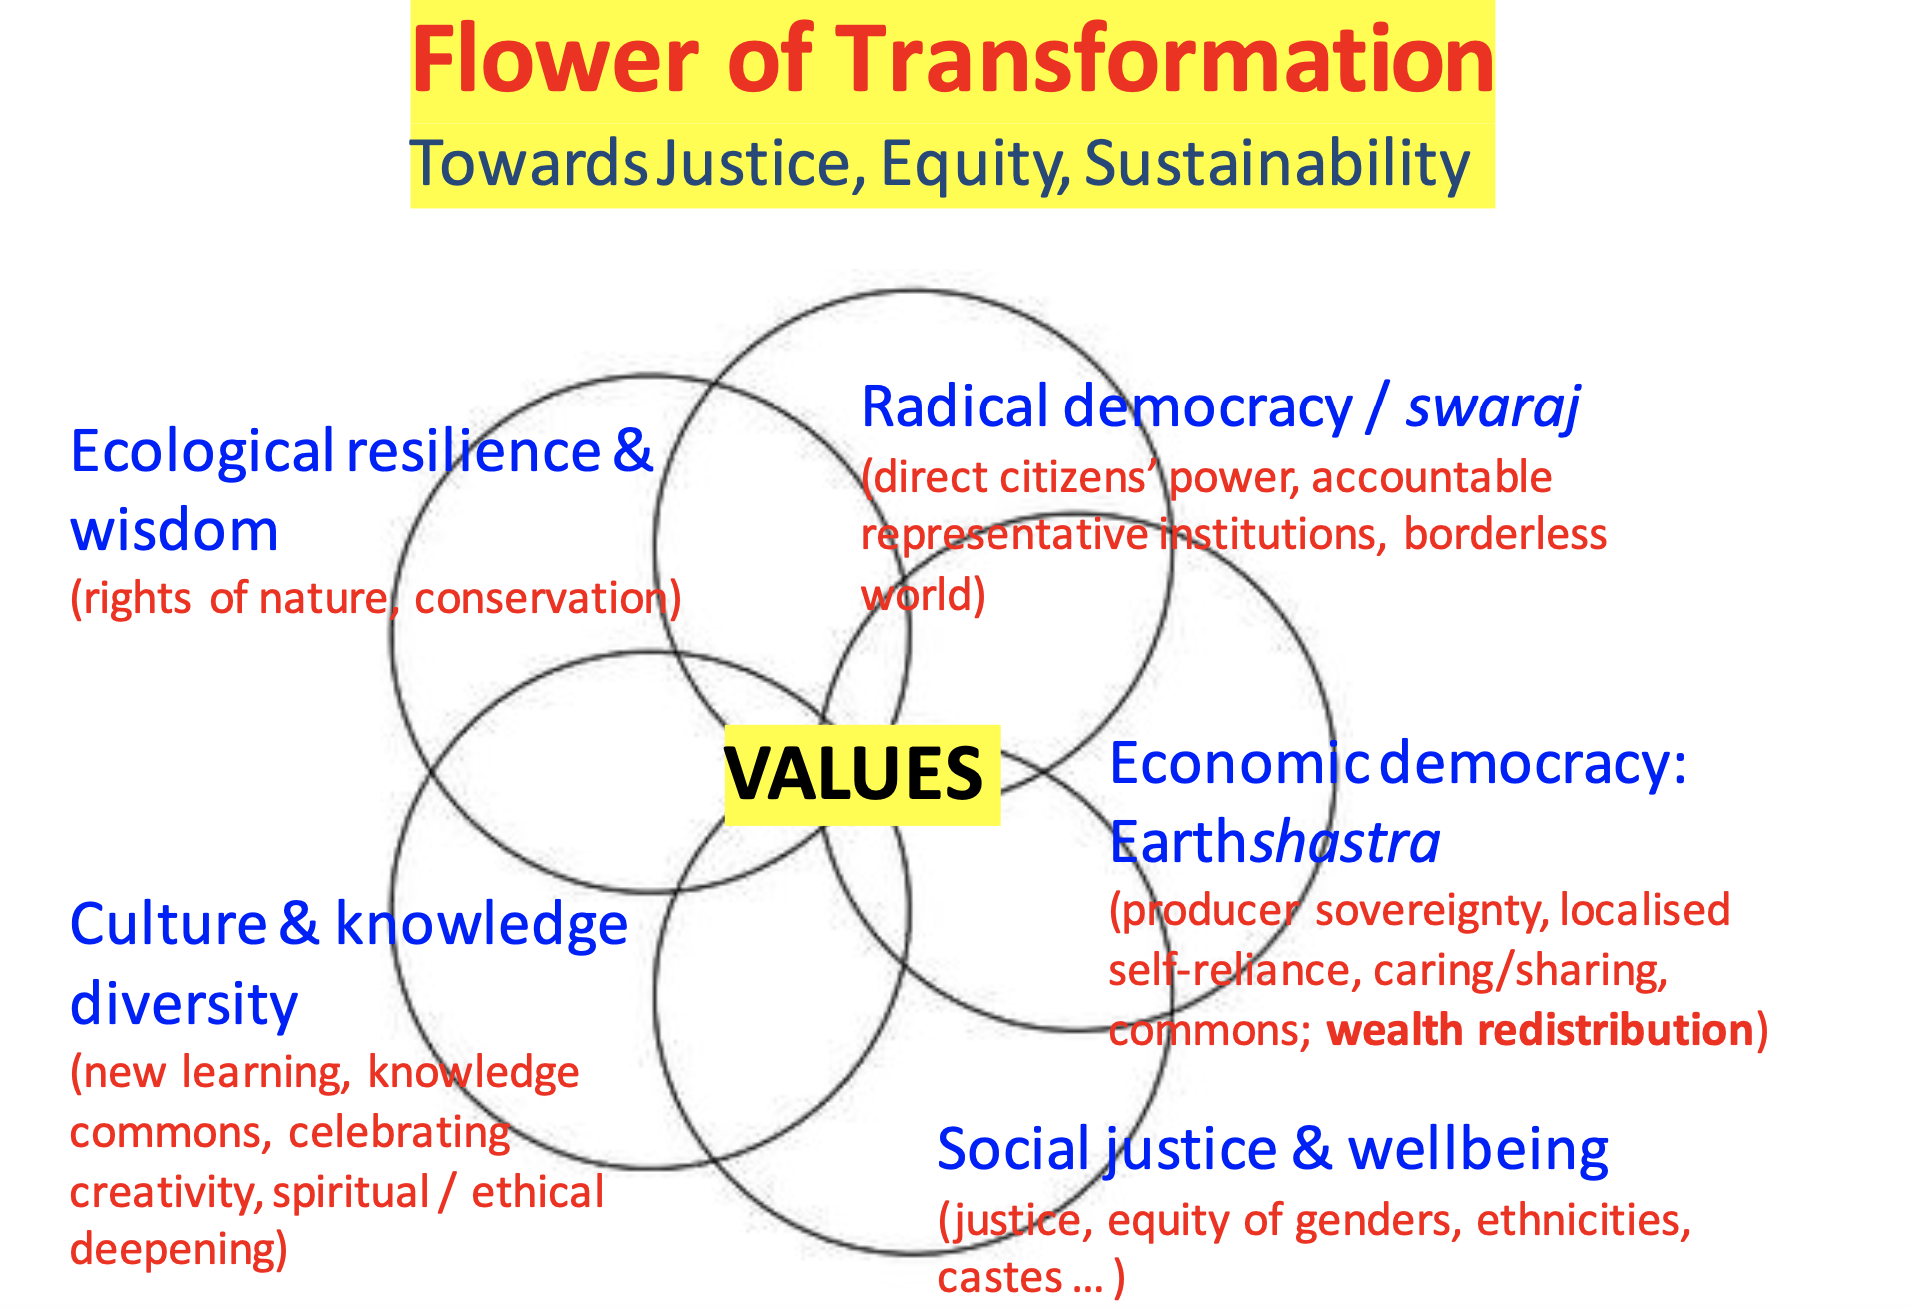
Transformation Towards Justice, Equity, Sustainability - VALUES
Ecological resilience & wisdom (rights of nature, conservation)
Radical democracy / swaraj (direct citizens’ power, accountablerepresentative institutions, borderless world)
Economic democracy: Earthshastra (producer sovereignty, localised self-reliance, caring/sharing, commons; wealth redistribution)
Social justice & wellbeing (justice, equity of genders, ethnicities, castes…)
Culture & knowledge diversity (new learning, knowledge commons, celebrating creativity, spiritual / ethical deepening)