Lecture 7: Regression Discontinuity Design
1/130
There's no tags or description
Looks like no tags are added yet.
Name | Mastery | Learn | Test | Matching | Spaced |
|---|
No study sessions yet.
131 Terms
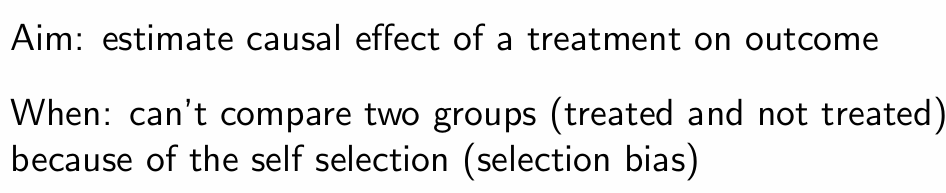
What is the aim of regression discontinuity and when do we use it?
How can we use DAGs to represent regression discontinuity?
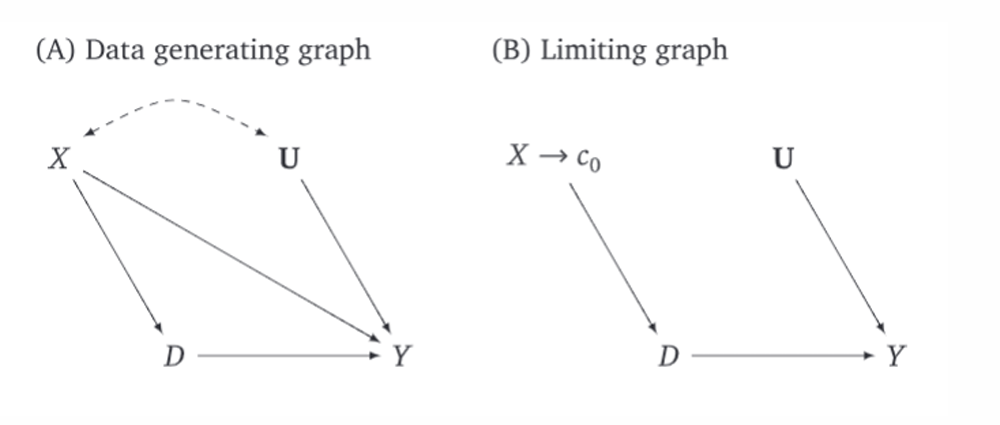

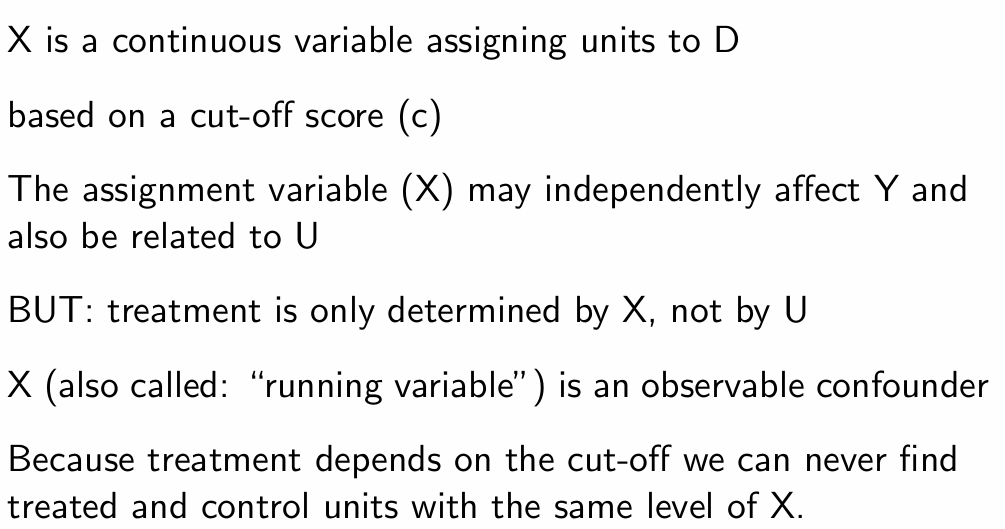
What can we see in the DAGs?
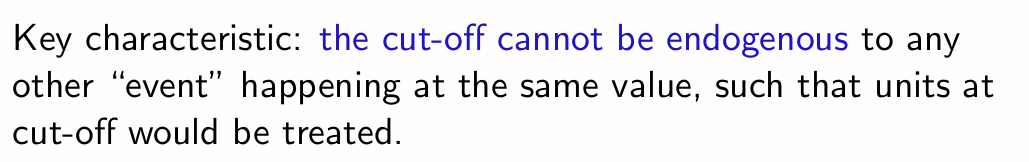
What is the key characteristic of the cut-off?
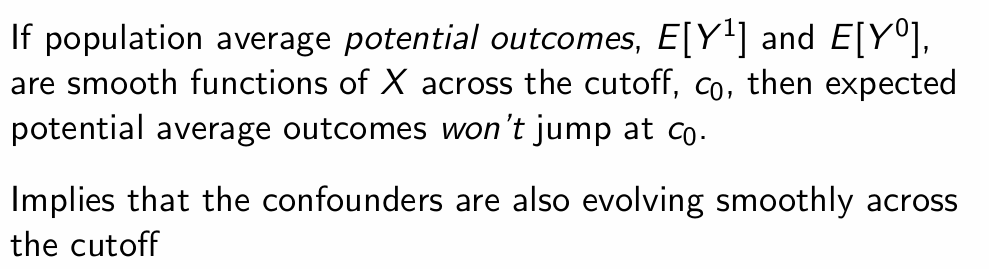
What do we assume about potential outcomes at the cut-off?
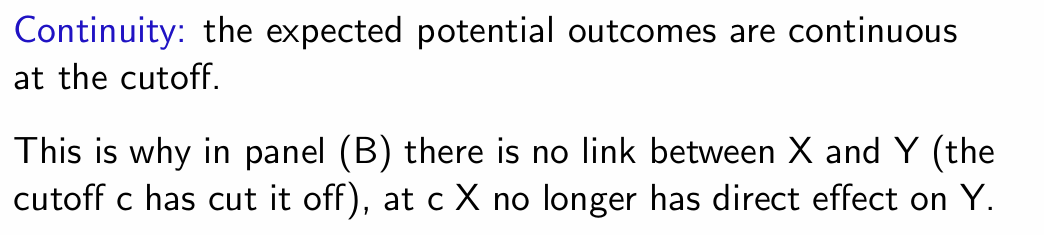
What happens to the probability of treatment assignment at c?
Jumps discontinuously
How do we then estimate a treatment effect and what treatment effect do we estimate?
Compare people above and below c to estimate an average treatment effect (LATE)
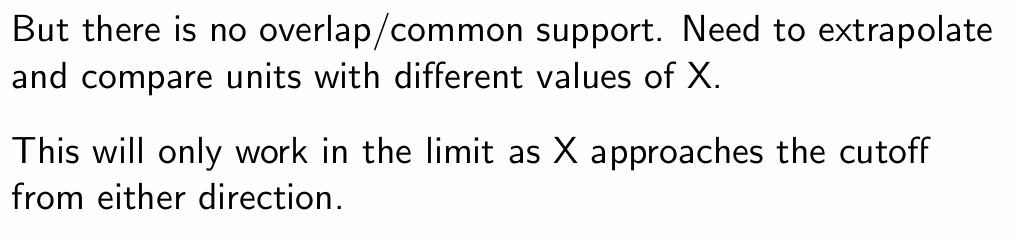
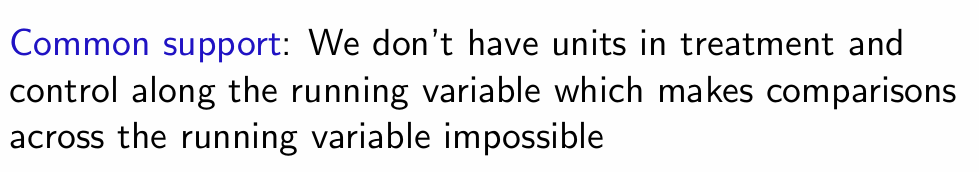
Given there is no overlap of distributions (no common support) what do we have to do? And only when will this work?
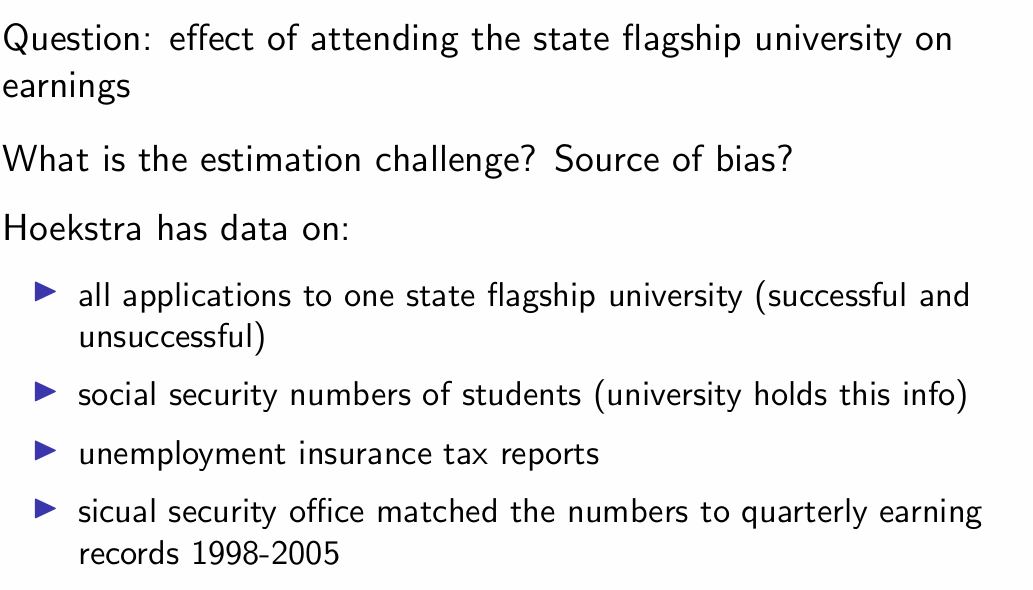
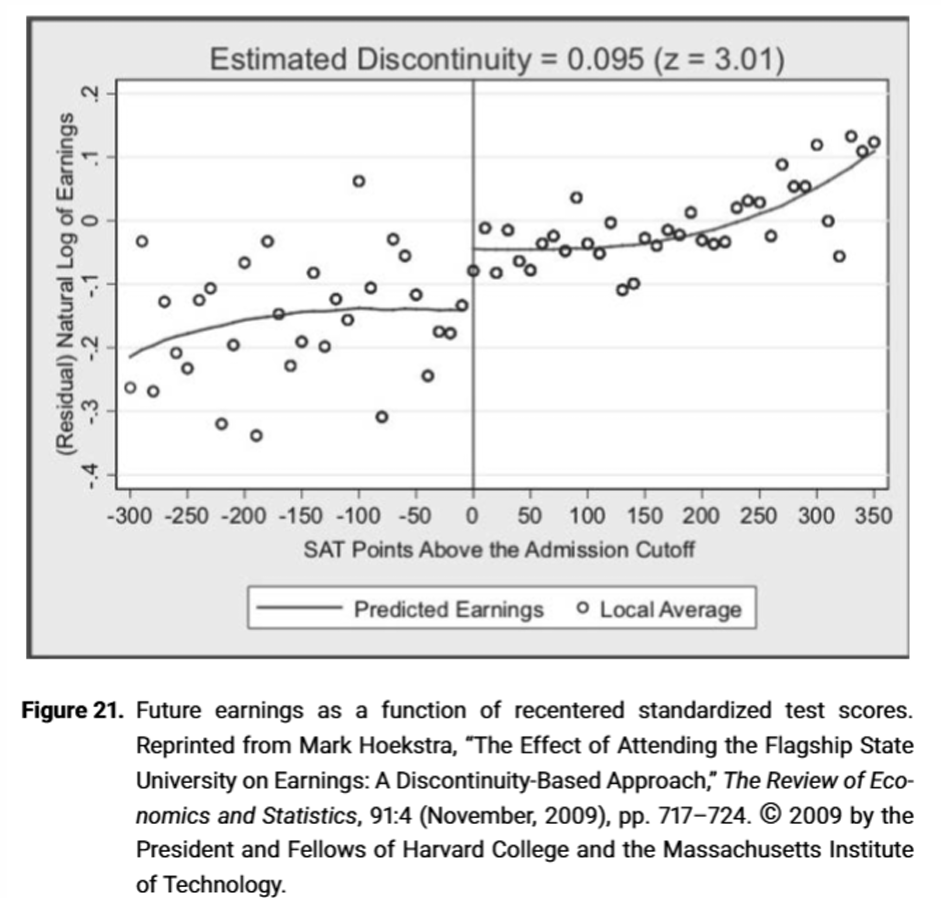
What was the research question by Hoekstra (2009)?
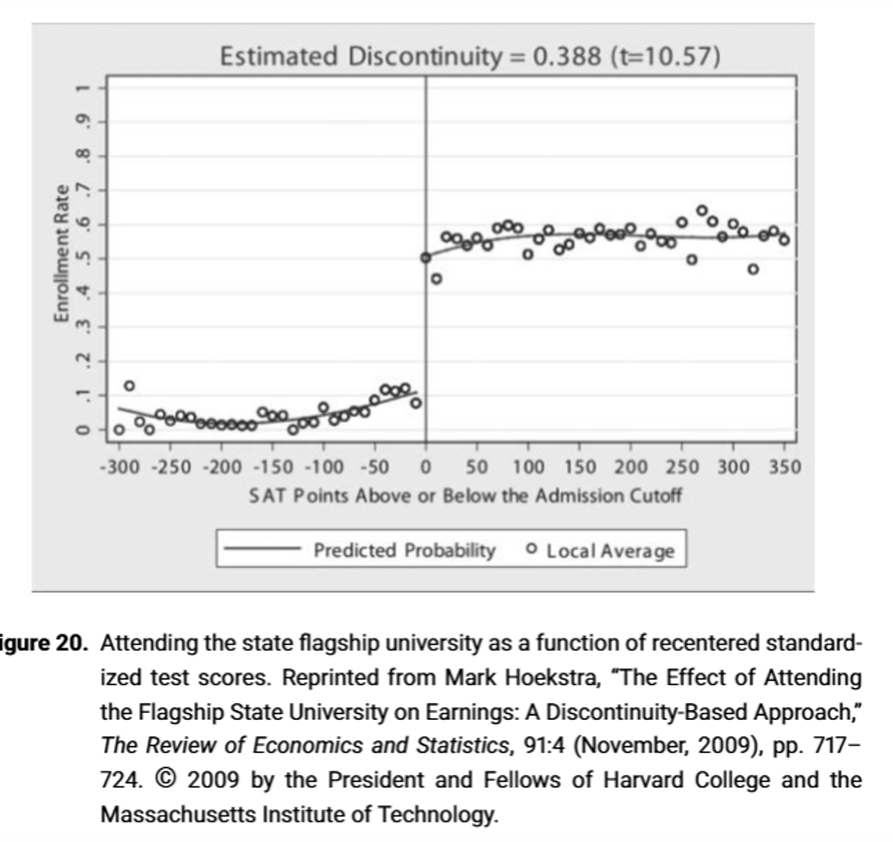
What can we see here?
X
What regression was used by Hoekstra (2009)?
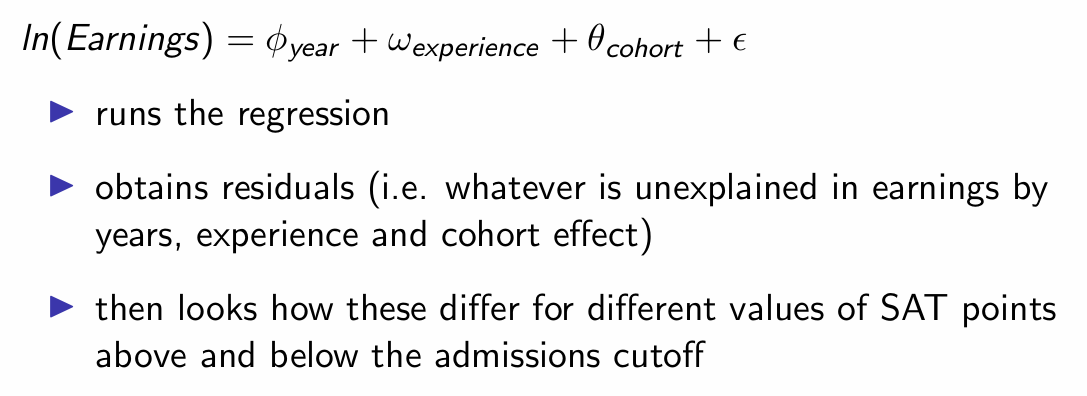
What does the output tell us?
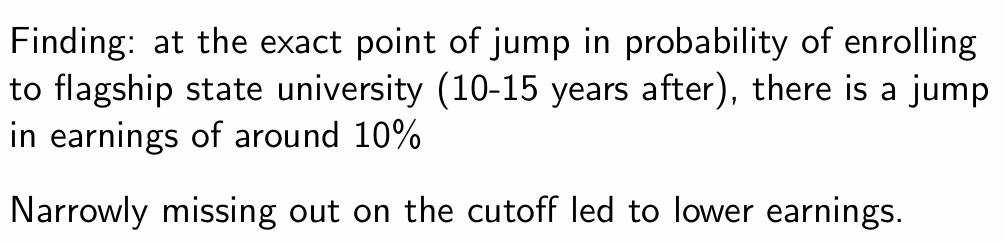
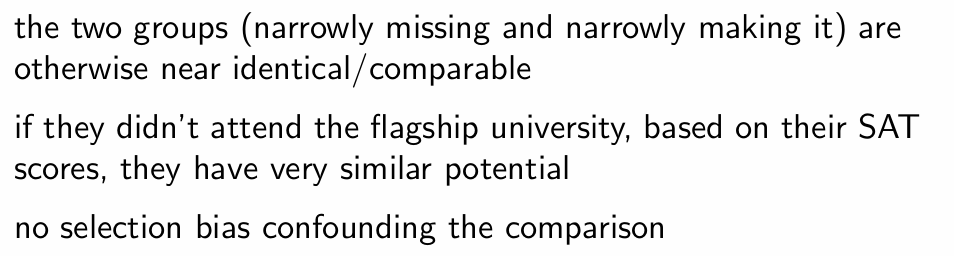
Why is Hoekstra (2009) a good example of a natural experiment?
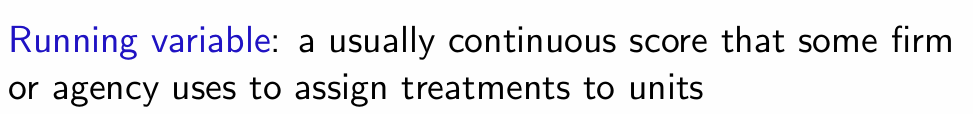
What is a running variable in RDD?
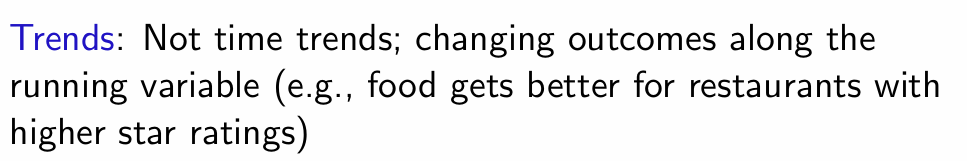
What are trends in RDD?
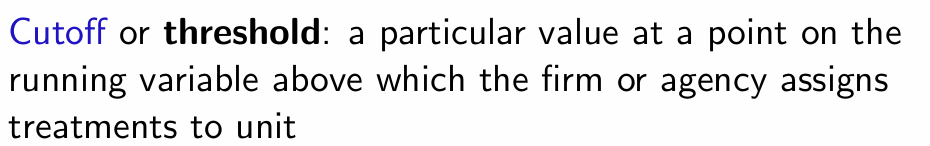
What is a cut-off (threshold) in RDD?
What is discontinuity (jump) in RDD?

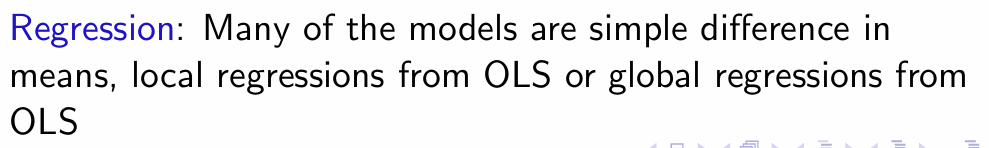
What is a regression in RDD?
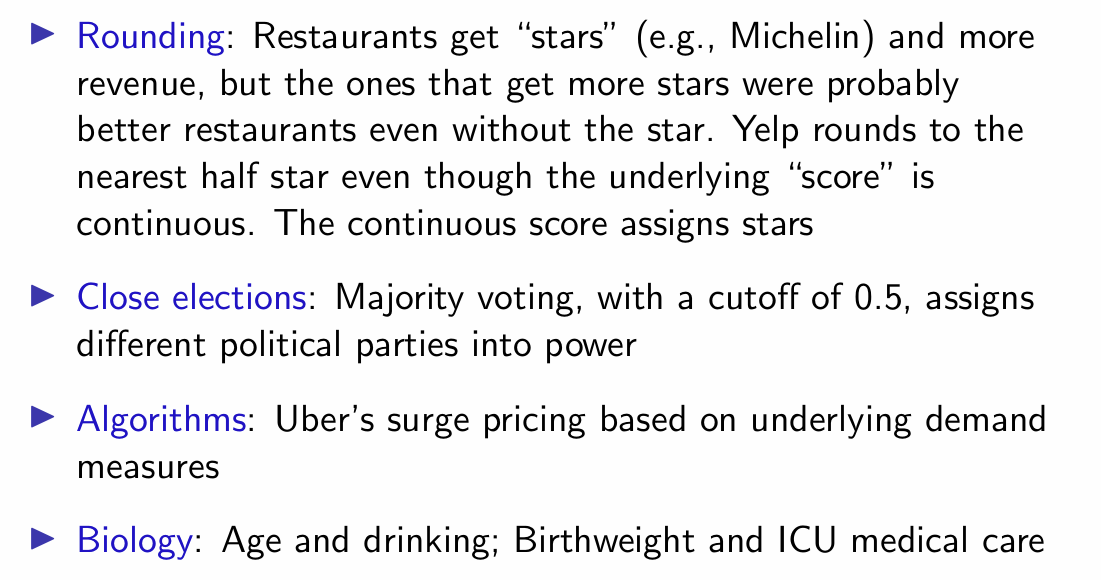
What are some examples of thresholds that RDD can be used to explore?
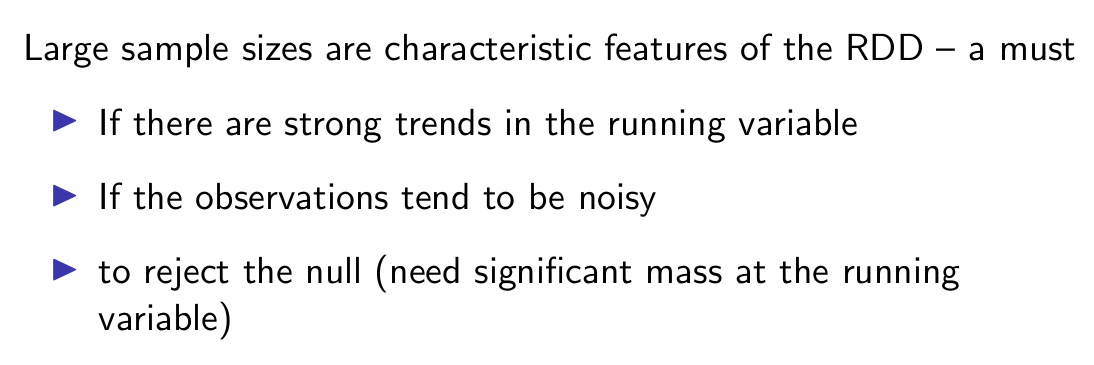
Why do we need a large sample size for RDD?
What are the two main types of RDD?
Sharp and Fuzzy
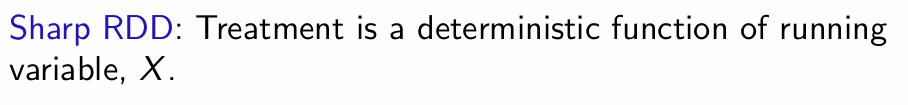
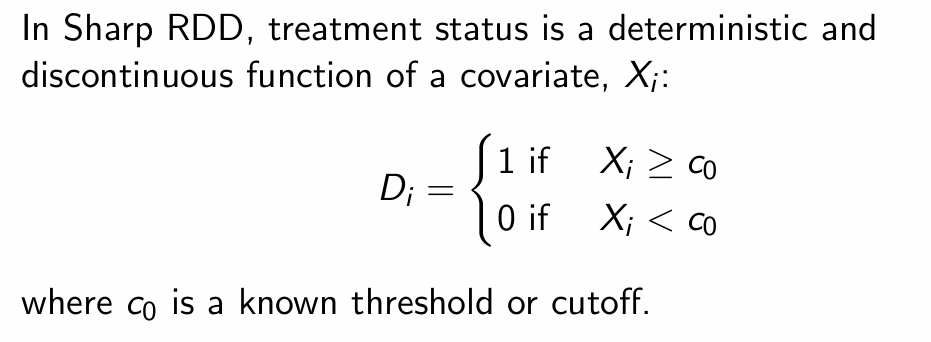
What is Sharp RDD?
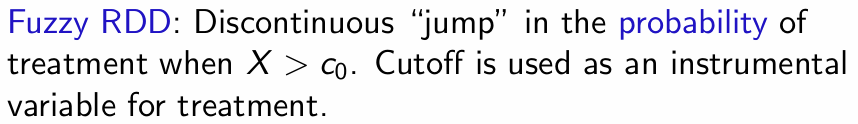
What is Fuzzy RDD?
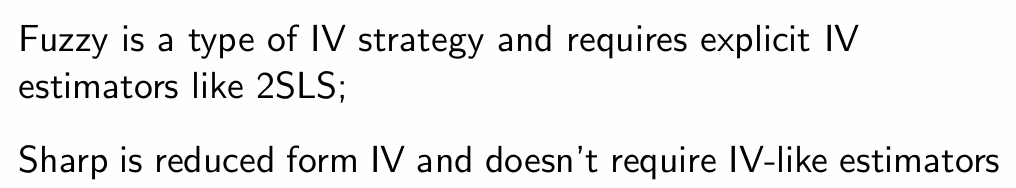
How do Sharp and Fuzzy RDD compare in regards to IV?
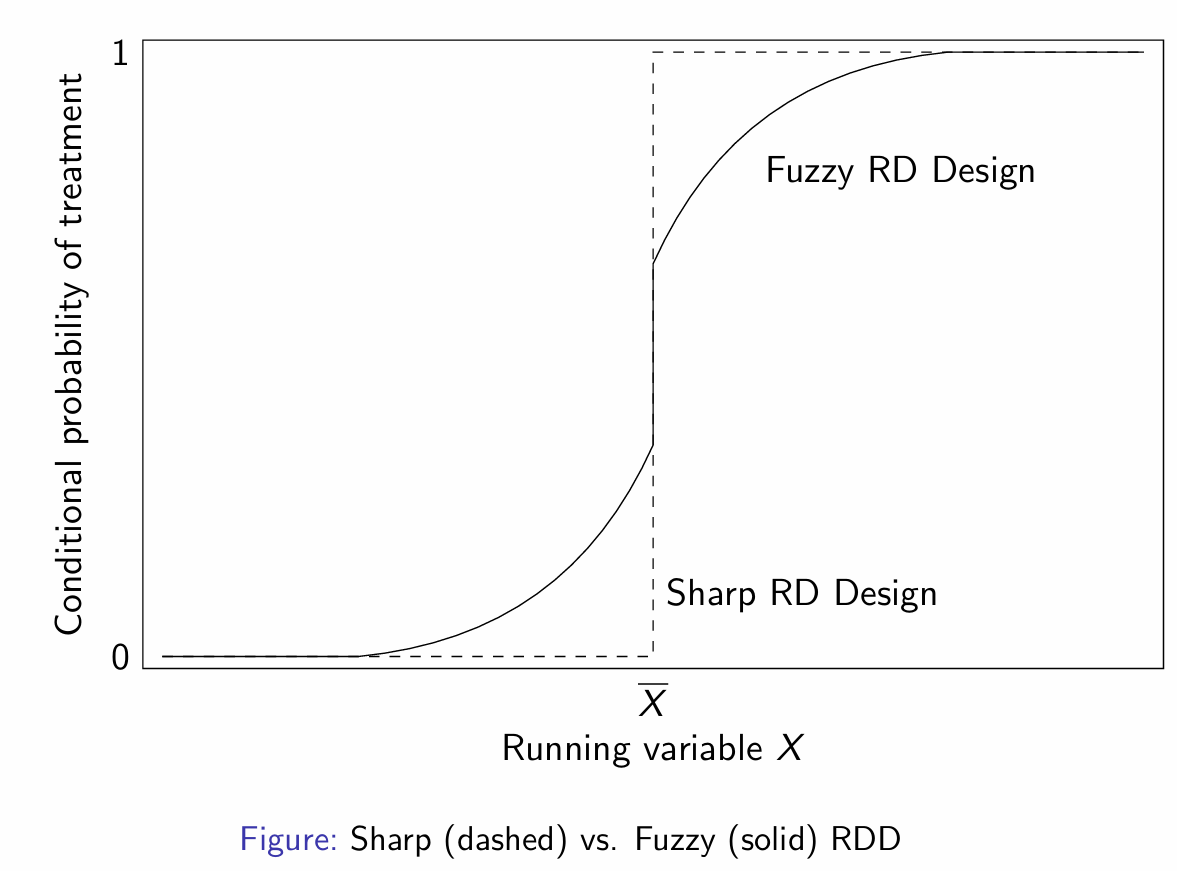
How do Sharp and Fuzzy RDD compare graphically?
Why do we not have common support for RDD?
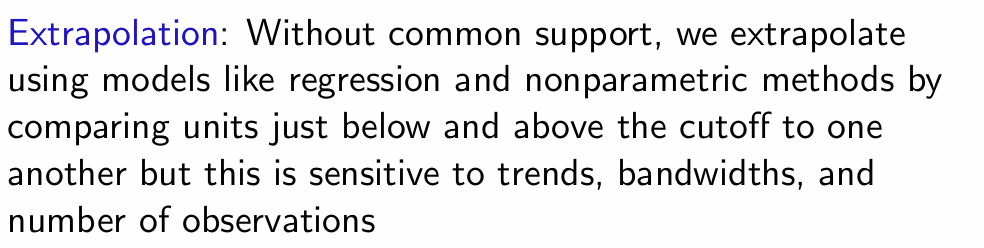
Why do we have to extrapolate?
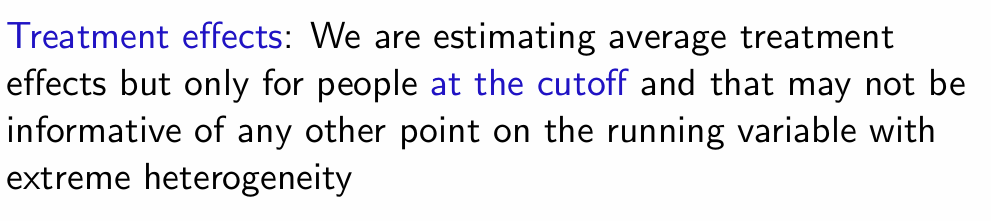
Why is the estimation of a LATE in RDD an issue?
How do we define deterministic treatment assignment (sharp RDD)?
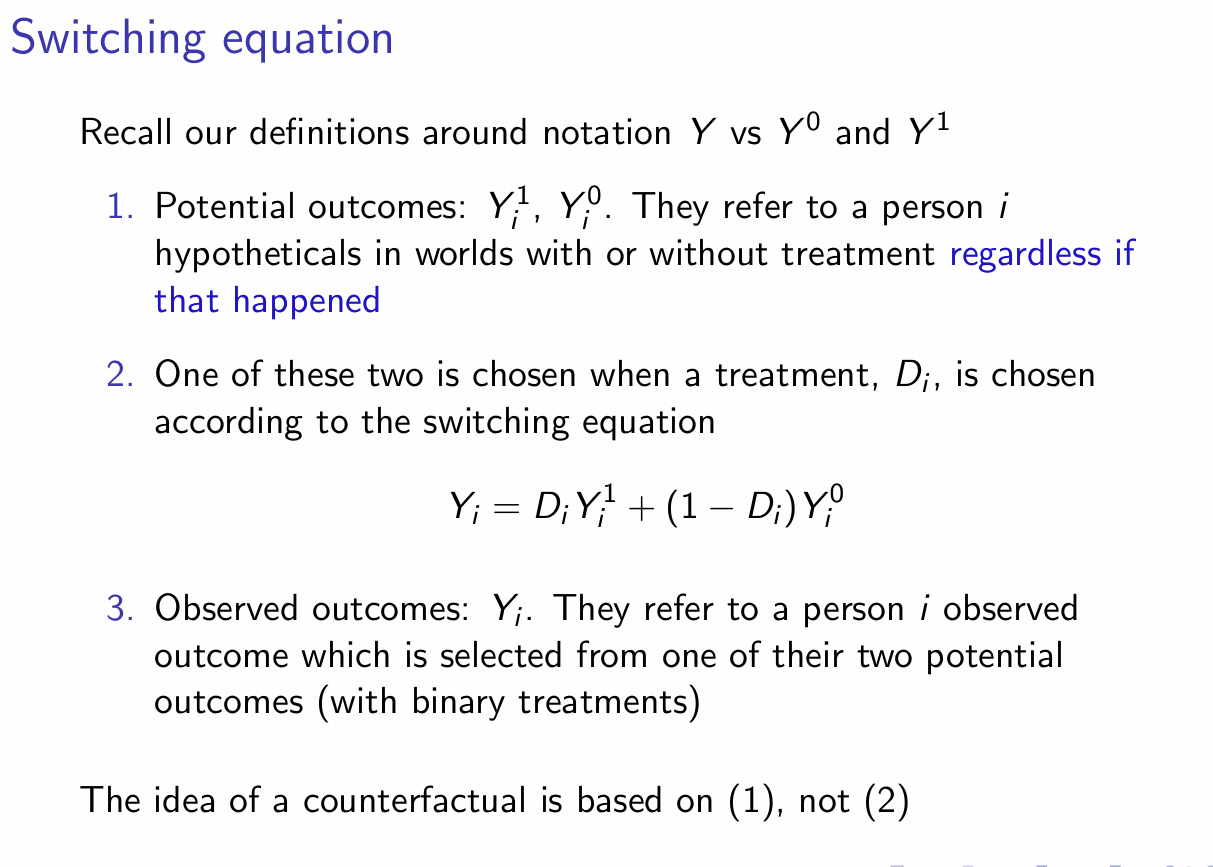
How can we use POF and the switching equation to create a regression equation?
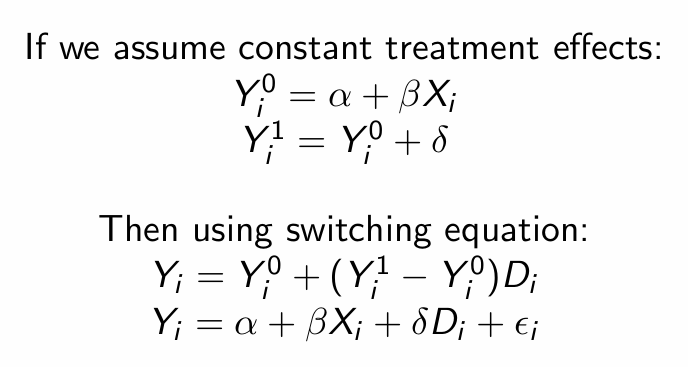
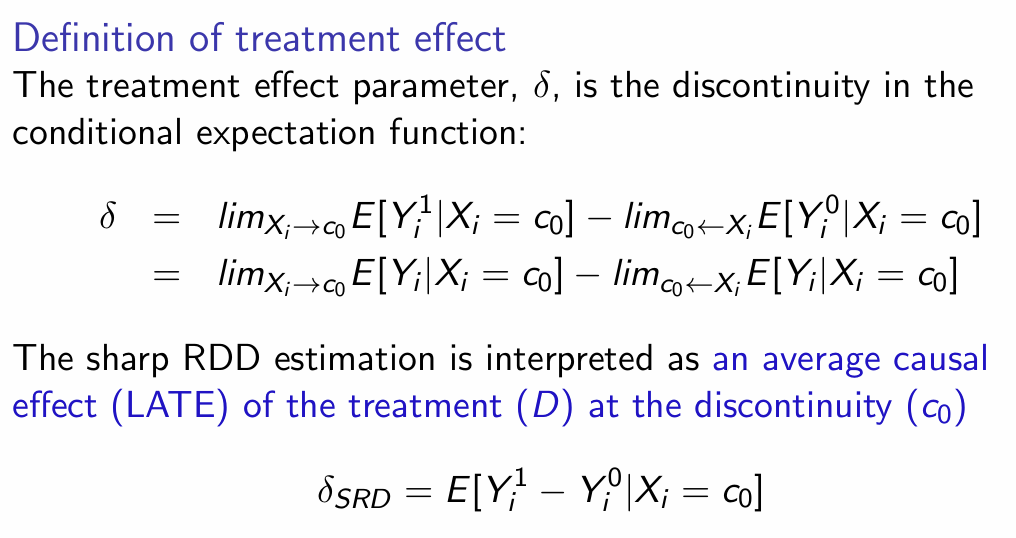
How do we define the treatment effect in sharp RDD? And the LATE?
How does extrapolation look graphically for RDD?
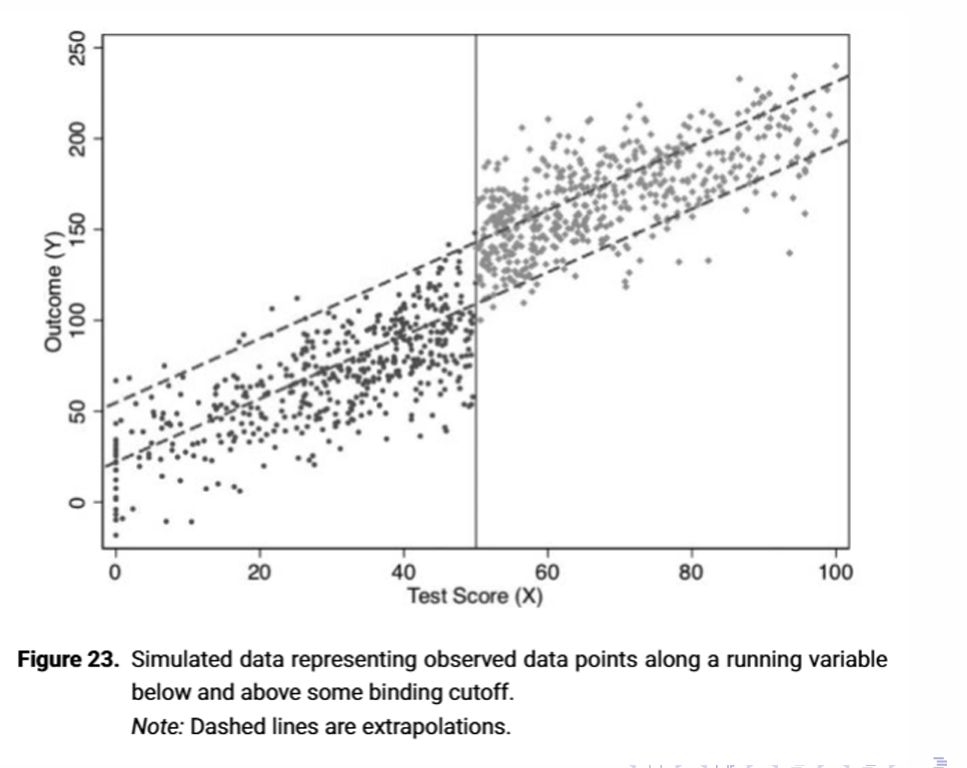
What does this tell us about confounders?
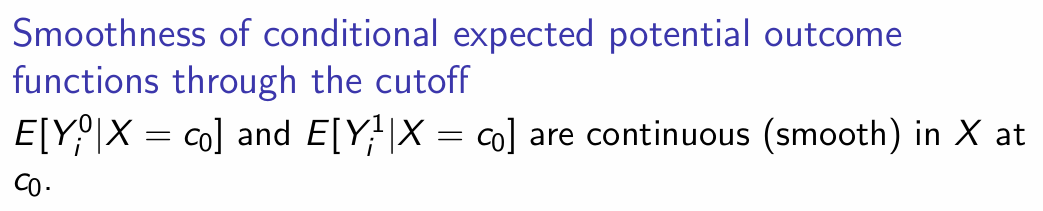
How do smoothness and the treatment effect look graphically?
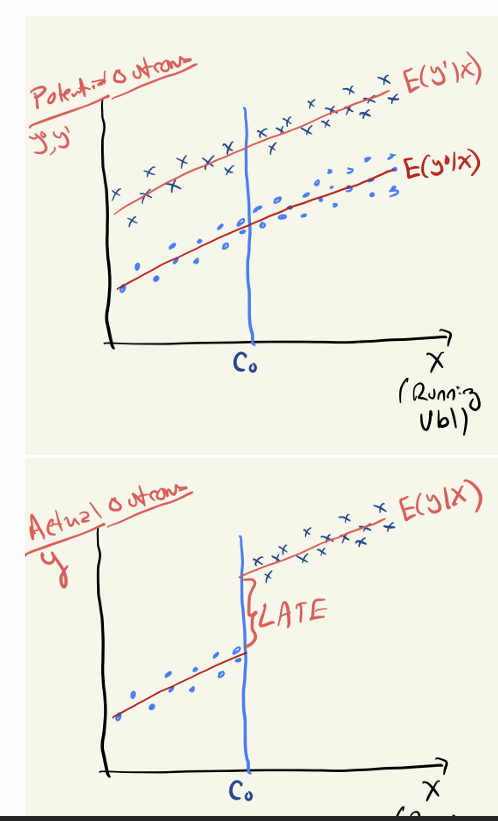
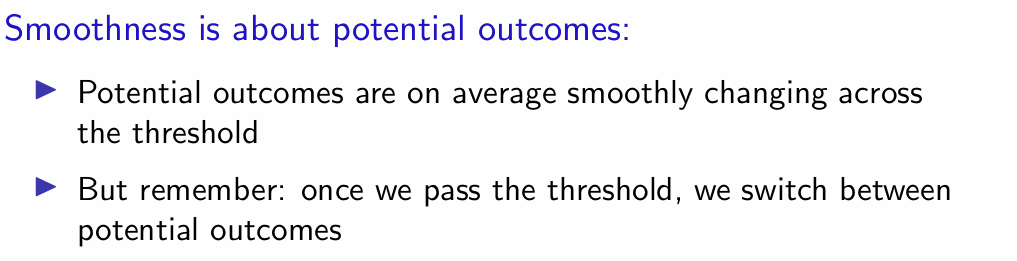
Which outcomes are relevant to smoothness and why?
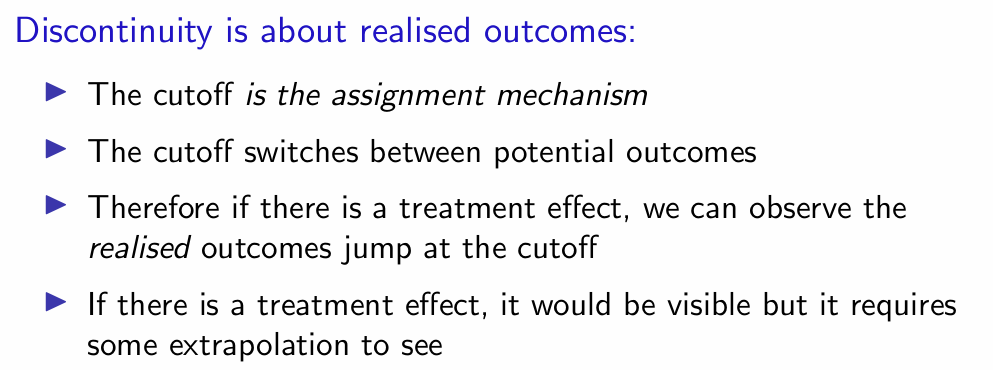
Which outcomes are related to discontinuity and why?
What does smoothness justify?
At what point is the average causal effect defined?
At the cut-off
What data is used for the estimation?
Data left and right around the cut-off
Are identification and estimation the same thing?
No
What gives the estimates a causal interpretation?
Smoothness
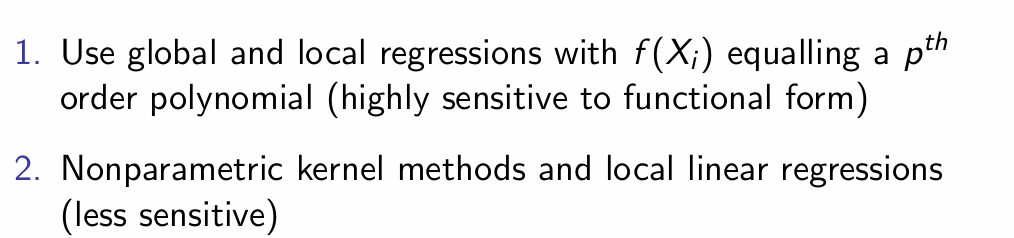
What are two ways to estimate the treatment effect at X = c0?
When is the ATE under sharp RDD unbiased?
How do we predict expected conditional counterfactuals in RDD?
Using data on the other side of the cut-off
What is the actual aggregate causal effect?
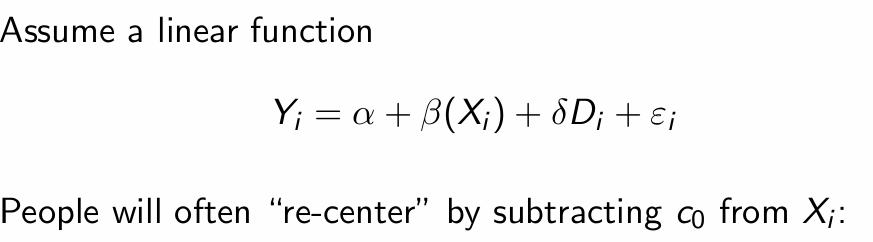

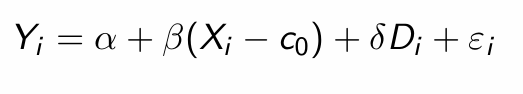
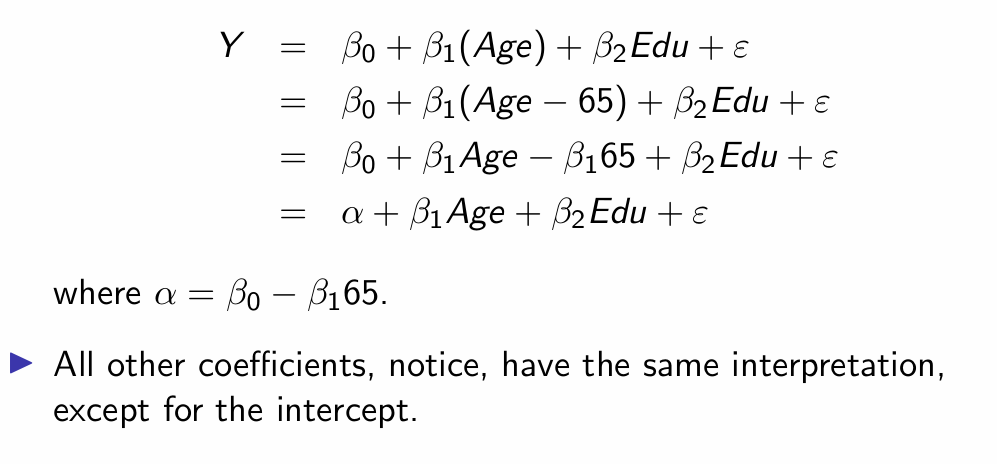
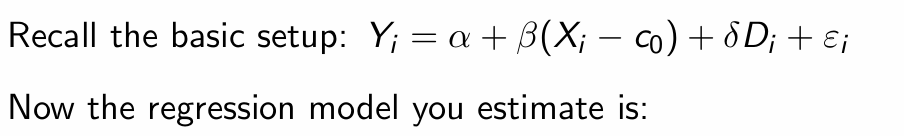
What has/hasn’t changed from re-centering?
What does smoothness assume?
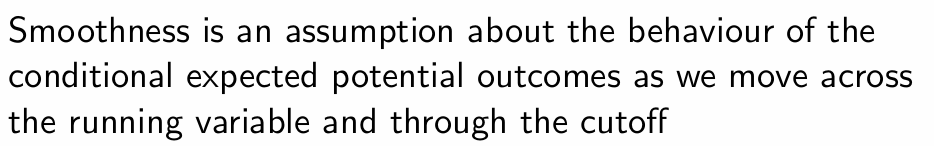
What does smoothness not imply about the evolution of expected potential outcomes?
Does not imply linear evolution
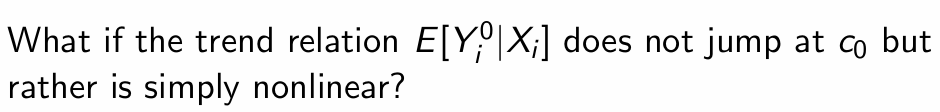
Could produce spurious results
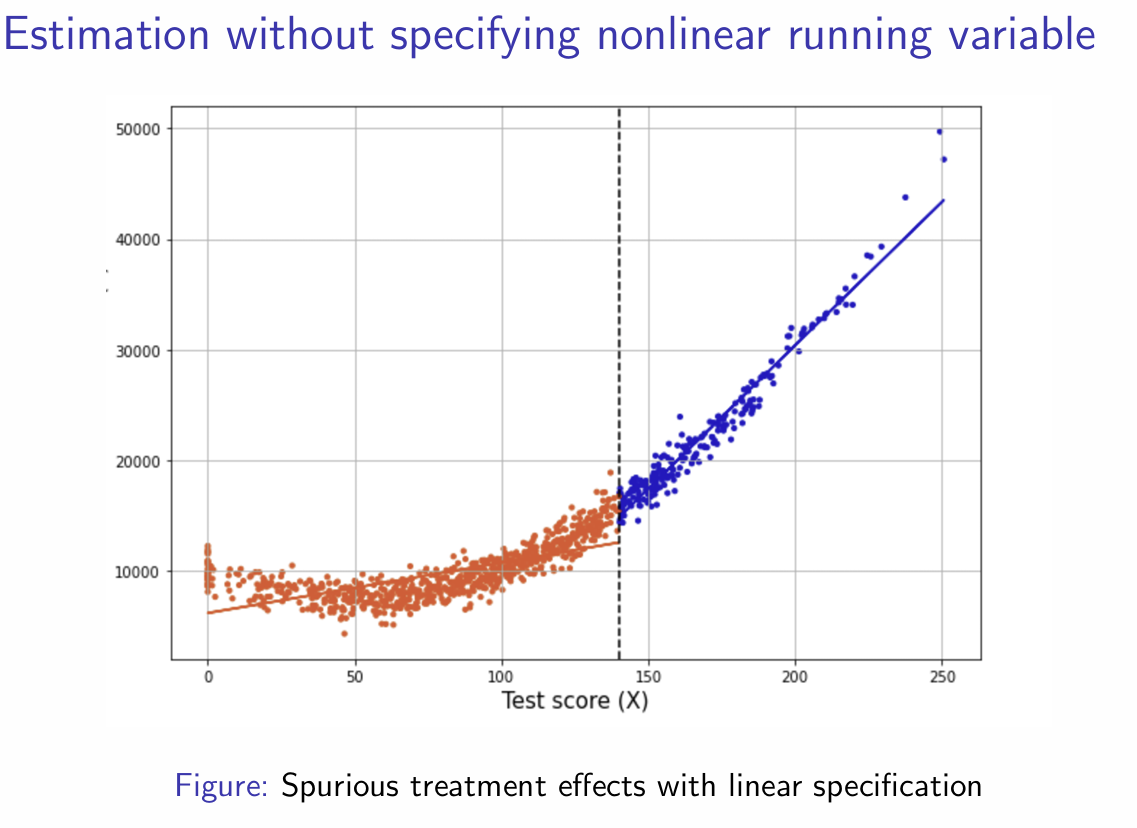
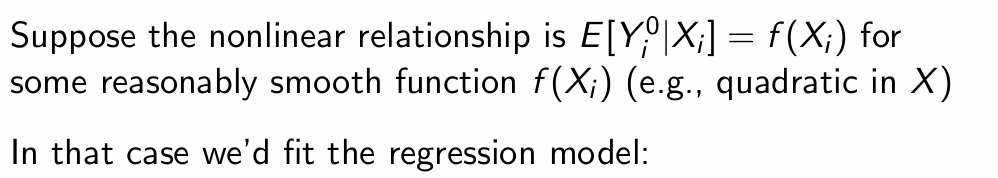
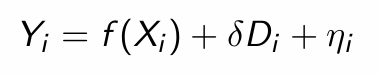
What does f(Xi) model and why?
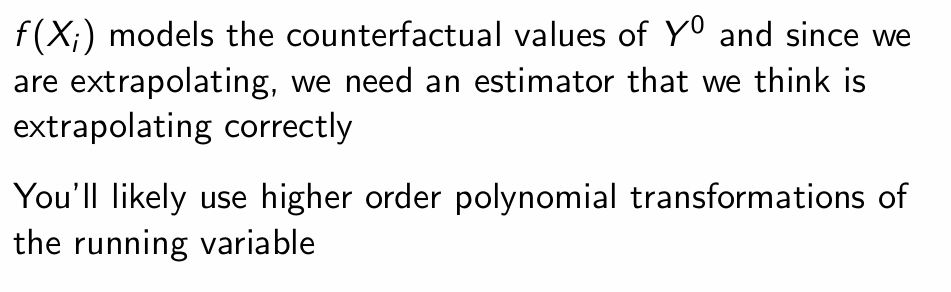
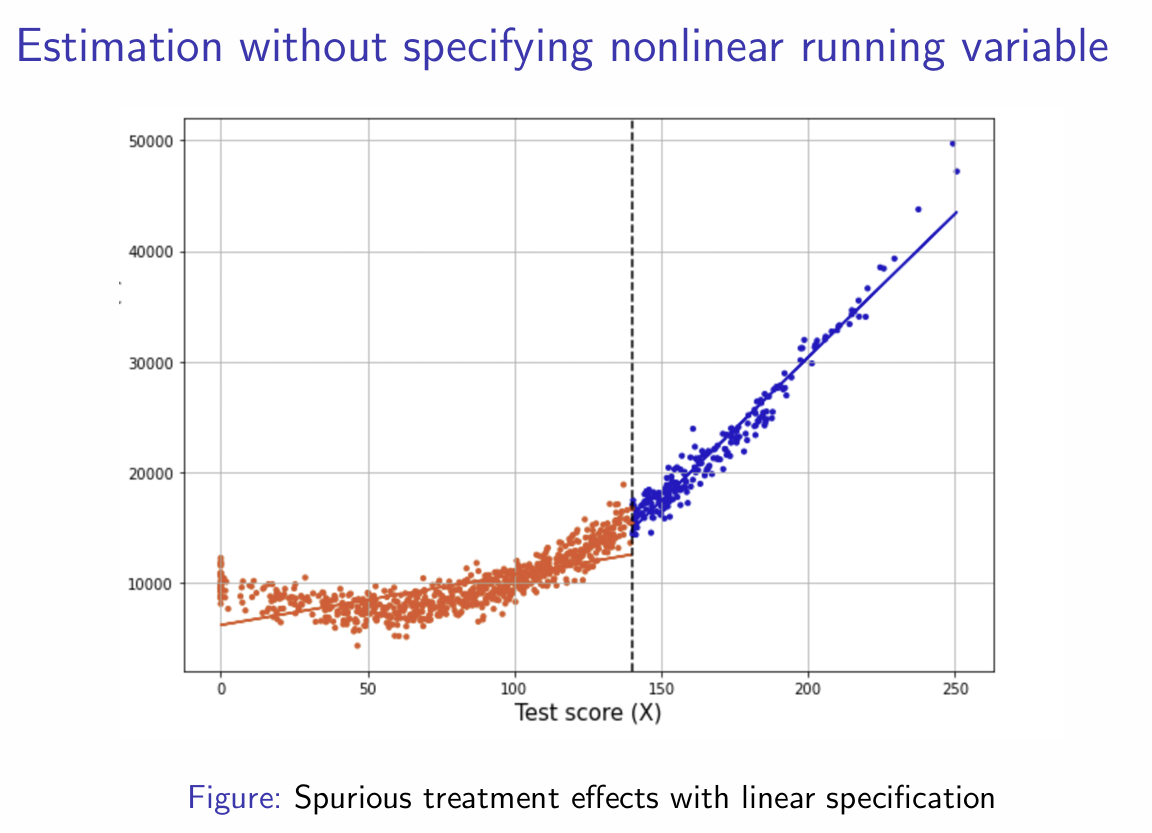
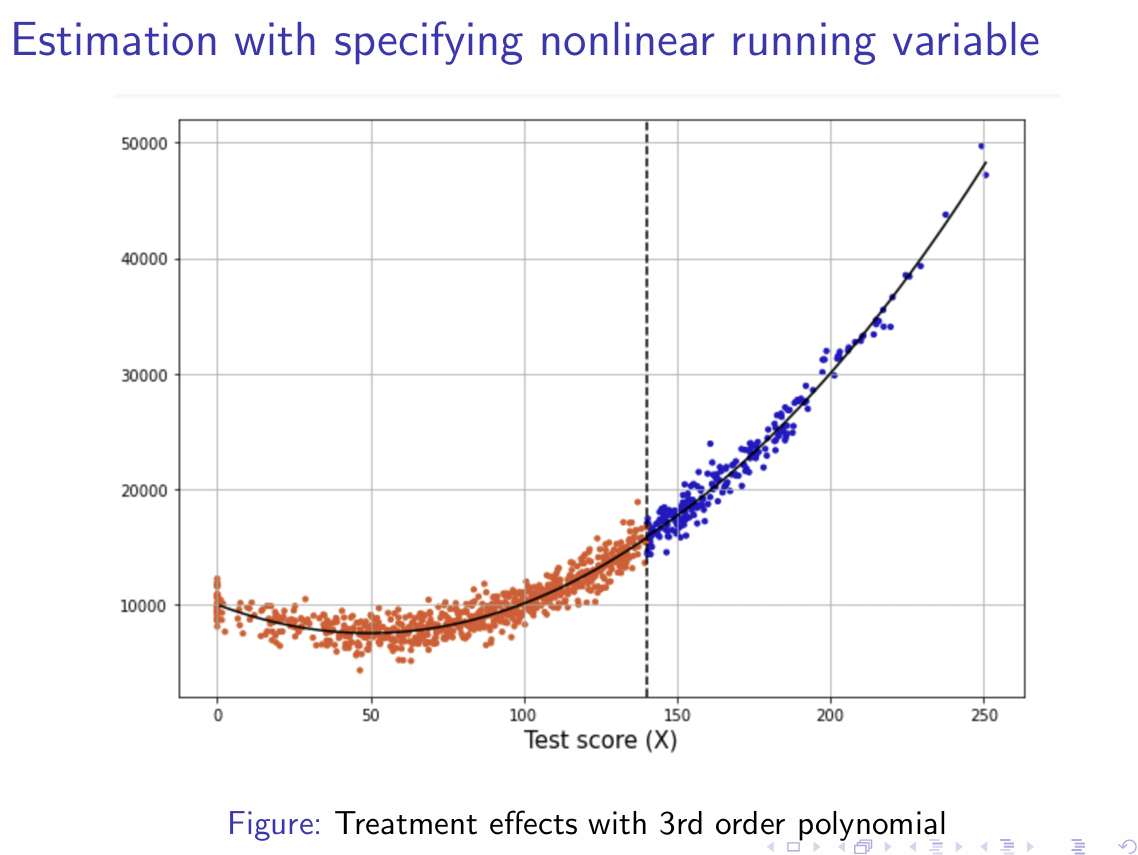
How will the estimation differ with specifying a nonlinear running variable?


How do we write this using saturated models?
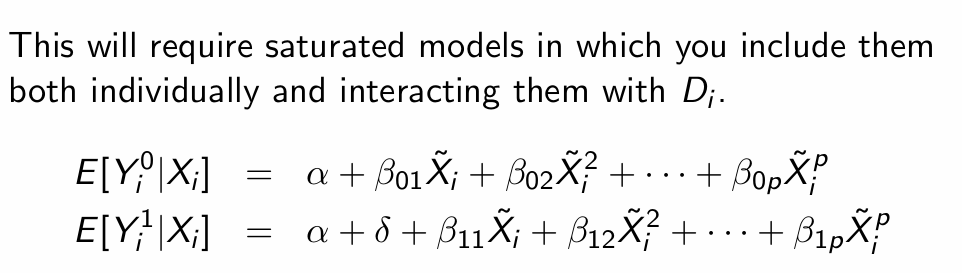

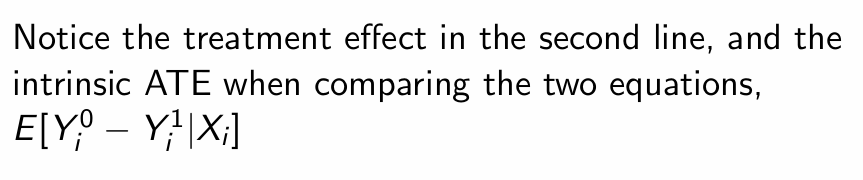
What does this term represent?


What do we get when we subtract the two equations?
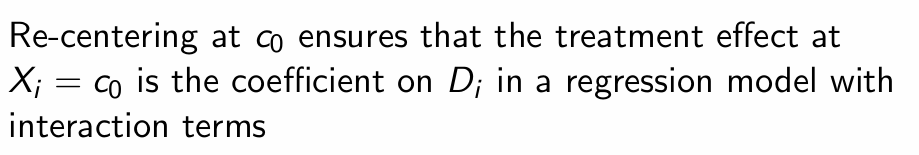
What does re-centering ensure about the treatment effect?
What do the interactions of treatment with running variable terms yield?
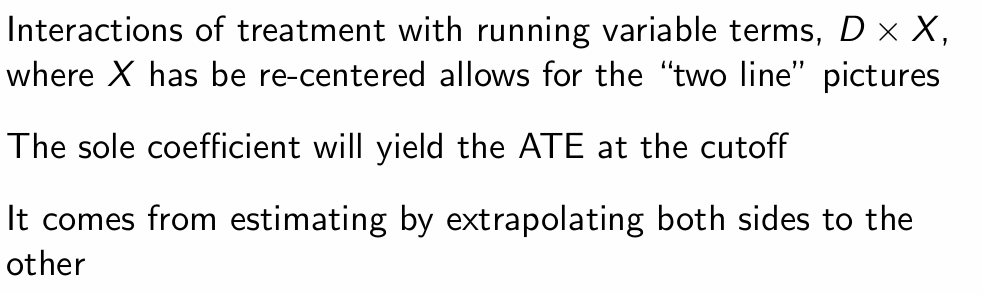
i.e. utilise interaction terms


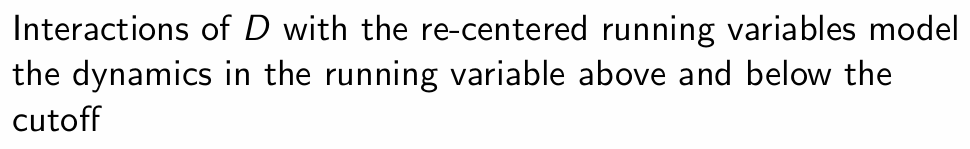
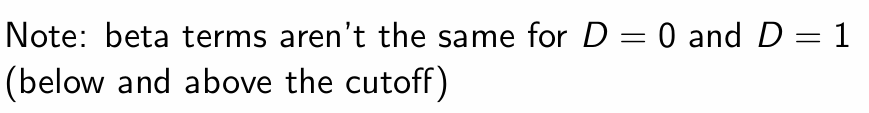
What do the interactions of D with the re-centered running variables do?
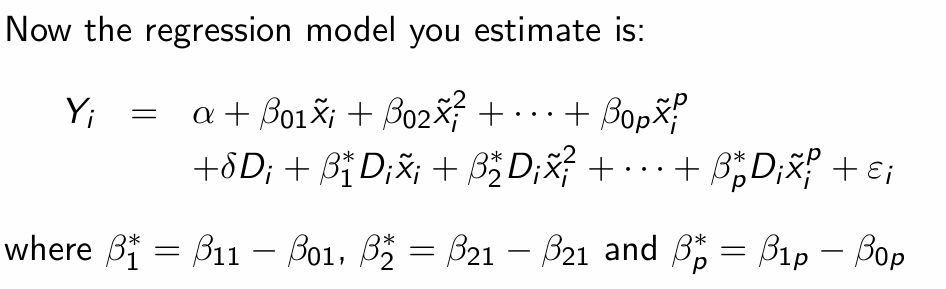
Are beta terms the same for D = 0 and D = 1?
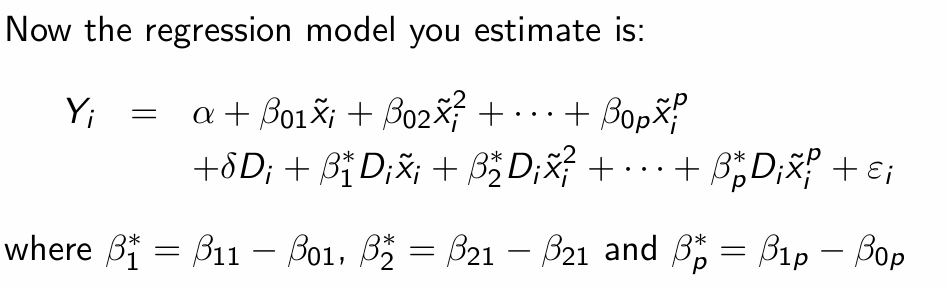
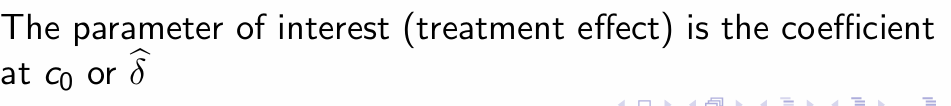
What is the parameter of interest?
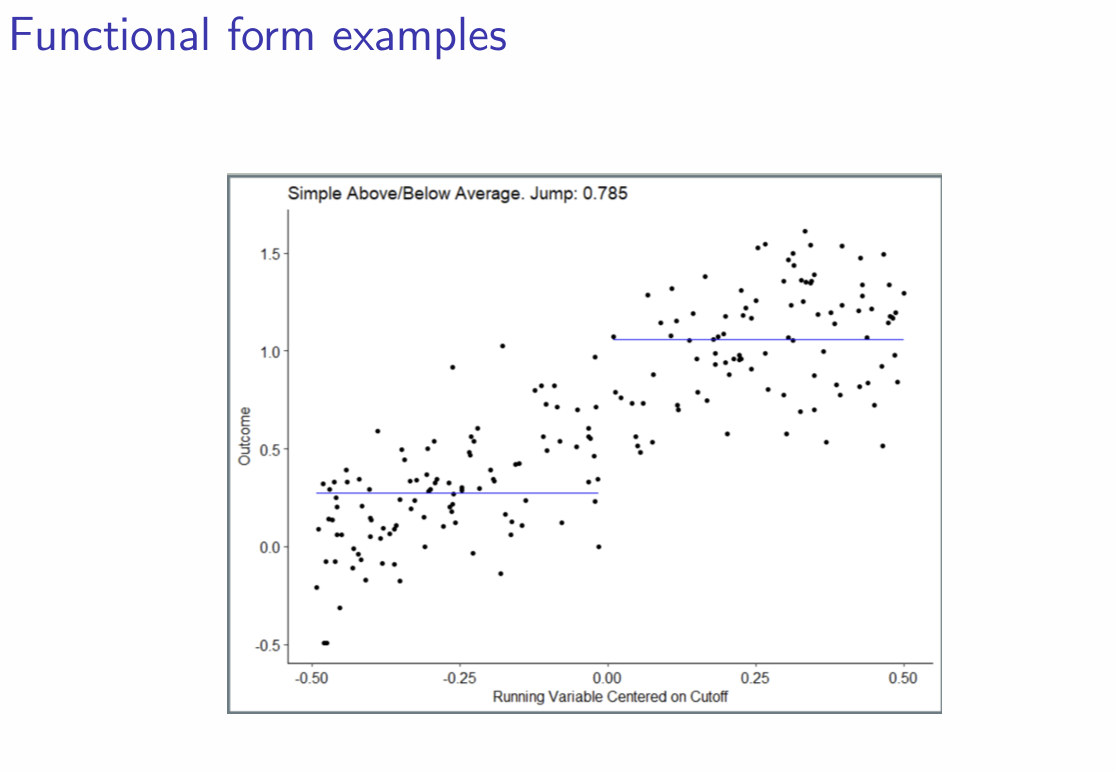
How does a simple above/below average comparison look graphically?
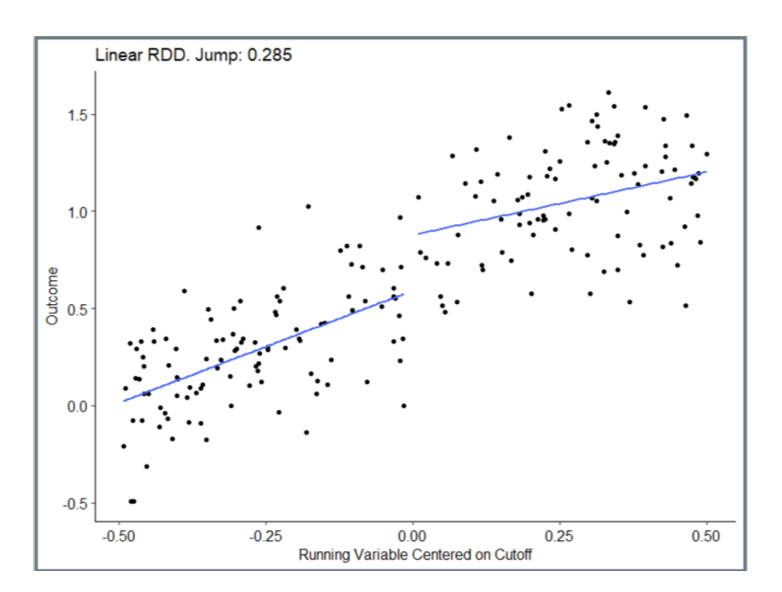
How does a linear RDD comparison look graphically?
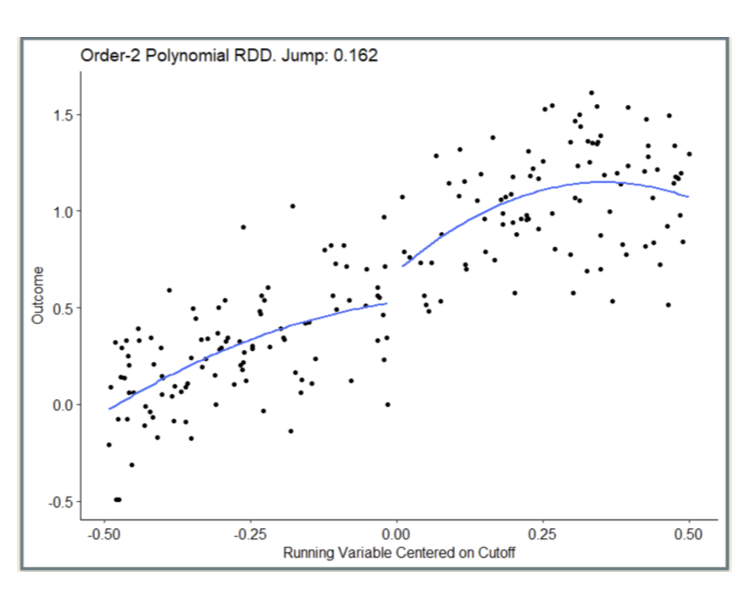
How does an Order-2 Polynomial RDD look graphically?
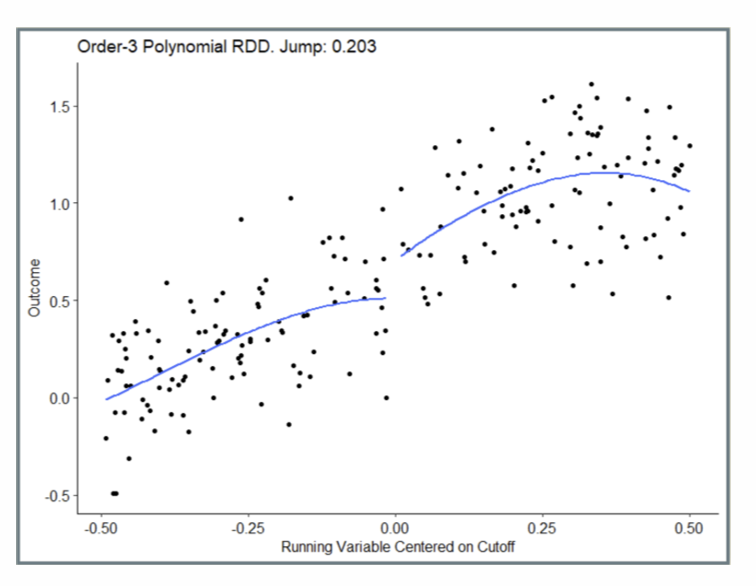
How does an Order-3 Polynomial RDD look graphically?
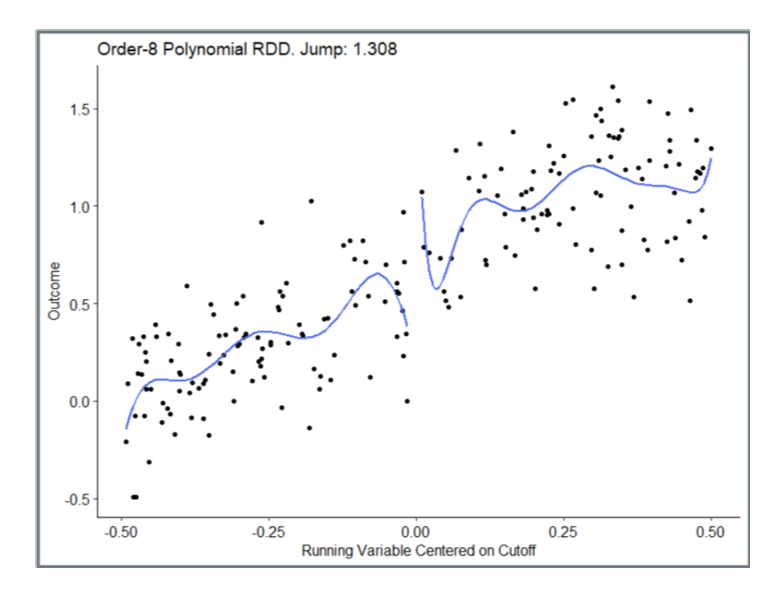
How does an Order-8 Polynomial RDD look graphically?
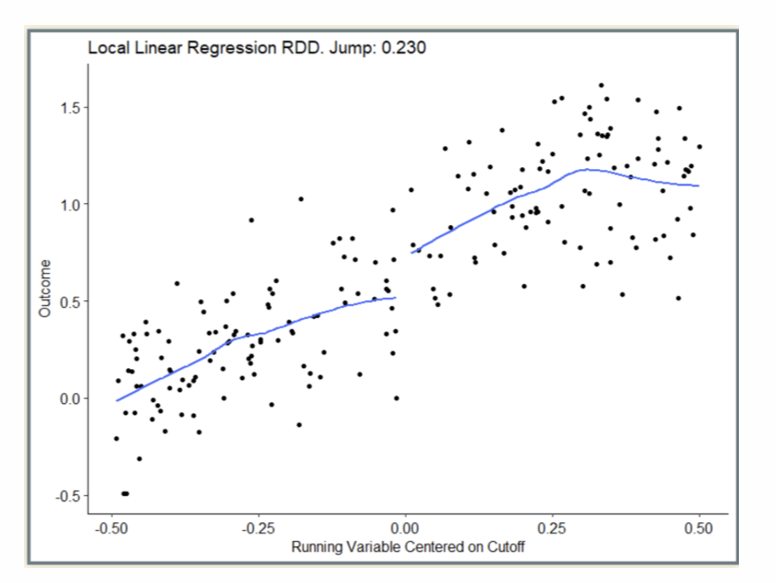
How does a local linear regression RDD look graphically?
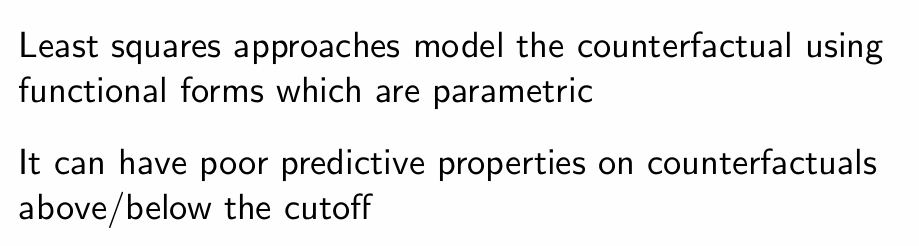
What does the least squares approach model and what is a disadvantage of the approach?
What is an alternative method?
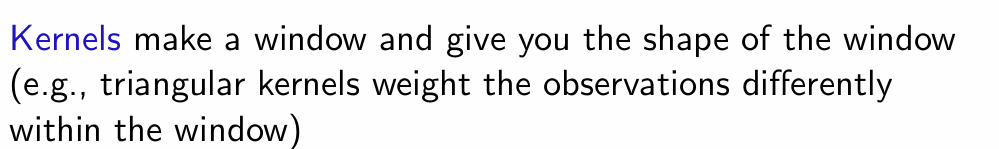
What do kernels do in RDD?
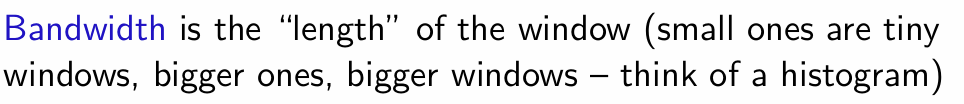
What is bandwidth in RDD?
What are bins in RDD?

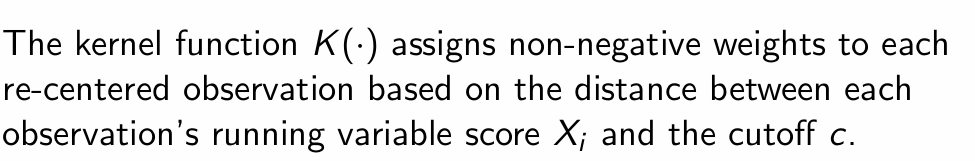
What does the kernel function do in RDD?
What different types of kernel are there in RDD?
Rectangular, triangular and Epanechnikov
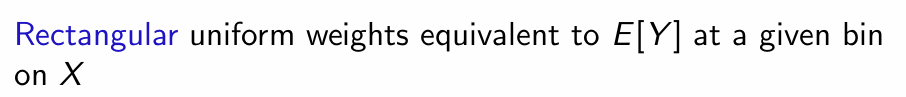
What is a rectangular kernel?
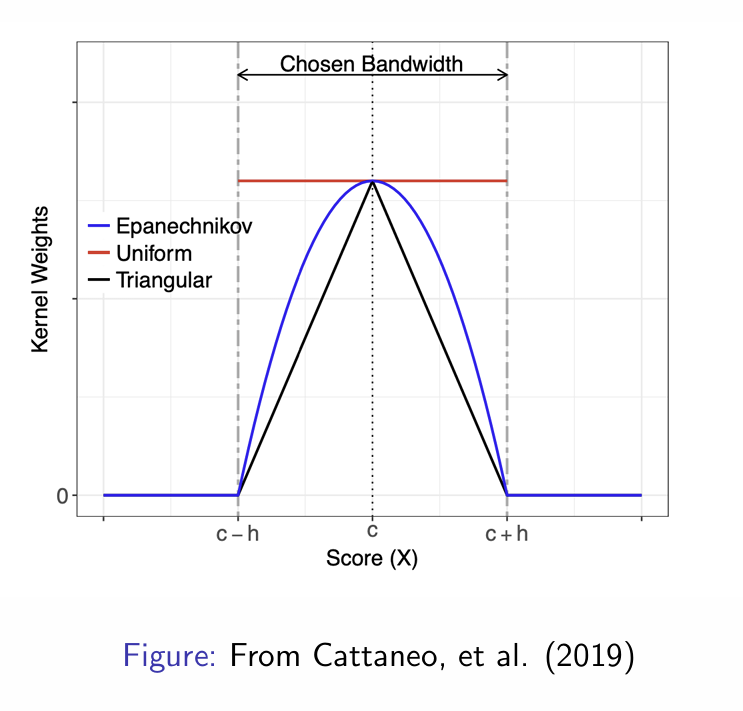
What is a triangular kernel?
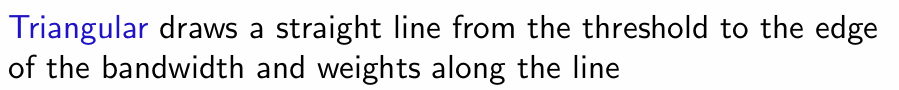
What is an Epanechnikov kernel?
Similar to a triangular kernel but more like a parabola
How do all of these look on a graph?
Observe the rate at which kernels decay with distance
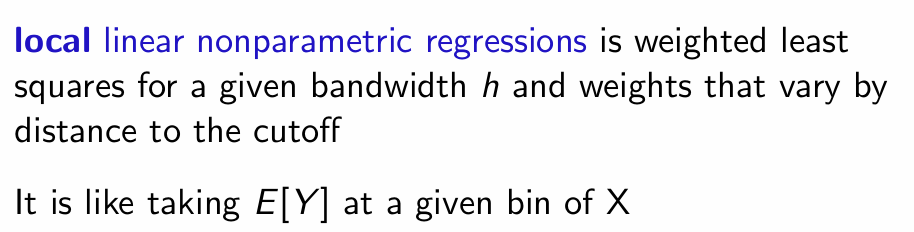
What are local linear nonparametric regressions?
How do local linear nonparametric regressions substantially reduce bias?
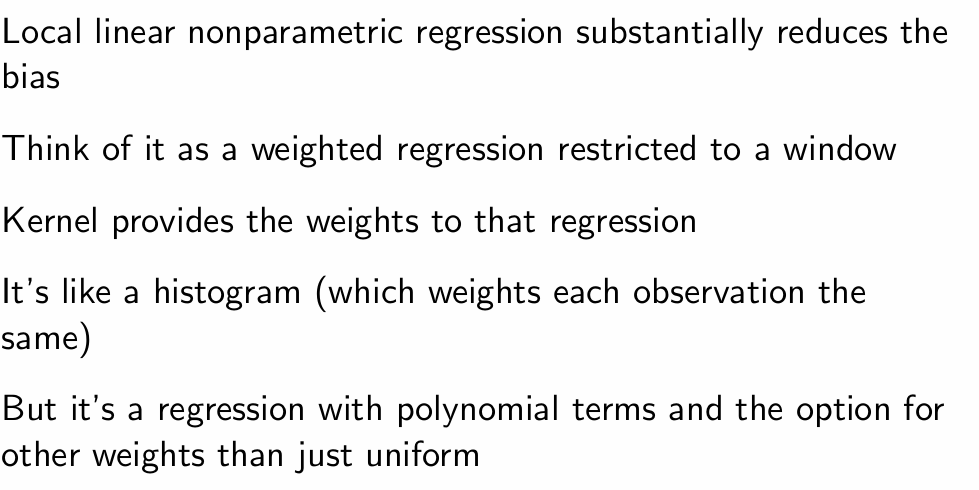
What is the disadvantage with local linear nonparametric regression?
Less precision due to the reduced sample size from observing each bin
What do you have to choose for each local linear nonparametric regression?
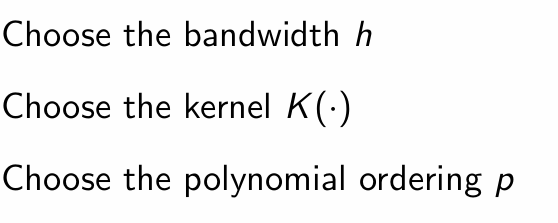
What is step 1 of local polynomial estimation?

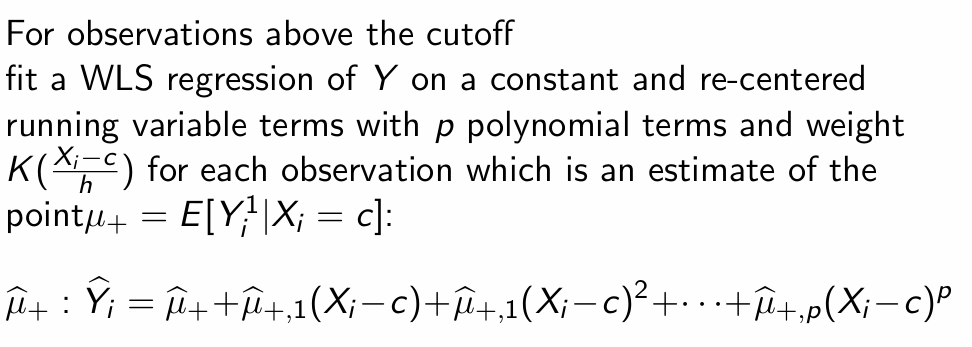
What is step 2 of local polynomial estimation?
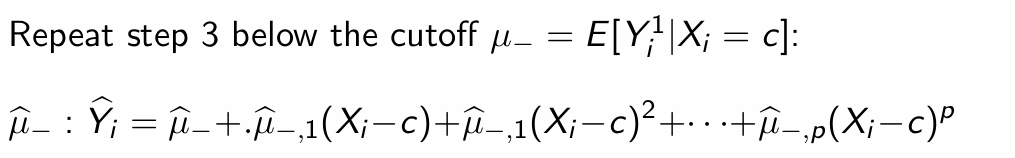
What is step 3 of local polynomial estimation?
What is step 4 of local polynomial estimation?
What is step 5 of local polynomial estimation?

Why is there approximation error from the estimation?
When is the approximation smaller?

What does the variance depend on with local polynomial estimation?
Sample size and bandwidth (h)
As the number of observations near the cut-off decreases, what happens?
What happens to variance if the bins are very small?

What does the variability of the point estimator depend on?
How is the right bandwidth determined?
Why is smoothness not directly verifiable?
What is the solution to try and verify smoothness?
