AP Statistics
1/99
There's no tags or description
Looks like no tags are added yet.
Name | Mastery | Learn | Test | Matching | Spaced |
|---|
No study sessions yet.
100 Terms
How do you check if there is outliers?
calculate IQR; anything above Q3+1.5(IQR) or below Q1-1.5(IQR) is an outlier
If a graph is skewed, should we calculate the median or the mean? Why?
median; it is resistant to skews and outliers
If a graph is roughly symmetrical, should we calculate the median or the mean? Why?
mean; generally is more accurate if the data has no outliers
What is in the five number summary?
Minimum, Q1, Median, Q3, Maximum
Relationship between variance and standard deviation?
variance=(standard deviation)^2
variance definition
the variance is roughly the average of the squared differences between each observation and the mean
standard deviation
the standard deviation is the square root of the variance
What should we use to measure spread if the median was calculated?
IQR
What should we use to measure spread if the mean was calculated?
standard deviation
What is the IQR? How much of the data does it represent?
Q3-Q1; 50%
How do you calculate standard deviation?
1. Type data into L1
2. Find mean with 1 Variable Stats
3. Turn L2 into (L1-mean)
4. Turn L3 into (L2)^2
5. Go to 2nd STAT over to MATH, select sum(
6. Type in L3
7. multiply it by (1/n-1)
8. Square root it
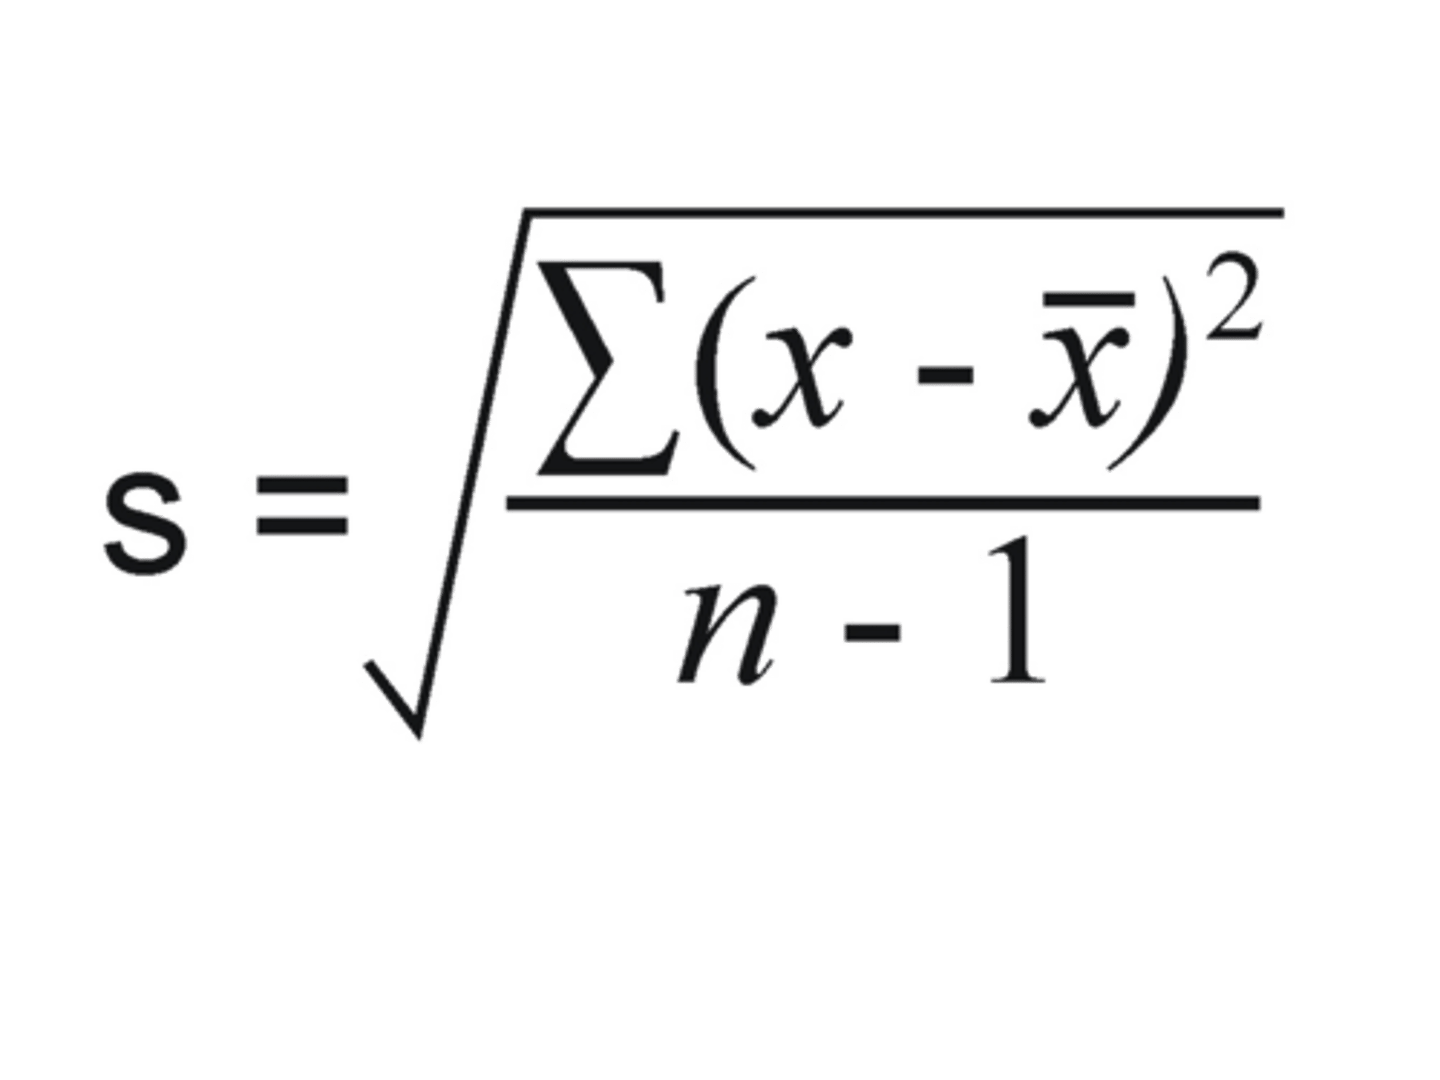
What is the formula for standard deviation?
Categorical variables vs. Quantitative Variables
Categorical: individuals can be assigned to one of several groups or categories
Quantitative: takes numberical values
If a possible outlier is on the fence, is it an outlier?
No
Things to include when describing a distribution
Center (Mean or Median), Unusual Gaps or Outliers, Spread (Standard Deviation or IQR), Shape (Roughly Symmetric, slightly/heavily skewed left or right, bimodal, range)
Explain how to standardize a variable. What is the purpose of standardizing a variable?
Subtract the distribution mean and then divide by standard deviation. Tells us how many standard deviations from the mean an observation falls, and in what direction.
What effect does standardizing the values have on the distribution?
shape would be the same as the original distribution, the mean would become 0, the standard deviation would become 1
What is a density curve?
a curve that (a) is on or above the horizontal axis, and (b) has exactly an area of 1
Inverse Norm
when you want to find the percentile: invNorm (area, mean, standard deviation)
z
(x-mean)/standard deviation
pth percentile
the value with p percent observations less than is
cumulative relative frequency graph
can be used to describe the position of an individual within a distribution or to locate a specified percentile of the distribution
How to find and interpret the correlation coefficient r for a scatterplot
STAT plot, scatter, L1 and L2 (Plot 1: ON); STAT --> CALC --> 8:LinReg(a+bx)
No r? --> 2nd 0 (Catalog) down to Diagnostic ON
r
tells us the strength of a LINEAR association. -1 to 1. Not resistant to outliers
r^2
the proportion (percent) of the variation in the values of y that can be accounted for by the least squares regression line
residual plot
a scatterplot of the residuals against the explanatory variable. Residual plots help us assess how well a regression line fits the data. It should have NO PATTERN
regression line
a line that describes how a response variable y changes as an explanatory variable x changes. We often use a regression line to predict the value of y for a given value of x.
residual formula
residual=y-y(hat) aka observed y - predicted y
What method do you use to check if a distribution or probability is binomial?
BINS:
1. Binary: There only two outcomes (success and failure)
2. Independent: The events independent of one another?
3. Number: There is a fixed number of trials
4. Success: The probability of success equal in each trial
What method do you use to check if a distribution or probability is geometric?
BITS:
1. Binary: There only two outcomes (success and failure)
2. Independent: The events independent of one another
3. Trials: There is not a fixed number of trials
4. Success: The probability of success equal in each trial
n
number of trials
p
probability of success
k
number of successes
Binomial Formula for P(X=k)
(n choose k) p^k (1-p)^(n-k)
Binomial Calculator Function to find P(X=k)
binompdf(n,p,k)
Binomial Calculator Function for P(X≤k)
binomcdf(n,p,k)
Binomial Calculator Function for P(X≥k)
1-binomcdf(n,p,k-1)
mean of a binomial distribution
np
standard deviation of a binomial distribution
√(np(1-p))
Geometric Formula for P(X=k)
(1-p)^(k-1) x p
Geometric Calculator Function to find P(X=k)
geometpdf(p,k)
Geometric Calculator Function for P(X≤k)
geometcdf(p,k)
Geometric Calculator Function for P(X≥k)
1-geometcdf(p,k-1)
Mean of a geometric distribution
1/p=expected number of trials until success
Standard deviation of a geometric distribution
√((1-p)/(p²))
What do you do if the binomial probability is for a range, rather than a specific number?
Take binomcdf(n,p,maximum) - binomcdf(n,p,minimum-1)
how do you enter n choose k into the calculator?
type "n" on home screen, go to MATH --> PRB --> 3: ncr, type "k"
μ(x+y)
μx+μy
μ(x-y)
μx-μy
σ(x+y)
√(σ²x+σ²y)
What does adding or subtracting a constant effect?
Measures of center (median and mean).
Does NOT affect measures of spread (IQR and Standard Deviation) or shape.
What does multiplying or dividing a constant effect?
Both measures of center (median and mean) and measures of spread (IQR and standard deviation).
Shape is not effected.
For variance, multiply by a² (if y=ax+b).
σ(x-y)
√(σ²x+σ²y) --> you add to get the difference because variance is distance from mean and you cannot have a negative distance
calculate μx by hand
X1P1+X2P2+.... XKPK (SigmaXKPK)
calculate var(x) by hand
(X1-μx)²p(1)+(X2-μx)²p(2)+.... (Sigma(Xk-μx)²p(k))
Standard deviation
square root of variance
discrete random variables
a fixed set of possible x values (whole numbers)
continuous random variables
-x takes all values in an interval of numbers
-can be represented by a density curve (area of 1, on or above the horizontal axis)
What is the variance of the sum of 2 random variables X and Y?
(σx)²+(σy)², but ONLY if x and y are independent.
mutually exclusive
no outcomes in common
addition rule for mutually exclusive events
P (A U B)
P(A)+P(B)
complement rule
P(A^C)
1-P(A)
general addition rule (not mutually exclusive)
P(A U B)
P(A)+P(B)-P(A n B)
intersection
P(A n B)
both A and B will occur
conditional probability
P (A | B)
P(A n B) / P(B)
independent events (how to check independence)
P(A) = P(A|B)
P(B)= P(B|A)
multiplication rule for independent events
P(A n B)
P(A) x P(B)
general multiplication rule (non-independent events)
P(A n B)
P(A) x P(B|A)
sample space
a list of possible outcomes
probability model
a description of some chance process that consists of 2 parts: a sample space S and a probability for each outcome
event
any collection of outcomes from some chance process, designated by a capital letter (an event is a subset of the sample space)
What is the P(A) if all outcomes in the sample space are equally likely?
P(A) = (number of outcomes corresponding to event A)/(total number of outcomes in sample space)
Complement
probability that an event does not occur
What is the sum of the probabilities of all possible outcomes?
1
What is the probability of two mutually exclusive events?
P(A U B)= P(A)+P(B)
five basic probability rules
1. for event A, 0≤P(A)≤1
2. P(S)=1
3. If all outcomes in the sample space are equally likely, P(A)=number of outcomes corresponding to event A / total number of outcomes in sample space
4. P(A^C) = 1-P(A)
5. If A and B are mutually exclusive, P(A n B)=P(A)+P(B)
When is a two-way table helpful
displays the sample space for probabilities involving two events more clearly
In statistics, what is meant by the word "or"?
could have either event or both
When can a Venn Diagram be helpful?
visually represents the probabilities of not mutually exclusive events
What is the general addition rule for two events?
If A and B are any two events resulting from some chance process, then the probability of A or B (or both) is P(A U B)= P(A)+P(B)-P(A n B)
What does the intersection of two or more events mean?
both event A and event B occur
What does the union of two or more events mean?
either event A or event B (or both) occurs
What is the law of large numbers?
If we observe more and more repetitions of any chance process, the proportion of times that a specific outcome occurs approaches a single value, which we can call the probability of that outcome
the probability of any outcome...
is a number between 0 and 1 that describes the proportion of times the outcome would occur in a very long series of repetitions
How do you interpret a probability?
We interpret probability to represent the most accurate results if we did an infinite amount of trials
What are the two myths about randomness?
1. Short-run regularity --> the idea that probability is predictable in the short run
2. Law of Averages --> people except the alternative outcome to follow a different outcome
simulation
the imitation of chance behavior, based on a model that accurately reflects the situation
Name and describe the four steps in performing a simulation
1. State: What is the question of interest about some chance process
2. Plan: Describe how to use a chance device to imitate one repetition of process; clearly identify outcomes and measured variables
3. Do: Perform many repetitions of the simulation
4. Conclude: results to answer question of interest
What are some common errors when using a table of random digits?
not providing a clear description of the simulation process for the reader to replicate the simulation
What does the intersection of two or more events mean?
both event A and event B occur
sample
The part of the population from which we actually collect information. We use information from a sample to draw conclusions about the entire population
population
In a statistical study, this is the entire group of individuals about which we want information
sample survey
A study that uses an organized plan to choose a sample that represents some specific population. We base conclusions about the population on data from the sample.
convenience sample
A sample selected by taking the members of the population that are easiest to reach; particularly prone to large bias.
bias
The design of a statistical study shows ______ if it systematically favors certain outcomes.
voluntary response sample
People decide whether to join a sample based on an open invitation; particularly prone to large bias.
random sampling
The use of chance to select a sample; is the central principle of statistical sampling.
simple random sample (SRS)
every set of n individuals has an equal chance to be the sample actually selected
strata
Groups of individuals in a population that are similar in some way that might affect their responses.
stratified random sample
To select this type of sample, first classify the population into groups of similar individuals, called strata. Then choose a separate SRS from each stratum to form the full sample.