ECON 001 - Chapter 1: Economic Models and Math Review
1/12
Earn XP
Description and Tags
LACC Professor Holzner
Name | Mastery | Learn | Test | Matching | Spaced |
|---|
No study sessions yet.
13 Terms
abstraction
the act or process of simplifying
» abstracting means leaving things out
direct relatioship
when two variables move in the same direction (x & y rise together and fall together)
» If one of the variables increases, the other one also increases.
» If one of the variables decreases, the other one also decreases.
economic man
homo economicus: a self-interested economic agent
inverse relationship
when two variables move in opposite directions
» If one of the variables increases, the other one decreases.
» If one of variables decreases, the other one increases.
linear relationship
graphically straight which demonstrates relationship of direct proportionality
» For every one unit change in the independent variable, there is always the same corresponding change in the dependent variable.
model
a simplified representation of reality
non-linear relationship
graphically a curve, which demonstrates that the dependent variable is not proportional to the independent variable
» For every one unit change in the independent variable, the change in the dependent variable varies.
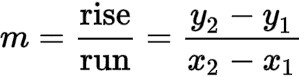
slope
rise over run: rate at which the DV changes when the IV changes every ONE unit
slope coefficient
measures the rate of change of the DV
» For every one unit change in the independent variable, the slope coefficient measures what is the change in the dependent variable.
» The slope coefficient is obtained by dividing the change in the dependent variable by the change in the independent variable.
regression analysis
a set of statistical methods used for the estimation of relationships between a dependent variable and one or more independent variable
demand curve
a graph depicting the inverse demand function
» a relationship between the price of a certain commodity and the quantity of that commodity that is demanded at that price
slope formula(s)
how many variables can we include and why?
THREE (X,Y,Z) because, although there are many interdependent variables, we live in a three-dimensional world, limiting our ability to visually represent more dimensions on a standard graph.
» this is where where the simplifying is crucial!!!