Learning Module 12
1/23
There's no tags or description
Looks like no tags are added yet.
Name | Mastery | Learn | Test | Matching | Spaced |
|---|
No study sessions yet.
24 Terms
Financial modelling
The projection of the companies financial statements over time.
Building a Financial Statement Model
Begins with forecasting items on the income statement
The I/S serves as the foundation for modelling the balance sheet and cash flow statements.
Forecasting Income statement: Revenue
Understand the company’s revenue sources, such as:
Geographical regions
Business segments
Product lines
Once sources are known, an analyst can use the following approaches to forecast revenue:
Top-down: Begins at the level of the overall economy, we move down to the sector, industry, and market for a specific product to forecast the revenue for an individual company.
E.g., Apple sells its iPhone in the USA, China, India, Ethiopia, etc. In the top-down approach, we will look at the macroeconomics of each country. Let's say China’s economy is growing at a 7% rate compared to the US, which is growing only 2% annually. We might expect to see more growth in China. Another factor, maybe only 5% of the Indian population has smartphones, so we could see a surge of iPhone sales in India as that market grows. This is the top-down approach.
Bottom-up: Begins at the level of the individual company or a unit within the company (e.g. product line), and we then sum up the projections for the individual products to forecast the total revenue for the company.
Bottom-up approach looks at what’s happening within the company, how the company itself is growing, etc.
Hybrid (Best approach usually): Combines top-down and bottom-up approaches. By using elements from both approaches, a hybrid approach can reveal implicit assumptions or errors that may arise from using a single approach.
E.g. let’s say your company sells phones, the market you are selling in, the growth rate is going to double by the end of the year, the capacity you are currently selling at is 50,000, and this can go to 100,000 by the end of the year, which will of course be exciting as your sales might also double, right?? But, you do a B.U. analysis and realize your unit capacity is capped at 80,000, so even if the market grows, you have a capped capacity of production.
Top down approaches to Modeling Revenue
Two common top-down approaches to modelling revenue are:
Growth relative to the GDP growth approach.
We first forecast the growth rate of nominal GDP, and then forecast the company’s revenue growth relative to GDP growth. E.g. if we forecast that the GDP will grow at 4% and we believe that the company’s revenue will grow at a rate of 20% faster, then the forecasted increase in the company’s revenue is (0.04) x (1 + 0.20) = 4.8%
Market growth and market share approach.
In this approach, we combine forecasts of growth in particular markets with forecasts of a company’s market share. E.g. Assume Tesla is expected to maintain a market share of 1% in the automobile market. If the automobile market is expected to grow to $30 billion in annual revenue, then Tesla’s annual revenue is forecasted to grow to 1% * $30 billion = $300 million
Bottom-Up Approaches to Modeling Revenue
Time-series
Forecasts based on historical growth rates or time-series analysis. We may assume that the historical growth rate may continue, or that the growth rate will decline linearly from current rates to some long-run rate.
Return on Capital
Forecasts based on balance sheet accounts. E.g. a bank’s interest revenue can be calculated as loans multiplied by the average interest rate.
Capacity-based measure
A capacity-based measure for business unit (B.U.) analysis evaluates performance relative to the resources and throughput potential the unit controls, tying outputs and financials to the unit’s available capacity rather than just absolute results. It helps separate demand shortfalls from true operational efficiency by normalizing for hours, machines, headcount, or service bandwidth the B.U. can deploy.
Hybrid Approach to modeling revenue
In this modeling approach, we combine elements of both top-down and bottom-up approaches.
E.g. we may use a market growth and market share approach to model individual product lines or business segments (top-down) and then combine the individual projection to arrive at a forecast for the overall company (bottom-up).
Income Statement Modeling: Operating costs
Include projection of COGS & SG&A
Usually operating costs are often less detailed than revenue. If information is available, than we can match cost analysis to revenue analysis.
Costs may be modeled separately for different geographic regions, business segments or product lines, only if the information is actually provided, that is.
Similar to revenue forecasting:
Top-down approach: Consider factors such a s overall level of inflation, or industry-specific costs.
Bottom-up approach: Consider factors such as segment-level margins, historical cost-growth rates, historical margin levels, etc.
Hybrid view: Incorporate elements from both top-down and bottom-up.
Income Statement Modeling: Operating costs (Fixed & Variable costs)
Some points analysts must consider when projection operational costs are:
Since variable costs are linked to revenue growth, they can be forecasted as a percentage of revenue.
Since fixed costs are not directly related to revenue, they are assumed to grow at their own rate or at the rate of future PP&E growth.
Income Statement Modeling: Operating costs (Economies of Scale)
Economies of scale: When the company continues to grow, its cost per unit tends to get lower and lower, until the reaches a certain point, thereafter, it actually increases (due to bureaucratic reasons), but that’s known as diseconomies of scale.
Determine whether a company has economies of scale at the current level of output.
Gross/Operating margins tend to be positively related to sales if there are economies of scale.
Because if operating costs go down, revenue will naturally go up.
Income Statement Modeling: Operating costs (COGS)
Since COGS are directly related to sales, we can forecast future COGS as a percentage of future sales.
Analysts should understand the historical relationship between COGS and sales and determine if this relationship is likely to decrease, increase, or remain unchanged
Sales - COGS = Gross Margin
COGS and Gross margin are inversely related
Income Statement Modeling: Operating costs (SG&A)
As compared to COGS, SG&A expenses are not directly related to revenue.
The fixed components, such as R&D expenses, management salaries, head office expenses, supporting IT and administrative operations, tend to increase and decrease gradually over time; they don’t fluctuate with sales.
On the other hand, the variable components, such as selling and distribution costs, are more directly related to sales. E.g. if sales increase, the company may pay out a higher bonus to its sales staff, they may also hire additional sales staff.
Income Statement Modeling: Non-operating costs
Non-operating costs appear below operating profit on the I/S. The two main non-operating costs that need to be forecasted are financing expenses (i.e. interest payments) and taxes.
Income Statement Modeling: Non-operating costs (Financing Expenses)
Interest expense comes from the company’s debt (shown on the balance sheet) and depends on how much debt there is and the interest rate.
To estimate (forecast) these costs, first check how the company is funded (its capital structure).
Predict the future debt level and interest rates to estimate future interest expenses.
To make better forecasts, use extra info from the notes in financial statements about when the debt is due (maturity structure).
Income Statement Modeling: Non-operating costs (Corporate Income Tax)
Three types of tax rates
Statutory tax rate: The tax rate established by law
Effective tax rate: Tax amount reported on the income-tax statement divided by the pre-tax income
Cash tax rate: Tax actually paid divided by pre-tax income
The effective tax rate is used to forecast earnings on the I/S, and the cash tax rate is used to forecast cash flows.
To improve the quality of forecasts, analysts should adjust for one-time events, which can be found in the notes of the financial statements.
Income Statement Modeling: Other items
A few other items on the I/S that can be forecasted are:
Dividends: Dividends are often forecasted to grow each year by a certain dollar amount or as proportion of net income.
Income from affiliates: If the parent company owns more than 50% of the affiliate company, all sales/costs (assets, liabilities, everything) are consolidated under parent company, under minority interest (the amount the parent company owns). If they own less than 50%, you show it as the equity method, so you only report its share of income from the affiliate.
Share count: When projecting share count, analyst must consider the market price of a stock and the capital structure of the company. Share count can change under three circumstances: Dilution related to stock options/convertible bonds, issuance of new shares, and share repurchases.
Unusual charge: Difficult to predict and usually not forecasted.
Balance sheet modelling
Some B/S items flow directly from the forecasted income statement, e.g. the net income minus dividends will flow through to retained earnings.
Other B/S items are closely linked to the forecasted income statement and can be projected based on their historical relationship with income statement items.
Examples include:
Projected A/R = (forecasted sales x days sales outstanding) / 365
Projected inventory = (forecasted COGS) / (inventory turnover)
If efficiency ratios are held constant, then working capital accounts will grow at the same rate as income statement accounts.
Long-term assets such as net PP&E are less directly related to the income statement. PP&E depends on capital expenditure and depreciation.
Depreciation forecasts are based on historical depreciation, whereas capital expenditure forecasts are based on the analyst’s estimate of the future need for new PP&E.
To improve the quality of the forecast, capital expenditure can be broken into maintenance capital (capital required to sustain the current business) and growth capital expenditure.
Due to inflation, maintenance capital expenditure should be higher than historical depreciation.
Finally, to forecast the capital structure, analysts use leverage ratios (such as debt to equity, debt to capital, etc)
Building a Financial Statement Model
Start with the industry: Do a brief Porter’s Five Forces to understand competition, suppliers, buyers, substitutes, and new entrants.
Understand the company: Note its specific drivers and, if helpful, split revenue into segments or products to model them separately.
Build the pro forma income statement: Forecast revenue, COGS, operating expenses, and derive operating income, interest, taxes, and net income.
Build the pro forma balance sheet: Project assets, liabilities, and equity so the sheet balances and links to your income statement assumptions.
Build the pro forma cash flow statement: Use the income statement and balance sheet to compute cash from operations, investing, and financing, ending in cash.
Value the company: Use a suitable valuation method (e.g., DCF, comparable) to estimate intrinsic value based on your forecasts.
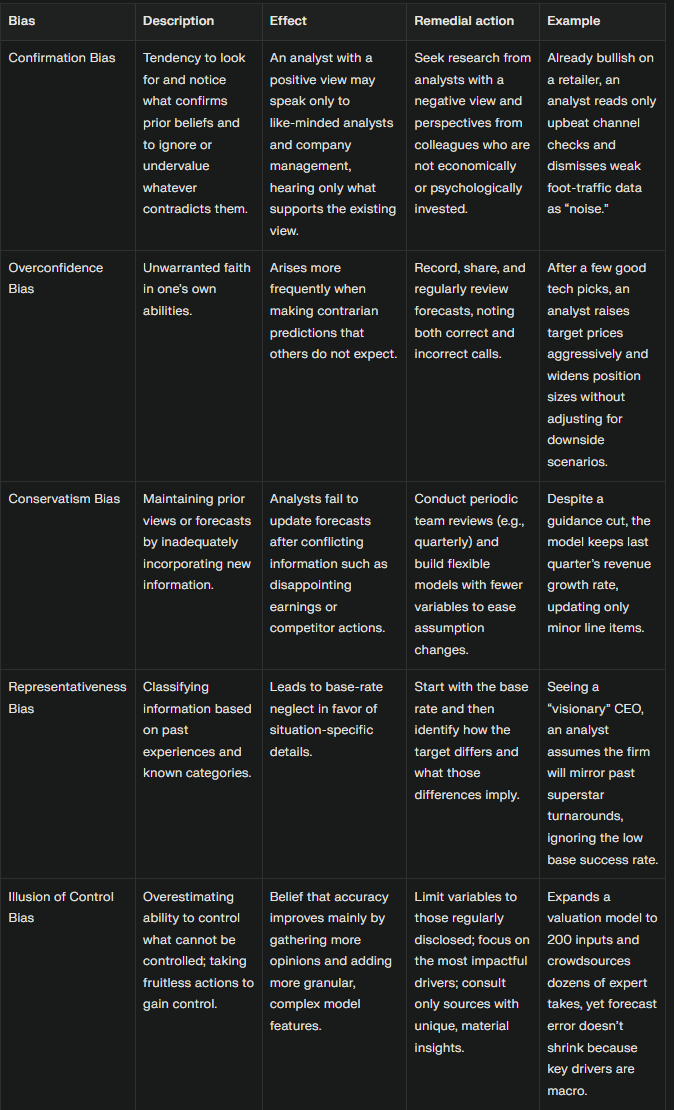
Five key biases that influence analyst forecasts
Overconfidence bias
Illusion of control bias
Conservatism bias
Representativeness bias
Confirmation bias
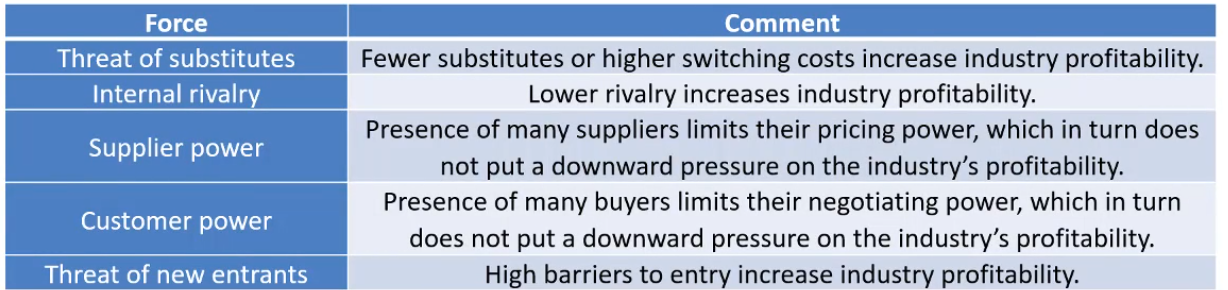
Porter’s five forces model
Anyone that puts pressure on your profitability is your competitor, these can include other companies, your suppliers, your customers, new entrants in your industry and threat of a substitute.
Your supplier might say they need a higher price for the supply their selling you, the customer might say they want a lower price, etc.
Threat of substitutes: Think companies that sell oil to gas stations for car fuel. A company like Tesla, which isn’t in their industry, but is offering a substitute to your product (electric cars that don’t need oil as fuel and can be potentially cheaper for customer) can lead to lower profitability.
Sales projection with inflation/deflation (Industry perspective)
Higher input costs usually result in higher prices for end products
The industry structure determines how fast the increase in input prices is transmitted to output prices.
As most products have an elastic demand (meaning if prices are higher, demand goes down and vice versa), change in output prices can impact sales.
The decline in demand will not only depend on the elasticity of demand but on the availability of substitutes.
In an inflationary environment, companies that raise prices too soon will experience volume losses. Whereas companies that raise prices too late, will experience declining profit margins.
Sales projection with inflation/deflation (Company perspective)
When forecasting the revenue of a company, identify a company’s main input costs and the company’s strategy for how it responds to rising input prices (will the company increase output prices or not).
Will the company pass the increase in cost to customers or accept margin reduction to retain market share?
Revenue projections are based on expected price and volume development.
Price elasticity matters: If demand is inelastic, raising prices during inflation boosts revenue; if elastic, higher prices shrink revenue because volume drops.
Cost inflation rates differ by region: Company costs can change based on where products are made or sold; exchange rates affect gains.
Product category costs vary: Cost increases hurt some businesses more (like bakeries hit harder by rising grain prices than supermarkets).
Long-term forecasting
Investment strategy for which the stock is being considered:
The forecast horizon is usually the expected holding period of the stock. (average holding period = 1 / portfolio turnover)
E.g. an annual portfolio turnover of 20% indicates an average holding period of 5 years, meaning your forecast should be for at least 5 years of the company.
The longer you want to hold the stock, the longer the forecasting should be.
Cyclicality of the industry: The forecast period should be long enough for the business to reach the mid-cycle level of sales and profitability (we dont want either extremes, lowest point of sales or highest points).
Company specific factors: Consider factors such as recent acquisition or restructuring can also influence the forecast horizon. The forecast period should be long enough to allow the expected benefits from such an activity to be realized.
Analyst’s employer preference: The person employing the analyst may specify what forecast horizon to use.
Multiples based approach (long-term forecasting)
In this method, a historical valuation multiple (like median P/E) is the starting point for the future terminal value.
When using multiples, choose a multiple that fits expected long‑term growth and returns.
Adjust the multiple if the company is expected to do better or worse than its historical average (add premium/discount).
Example: If a stock’s median P/E is 12, but future growth looks higher, use a higher P/E for terminal value—and vice versa.
Terminal value
Terminal value is the estimated value of a company at the end of the explicit forecast period, representing all future cash flows beyond the forecast horizon. It’s used to capture the bulk of a stock or business value in long‑term valuation models.
Analysts project earnings over a set forecast period, then estimate terminal value at the end—usually with a multiples approach or discounted cash flow (DCF).