Ch. 9 - Market Efficiency & Behavioral Finance
1/39
There's no tags or description
Looks like no tags are added yet.
Name | Mastery | Learn | Test | Matching | Spaced |
|---|
No study sessions yet.
40 Terms
Random Walk Hypothesis
Theory that stock price movements are largely unpredictable
Definition: Efficient Market
A market that rapidly and fully incorporates new information
Efficient Markets Hypothesis (EMH)
Stock prices rapidly incorporate new information
Investors should not expect to consistently earn abnormal returns
Implies that consistently higher expected returns require more risk
If EMH is true:
Markets are efficient
Investors can expect higher returns only if they take more risk
Stock prices are not predictable
Actual returns will be higher/lower than expected returns due to luck
Abnormal returns are unpredictable
If EMH is NOT true:
Abnormal returns are predictable
Investors can earn high abnormal returns
Investors can earn consistently high returns without taking more risk
Active investing is a good strategy
Weak Form EMH
Past data on stock prices are not useful in predicting future stock price changes
Stock prices move at random
Semi-Strong Form EMH
Investors cannot consistently earn abnormally high returns using public information
Any price anomalies are quickly discovered and stock market adjusts
Strong-Form EMH
No information- public or private, allows investors to consistently earn abnormally high returns
Definition: Arbitrage
Type of transaction where the investor simultaneously buys and sells the same asset at a different price to earn an instant risk-free profit
Market Anomaly: Calendar Effects
Stock returns may be closely tied to the time of year or time of the week
Market Anomaly: Small-firm Effect
Small firms tend to earn positive abnormal returns of as much 5%-6% per year
Small firms may offer higher returns than larger firms, even after adjusting for risk
Market Anomaly: Post Earnings Announcement Drift
Stock price adjustments may continue after earnings adjustments have been announced
Pattern seems to create opportunity for investors to earn abnormal returns by purchasing stocks that have been issued good earnings news or by short selling stocks that have delivered poor earnings results
Market Anomaly: Momentum
Tendency for stock that have gone up recently to keep going up or tendency for stocks that have gone down to continue going down
Market Anomaly: Value Effect
On average, low P/E or market-to-book ratio stocks outperform high P/E or market-to-book ratio stocks
Uses P/E or market-to-book ratios to buy/sell stock
Behavioral Finance: Self-attribution Bias
Investors tend to take credit for success and blame factors out of their control for failures
Behavioral Finance: Loss Aversion
The tendency to exhibit risk-averse behavior when confronting gains and risk-seeking behavior when confronting losses
Behavioral Finance: Representativeness
Cognitive biases that occur because people have difficulty thinking about randomness in outcomes
Behavioral Finance: Overreaction
Investors overreact to a string of good performance and overestimate the likelihood that the trend will continue
Behavioral Finance: Narrow Framing
Investors tend to analyze a situation in isolation, while ignoring the larger context
Behavioral Finance: Belief Perseverance
Investors tend to ignore information that conflicts with their existing beliefs
Behavioral Finance: Anchoring
Individuals attempting to predict or estimate some unknown quantity place too much weight on information that they have at hand, even when that info is not relevant
Behavioral Finance: Familiarity Bias
Investors buy stocks that are familiar to them without regard to whether the stocks are good buys or not
Confidence Index
Measure that attempts to capture the tone of the market through bond returns
=(AVG Yield on 10 High-Grade Corp Bonds)÷(AVG Yield on 10 Intermediate-grade bonds)
Definition: Market Volume
Amount of investors interest in stocks
Increasing volume during a risking market is:
A positive sign that the upward movement in stocks will continue
Possible signal for end of bull market:
When stocks have been moving up and volume beings to drop off
Breadth of the Market
Looks at the number of stock prices that go up (advances) vs number of stock prices that go down (declines)
Market is strong when:
Advances outnumber declines
Market is weak when:
Declines outnumber advances
Advance-Decline Line
The difference between how many stocks closed higher and how many closed lower on a day
New Highs-New Lows
The difference between stocks reaching a 52-week high and stocks reaching a 52-week low
Used as a signal to buy or sell stocks
Short-Interest
The number of shares of stocks sold short in the market at any point in time
The more sold short, the higher it is
Can interpret:
Future Demand for Stock
Present Market Optimism/Pessimism
Odd-Lot Trading
Many small traders deal in transactions of fewer than 100 shares
Theory of Contrary Opinion
Assumes that small traders will do just the opposite of what should be done
Panic/sell when market is low
Speculate/buy when market is high
Uses the amount and type of odd-lot trading as an indicator of the current state of the market
When there is a significant difference between odd-lot purchases and sales:
This can signal a bull or bear market is about to end
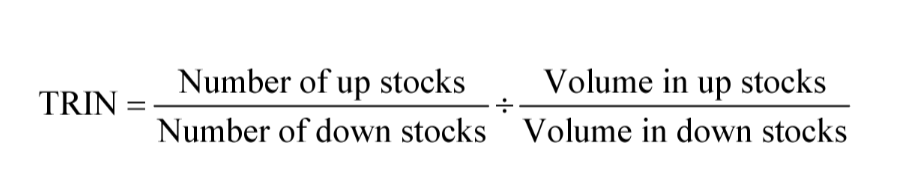
The Arms Index
Trading Index (TRIN)
Combines the advance-decline line with trading volume
High TRIN means bear market
Low TRIN means bull market
Mutual Fund Cash Ratio (MCFR)
Looks at the cash position of mutual funds as an indicator of future market performance
=Mutual Fund Cash Position ÷ Total Assets Under Management
On-Balance Volume (OBV)
A momentum indicator that relates volume to price change
Uses trading volume in addition to price and tracks trading volume as a running total
The direction/trend is important, not the actual value
Moving Average
Procedure that records the average value of a series of prices, or other data, over time
Smooths out a data series and makes it easier to spot trends
Charting
Shows a visual summary of as stock activity over time
Provides info about developing trends and future behaviors of the market or individual stocks