ECON-101 Exam 1 UMICH Dr. Dudley
1/46
There's no tags or description
Looks like no tags are added yet.
Name | Mastery | Learn | Test | Matching | Spaced |
|---|
No study sessions yet.
47 Terms
Model
a simplified representation of a real situation that is used to better understand real-life situations.
"other things equal" assumption
The "other things equal" assumption means that all other relevant factors remain unchanged.
Production possibility frontier (PPF):
illustrates the trade-offs facing an economy that produces only two goods. It shows the maximum quantity of one good that can be produced for any given production of the other.
Scarcity
the limited nature of society's resources
Opportunity Cost:
What you must give up to get some item.
Comparative Advantage:
An individual has a comparative advantage in producing a good or service if the opportunity cost of producing the good is lower for that individual than for other people.
Absolute Advantage:
An individual has an absolute advantage in an activity if he or she can do it better than other people.
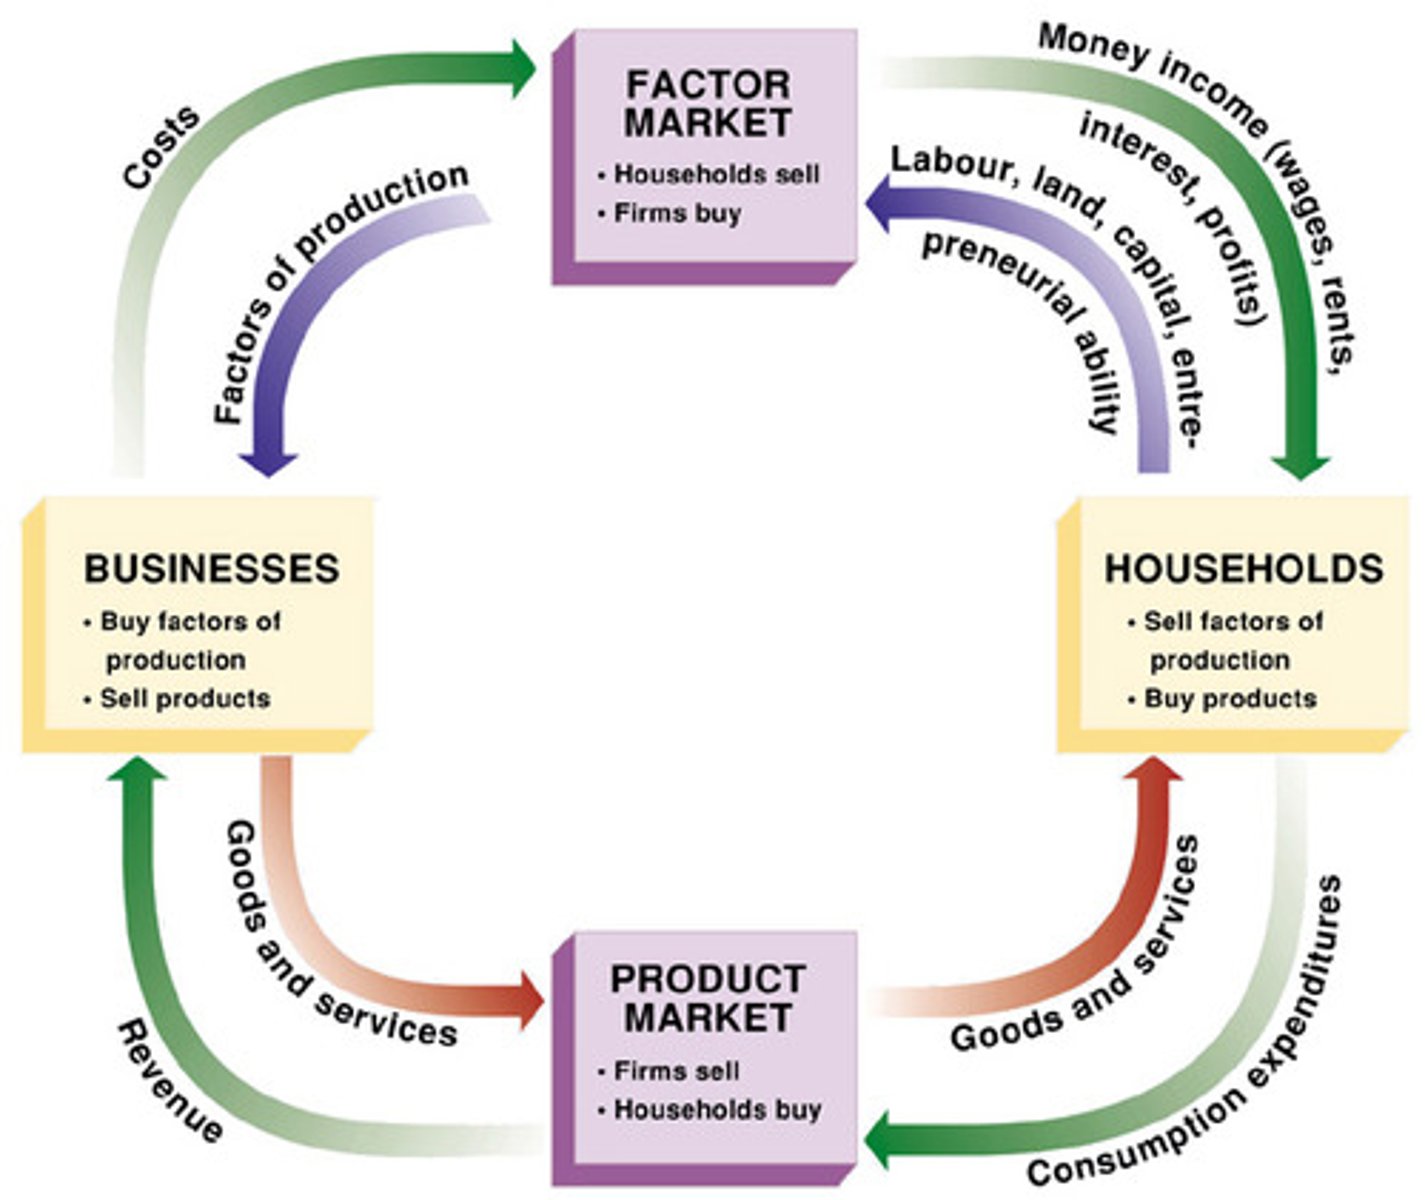
The Circular Flow Diagram
Positive Economics
the branch of economic analysis that describes the way the economy actually works.
Normative Economics
prescriptions about the way the economy should work.
Competitive Market
is a market in which there are
1. Many buyers and sellers
2. All individuals are price-takers
3. Homogenous good or service
4. Free entry and exit
Supply and Demand Model
The supply and demand model is a model of how a competitive market works.
Demand
Demand - refers to the curve in its entirety
Quantity Demanded
the actual amount consumers want to buy at some specific price
Law of Demand
Simply, the higher the price the less quantity demanded
Substitutes
a fall in the price of one of the goods makes consumers less willing to buy the other good.
Complements
a fall in the price of one good makes people more willing to buy the other good
What causes a demand curve to shift?
Changes in the Prices of Related Goods
Substitutes: a fall in the price of one of the goods makes consumers less willing to buy the other good.
Complements: a fall in the price of one good makes people more willing to buy the other good
Changes in Tastes
Changes in Income
Normal Goods: a rise in income increases the demand for a good
Inferior Goods: a rise in income decreases the demand for a good
Changes in Expectations
Changes in the Number of Consumers
Normal Goods
a rise in income increases the demand for a good
Inferior Goods
a rise in income decreases the demand for a good
What causes a supply curve to shift?
Changes in Input Prices
Changes in the Prices of Production Related Goods or Services
Changes in Technology
Changes in Expectations
Changes in Number of Producers
Equilibrium
the price at which quantity supplied equals quantity demanded
Technology
Technology is the technical means for producing goods and services.
Barter
Trade takes the form of barter when people directly exchange goods or services that they have for goods or services that they want.
Household
A household is a person or a group of people that share their income.
Firm
A firm is an organization that produces goods and services for sale.
Markets for Goods and Services
Firms sell goods and services that they produce to households in markets for goods and services.
Factor Markets
Firms buy the resources they need to produce goods and services in factor markets.
Income Distribution
An economy's income distribution is the way in which total income is divided among the owners of the various factors of production.
marginal cost
The marginal cost of producing a good or service is the additional cost incurred by producing one more unit of that good or service.
increasing marginal cost
Production of a good or service has increasing marginal cost when each additional unit costs more to produce than the previous one.
marginal cost curve
The marginal cost curve shows how the cost of producing one more unit depends on the quantity that has already been produced.
constant marginal cost
Production of a good or service has constant marginal cost when each additional unit costs the same to produce as the previous one.
decreasing marginal cost
Production of a good or service has decreasing marginal cost when each additional unit costs less to produce than the previous one.
marginal benefit
The marginal benefit of a good or service is the additional benefit derived from producing one more unit of that good or service.
decreasing marginal benefit
There is decreasing marginal benefit from an activity when each additional unit of the activity yields less benefit than the previous unit.
marginal benefit curve
The marginal benefit curve shows how the benefit from producing one more unit depends on the quantity that has already been produced.
optimal quantity
The optimal quantity is the quantity that generates the highest possible total profit.
profit-maximizing principle of marginal analysis,
According to the profit-maximizing principle of marginal analysis, when faced with a profit-maximizing "how much" decision, the optimal quantity is the largest quantity at which the marginal benefit is greater than or equal to marginal cost.
The price of a bottle of Diet Cola has increased from $1.00 to $1.75. How do we represent this on the demand curve?
A movement along the demand curve.
Over the course of the semester a number of the students in class find out they are diabetic. How will this affect the demand curve?
The demand for Diet Cola is likely to increase as a result and thus the curve will shift to the right.
Many of you are working part-time jobs which in the course of the semester give you raises. As a result your quantity demanded at every price falls. This indicates that Diet Cola is what type of good?
Inferior
People decide to have more children.
Demand increases as a result of changes in consumer tastes. The demand curve will shift to the right and the price and quantity will increase.
b. A strike by steelworkers raises steel prices
Supply falls as a result of a change in input prices. The supply curve will shift to the left. The equilibrium price will increase and the quantity will fall.
c. Engineers develop new automated machinery for the production of minivans.
Supply increases as a result of a change in production technology. The supply curve will shift to the right. The equilibrium price will fall and the quantity will increase.
d. The price of sports utility vehicles rises.
Demand increases as a result of a change in the price of a substitute good. The demand curve will shift to the right and the price and quantity will increase.
e. A stock-market crash lowers people's wealth.
Demand falls as a result of changes in consumer income. The demand curve will shift to the left and the price and quantity will decrease.