Lecture 5: Emissions and climate mitigation
1/24
There's no tags or description
Looks like no tags are added yet.
Name | Mastery | Learn | Test | Matching | Spaced | Call with Kai |
|---|
No analytics yet
Send a link to your students to track their progress
25 Terms
Climate mitigation
Consists of actions to limit the magnitude or rate of long-term global warming and its related effects. Mitigation may be achieved by reducing carbon sources or increasing carbon sinks.
We have to understand the current emissions and what is producing them and by what sector and country. Then we can focus on how we might mitigate these emissions
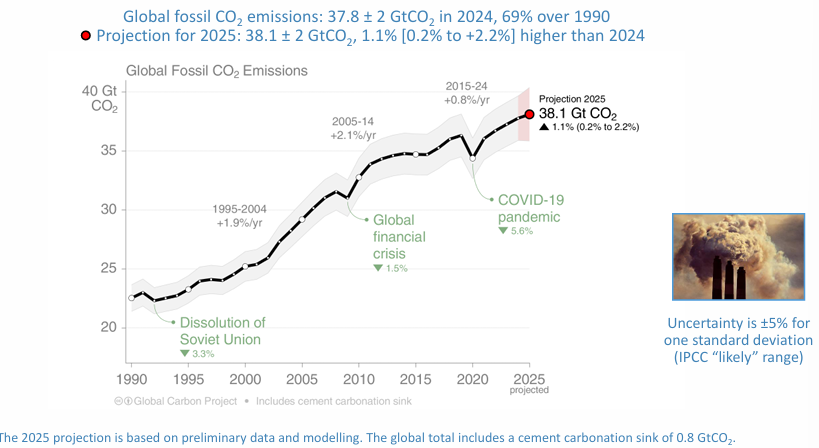
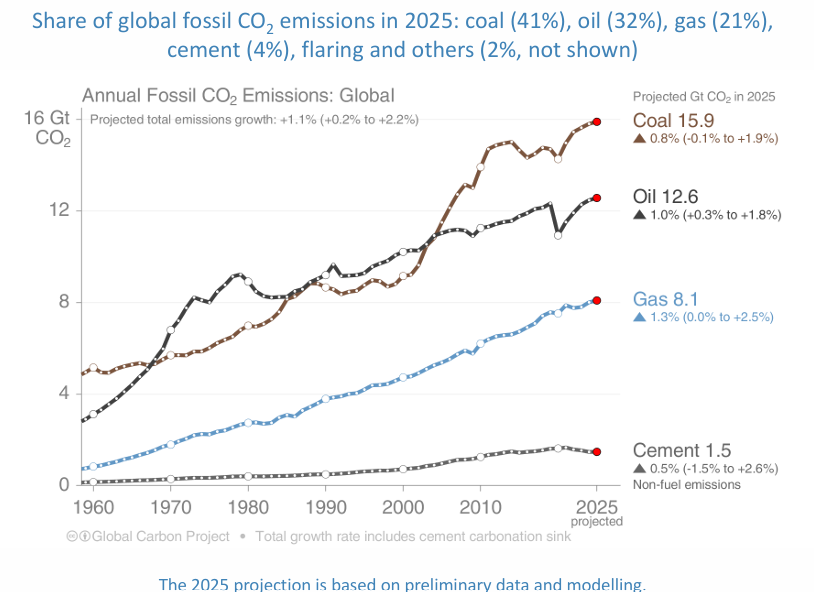
Global fossil CO2 emissions
38.1 Gt CO2 in 2025 (1.1% increase). The graph has a positive linear relationship.
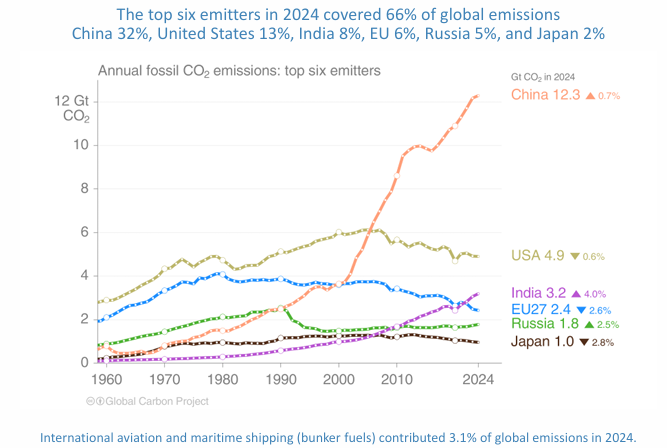
Top fossil CO2 emitters
China (32%), USA (13%), India (8%), EU (6%), Russia (5%) and Japan (2%) are the top emitters in 2024.
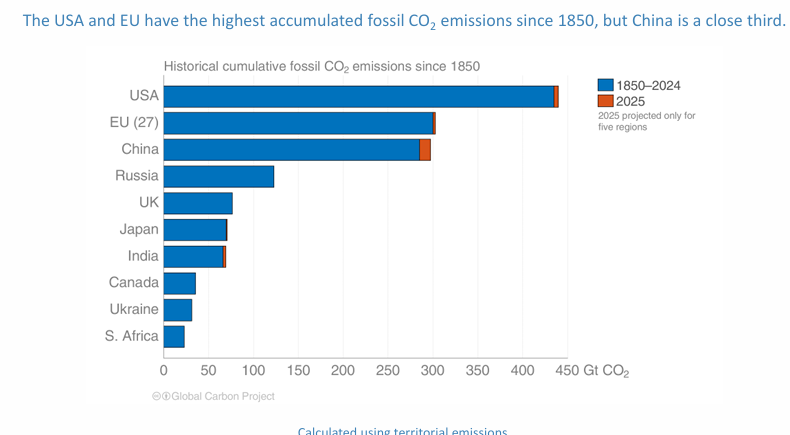
Historical cumulative fossil CO2 emissions
USA (440 Gt CO2), EU (300 Gt CO2) and China (280 Gt CO2) have the highest historical emissions.
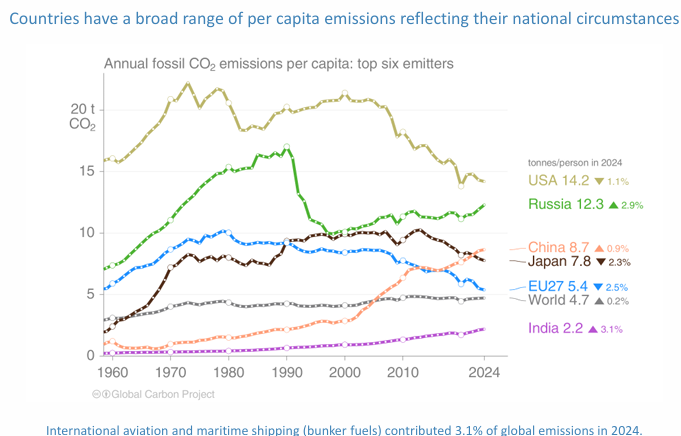
Top emitters fossil CO2 emissions per capita
USA (14.2 tonnes/person), Russia (12.3 tonnes/person), China (8.7 tonnes/person) are top emitters per capita in 2024.
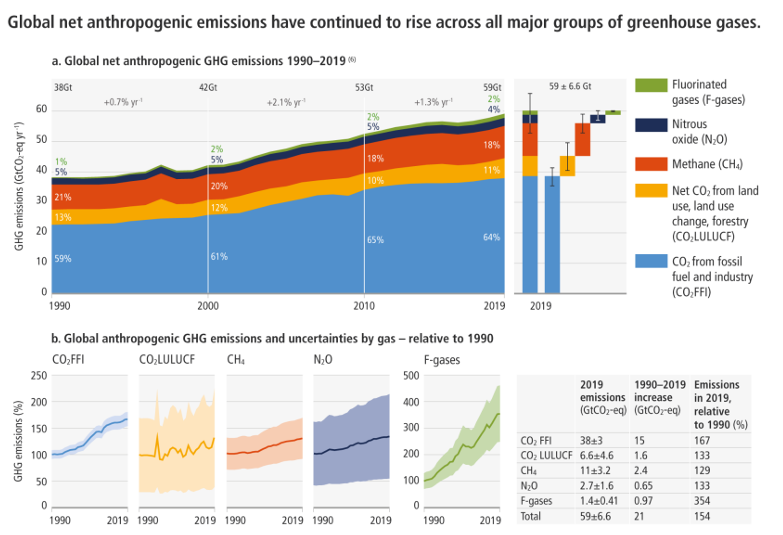
Greenhouse Gas Emissions
Mainly carbon dioxide (CO2) and methane (CH4)
Fluorinated gases (F-gases) also have a large potent effect on climate
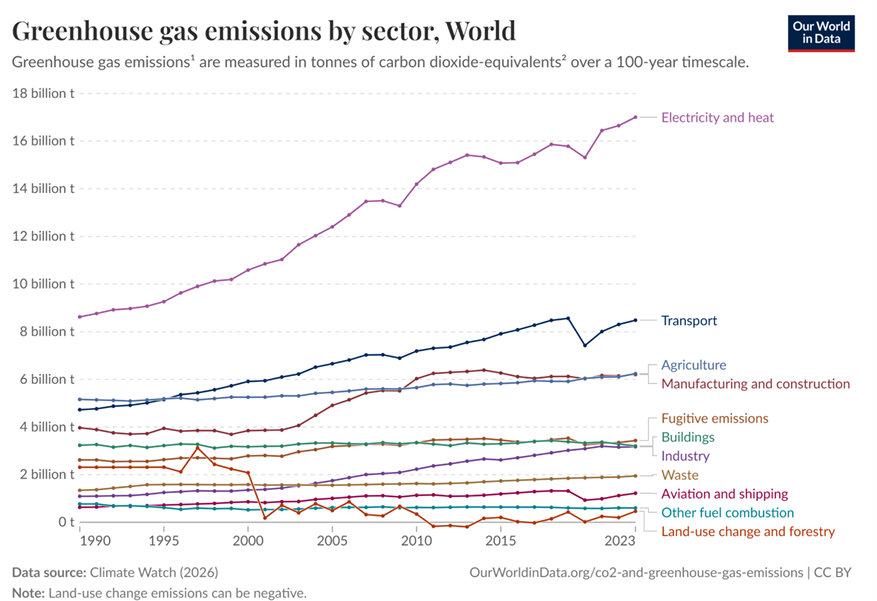
GHG emissions by sector (globally)
Electricity and heat (17 billion t), transport (8.5 billion t), manufacturing and construction/industry (6 billion t), agriculture and land use (6 billion t) are the biggest emitting sectors
Sustainable cities and communities (SDG 11)
4.2 billion people (55% of global population) lives in cities
urban population is expected to reach 6.5 billion.
Cities occupy just 3% of the Earth’s land
70% percent of carbon emissions.
828 million people are estimated to live in slums, and the number is rising
In 1990, there were 10 cities with 10 million people or more; by 2014, the number of mega-cities rose to 28, and was expected to reach 33 by 2018
in the future, 9 out of 10 mega-cities will be in the developing world.
90% of urban expansion will be in the developing world in future decades
The economic role of cities is significant
they generate about 80 percent of the global GDP
Urban emissions
Top 25 cities accounted for 52% of the total urban GHG emissions
cities in Europe, Australia, and US had significantly higher per capita emissions than developing cities
Stationary energy and transportation were the two main sources of emissions
30 of the 42 cities decreased the annual GHG emissions over the study period
in several cities there was an increase in emissions
113 out of the 167 set varying types of GHG emission reduction targets
40 have set carbon neutrality goals
Fossil CO2 emissions by source
Coal (41%/15.9 Gt CO2), oil (32%/12.6 Gt CO2), gas (21%/8.1 Gt CO2), cement (4%/1.5 Gt CO2) in 2025
Australia top emissions per sector and type
Agriculture (215 million t), electricity and heat (199 million t), transport (99 million t) are the top emitting industries in Australia
Oil (150 million t), coal (148 million t) and gas (75 million t) are the top emitting sources
Scope 1, 2 and 3 emissions
Scope 1
direct emissions
those that a company causes by operating the things that it owns or controls
e.g. running machinery to make products, driving vehicles, or just heating buildings and powering computers
Scope 2
indirect emissions
created by the production of the energy that an organization buys
e.g. installing solar panels or sourcing renewable energy rather than using electricity generated using fossil fuels would cut a company’s Scope 2 emissions
Scope 3
indirect emissions
those not produced by the company itself
cover those produced by customers using the company’s products or those produced by suppliers making products that the company uses
Scope 4
avoided emissions
Mitigation pathways
multiple scenarios with a range of technological and behavioural options, with different characteristics and implications for sustainable development, that are consistent with different levels of mitigation
IPCC SR15 looked at the mitigation required to reach 1.5 C
IPCC AR6 WGIII looked at 6-8 different scenarios to reach different degrees of global warming
Mitigation required for 1.5C
Limiting warming to 1.5°C means net zero CO2 emissions globally around 2050 and concurrent deep reductions in emissions of non-CO2 forcers, particularly methane (high confidence)
The share of primary energy from renewables increases while coal usage decreases across pathways limiting warming to 1.5°C with no or limited overshoot (high confidence). - reduction in coal and increased renewable energy
1.5°C pathways with no or limited overshoot include a rapid decline in the carbon intensity of electricity and an increase in electrification of energy end use (high confidence). - switch to electric transport options - EVs
Transitions in global and regional land use are found in all pathways limiting global warming to 1.5°C with no or limited overshoot, but their scale depends on the pursued mitigation portfolio (high confidence). – reduced deforestation
Demand-side measures are key elements of 1.5°C pathways. Lifestyle choices lowering energy demand and the land- and GHG-intensity of food consumption can further support achievement of food, reduced air-travel