CH3 - Representations of Data
1/5
There's no tags or description
Looks like no tags are added yet.
Name | Mastery | Learn | Test | Matching | Spaced |
|---|
No study sessions yet.
6 Terms
What is an Outlier?
An outlier is a value that deviates significantly from the other observations in a dataset, potentially indicating variability in the measurement or an anomaly.
M1 - An outlier is a value that is:
Greater than Q3 + K x IQR
Less than Q1 - K x IQR
M2 - Is 2 Standard Deviations away from the mean
K often = 1.5
Which method to use will be specified.
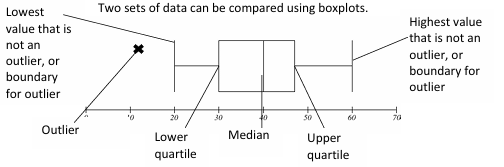
What is a Boxplot?
A representation of key features of a data set featuring: quartiles, min/max points and outliers.
What is Cumulative Frequency?
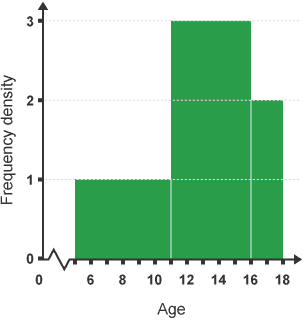
What are Histrograms?
Histograms are graphical representations of the distribution of numerical data, using bars to show the frequency of data points within specified intervals.
The Area of a Bar = K x Frequency
When K = 1, FD = Frequency / Class Width
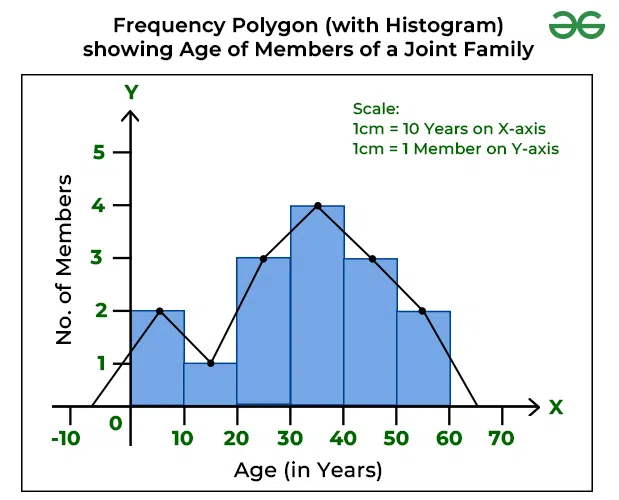
What is a Frequency Polygon?
A graphical method for displaying data distributions, created by connecting the midpoints of the tops of the bars in a histogram with straight lines.
How do you Compare Data?
When your comparing data, you should comment on Measure of Location and Spread,
You should either use Mean and Standard Deviation or Median and Interquartile Range, depending on the data (eg Median and IQR for data with extreme values)