Geography Exam
1/134
Earn XP
Description and Tags
Everything
Name | Mastery | Learn | Test | Matching | Spaced |
|---|
No study sessions yet.
135 Terms
Environment
Where unqualified environment means the living and non-living elements of the Earths surface and atmosphere.
Natural biomes:
A biome, or a community of life forms adapted to a large natural area, without sustained direct human interactions.
Anthropogenic biomes
Biomes, or a community of life forms adapted to a large area, that are the result of sustained direct human interactions with the ecosystem.
Land cover change
The changes that have taken place in natural environments due to a variety of natural and/or human causes.
Ecosystem structure and dynamics
A community of plants and animals in a non-living environment. Made of abiotic and biotic elements and a hierarchy of organisms (trophic levels). Dynamic as there are relationships between biotic and abiotic elements.
Biodiversity loss
The extinction of species worldwide, and the local reduction or loss of species in a certain habitat. Loss in variety leads to breakdown in functioning of ecosystems.
Climate Change
A long-term change in the statistical distribution of weather patterns over periods of time that range from decades to millions of years. It involes a change in average weather conditions and distribution of weather events.
Sustainability
Meeting the needs of current and future generations through simultaneous environmental, social and economic adaptation and improvement.
Deforestation
The removal or clearing of forests, generally for uses such as agriculture and urban development.
Forests cover ~30% of the Earths surface. Naturally by climate change, fires or desertification. Human by clear cutting, the removal of all trees in an area, or slash-and-burn, where trees are burnt to create a field.
CASE STUDY: BORNEO
Borneo was once home to dense rainforests and mangroves, but deforestation in the 1980s for pulp, timber and palm oil plantations causing over 6.3 million ha to be lost as of 2000.
Expansion and intensification of agriculture
Agriculture: science or practice of farming. 1/3 of land and 75% of freshwater resources dedicated to this.
INTENSIFICATION OF AGRICULTURE: An increase in the output from existing agricultural areas.
EXPANSION OF AGRICULTURE: The increasing amount of land available for agriculture
300% increase in food crop production since 1970. Better farming methods. Increased pressure on environment and natural resources.
CASE STUDY: THE GREEN REVOLUTION
Key turning point in global agricultural production in the mid 20th century. Adopted new technologies: Chemical: Pesticides, fertilisers. Mechanical: tractors, irrigation.
Uptake in Genetically Modified Crops: China 450% increase in GMC but expanded 11%
Growth of urban developments
Land to support urban areas undergoes a total transformation and has the greatest influence on global environmental change, occupying 1-3% of land. Clearing vegetation Building infrastructure.
Case study: lagos nigeria
One of the fastest growing cities 496sqkm in 1990 to 1256sq km in 2020. Loss of bare soils, vegetation, waterbodies
Mining
Extraction of valuable geological materials and minerals from the surface of the Earth. 1% of the worlds land use is dedicated to mining. Affects biodiversity and land cover by changing abiotic and biotic conditions such as land clearing, chemicals, dust and aerosols.
CASE STUDY: Brumadinho disaster spilled 12 million cubic meters of sediment in surrounding rivers.
Affluence + technological advances
Global wealth isn't equally distributed. As populations became more affluent, demand for resources increased, especially meat. Greater Wealth=More diverse diets- more meat + dairy=More LCC for agriculture
Type: Agricultural, urban
Rate: 300% increase in food production since 1970. More affluent countries consume and replace goods faster due to a greater capacity to invest and develop in new technology. 15% increase in demand for new products, especially meat. Changes in machinery to fell a tree: handsaw, chainsaw.
Advances in agriculture such as GMC increase yield without expansion. China 450% increase in GMC but only expanded 11% Extent: 50% of habitable land used for food production.
Comparing LCC between Aus and Brazil
Government policy in Australia is strict in terms of deforestation, with the government attitudes focussing more towards a more sustainable approach to decrease deforestation. The WA Forest Management Plan 2024-2033 includes restrictions on forestry and preserves around 400,000 hectares forests. Conversely, government policy in Brazil tends to focus more on economic growth rather than living sustainably. The Forest Code, which once stated only 20% of farmland could be cleared, was weakened, accelerating deforestation and land cover change.
Culture and ideology affect land cover change with Australians greatly valuing natural environment and outdoor living, and having vocal groups like the Department of Biodiversity Conservation and Attractions influencing ideology. Brazil, although there are more priorities towards Amazon protection, value economic growth, encouraging extensive soybean and cattle production and seeing farmer’s illegally clear land.
Impacts of LCC: Changes to the water cycle
WATER CYCLE: The continuous movement of water between Earths land, ocean atmosphere and groundwater.
Deforestation has significant impacts. Tropical forest losses impact climate through the water cycle. Areas far inland receive most precipitation via transpiration, where tree roots take in moisture from soil and release it through their leaves. The Amazon alone responsible for 10%. of water recycled by Earths vegetation daily. Large scale deforestation decreases rainfall up to 50% due to a decline in evapotranspiration. Deforestation can interrupt infiltration and percolation as the water table rises due to lack of roots. This increases runoff, increasing erosion and sediment deposition. In terms of agriculture nutrient runoff from fertilisers causes eutrophication of water systems. Algal blooms deprive water + organisms of oxygen
Impacts of LCC: Loss of habitat and biodiversity
HABITAT LOSS: The reduction in the amount of space where a particular species can survive and reproduce.
BIODIVERSITY: The type, number and variety of living organisms in an environment.
Humans altered almost 75% of the Earths surface, 66% of oceans. Driven by expansion of agricultural lands, need for timber, over grazing, etc. Around 1,000,000 animals are at risk of extinction. Includes thinning, fragmentation or destruction of habitats causing a destruction of breeding grounds and habitats, soil erosion, spread of pests etc. Current rate of species loss between 100 to 10000x faster than other points in history. Australia has one of the highest rates of animal extinction globally due to rapid deforestation. SW Australia loses ~38500 ha a year. This area is a biodiversity hotspot: a region with a high concentration of endemic species that is under severe threat from habitat loss
Albedo
The amount of radiation reflected by a surface. Measured on a scale of 0-1 where 0 is no reflection and 1 is 100% reflection. Lighter surfaces reflect more than darker ones. Earth reflects around 1/3 of insolation.
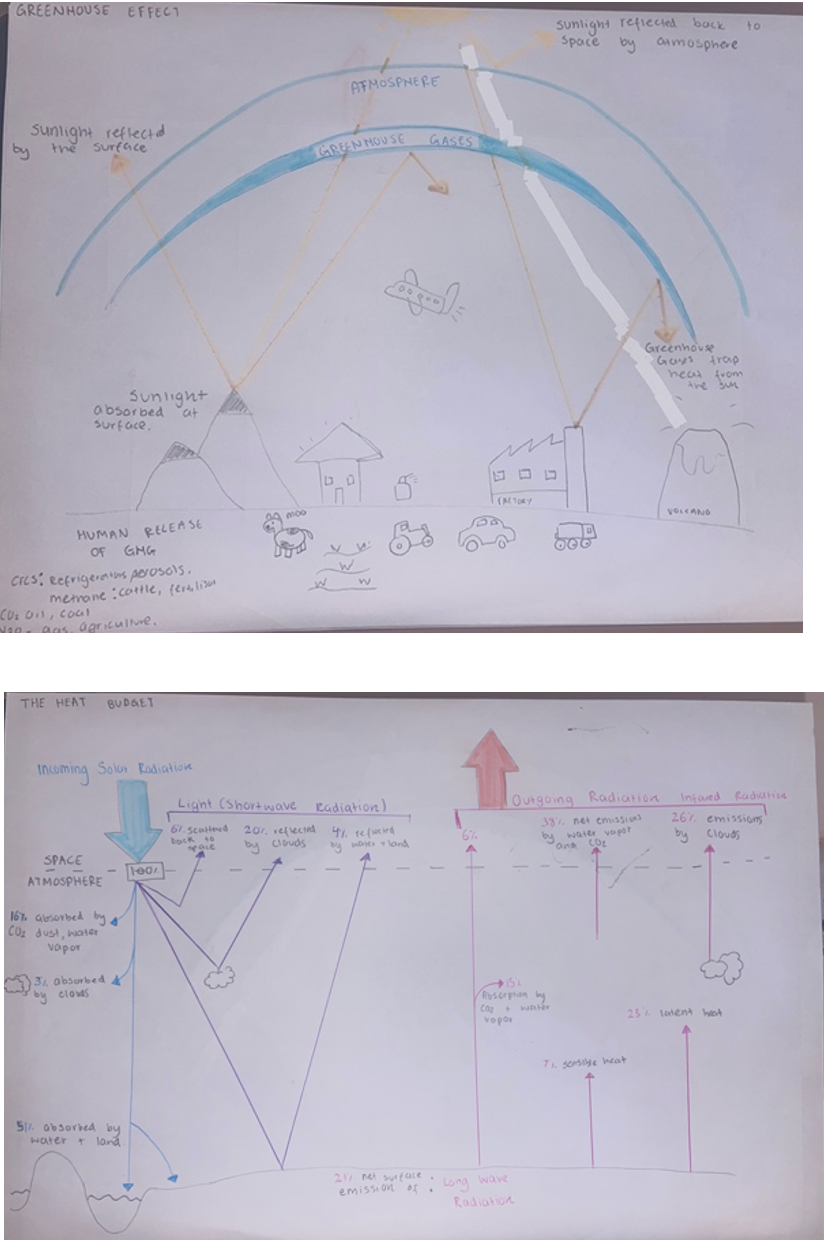
Heat budged and Greenhouse effect
Key features:
The heat budget balances between insolation absorbed by the Earth and outgoing radiation emitted by the Earth. Greenhouse effect: Greenhouse gases absorb terrestrial long-wave then re-radiates it in all directions. 100% of radiation received from the sun is returned to space. 30% directly reflected and doesn’t affect the system. 70% terrestrial radiation re-radiated into space
Influence on climate:
Moderates the temperature of the atmosphere. Any alteration in the balance of radiation can disrupt natural processes. Increased greenhouse gas concentration means more heat is being trapped for longer, leading to warming. Warming can result in rainfall changes by increasing evaporation.
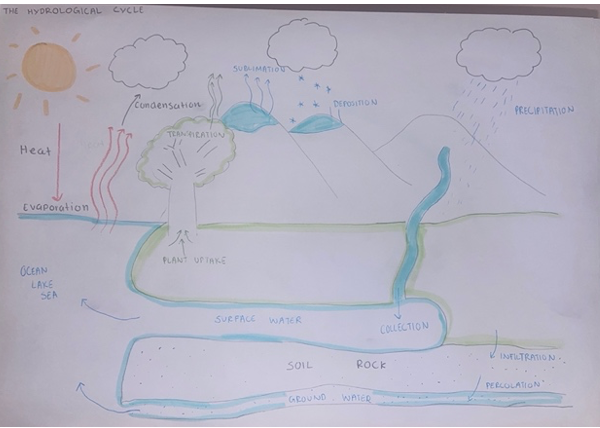
Hydrological Cycle
Key features:
The continuous movement of water through land, oceans and atmosphere as solids, liquids and gas. Removes water impurities, recycling fresh water supply. It is driven by solar energy evaporating water sources and has 6 processes: evaporation, condensation, precipitation, infiltration, runoff and transpiration.
Influence on climate:
It regulates many elements of weather: rainfall, precipitation, humidity, cloud cover and temperature. Temperature increases can amplify evaporation and transpiration leading to flooding. For example, in 2022 warmer ocean temperatures in east coast Australia led to once in 100-year flooding event in south QLD and north NSW
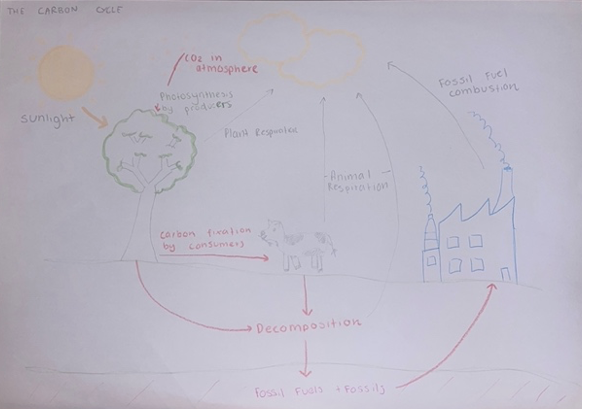
Carbon Cycle
Key Features:
The continuous movement of carbon compounds between the land, oceans, atmosphere and living organisms in it’s various states. It has 2 key elements.
-Those that remove and store CO2 from the atmosphere. Most carbon stored in rocks, is exchanged with the oceans, is removed from the atmosphere by precipitation or photosynthesis.
-Those that release CO2 back into the atmosphere. Oceans and currents bring carbon to surface where it evaporates and is released into the atmosphere, respiration creates CO2 as a waste product, and burning of plant materials.
Influence on climate:
It regulates global temperature by controlling amount of CO2, and hence the heat retention of the Earth. Increased CO2 levels enhances the greenhouse effect which warms the earth, altering rainfall patterns and increasing the frequency of hazard events such as droughts and bushfires. Since the industrial revolution, CO2 has risen 48% causing a 1.1ºC warming of global surface temperature.
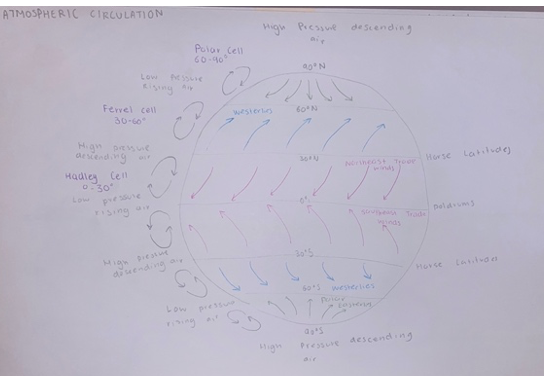
Atmospheric Circulation
Key Features:
The large-scale movement of air and is responsible for the distribution of thermal energy across the Earths surface. 3 atmospheric cell which circle the planet:
-The Hadley cell - 30-40 degrees north and south of the equator and moves heat energy away from the equator, producing high pressure regions.
-The Polar cells are located at the poles (60 degrees+ N/S) creating high-pressure zones and very cold conditions.
-The Ferrel cells are situated between the other cells. It creates low-pressure areas at the surface and high-pressure areas aloft, and acts life a gear by moving in opposite directions to other cells.
-The Coriolis effect occurs as winds are deflected from a straight path to a curved path due to the Earth’s rotation, leading to prevailing westerly and south-westerly winds.
Influence on climate
Controls distribution of thermal energy and moisture across the Earth’s surface, influencing cloud and precipitation. Low pressure is associated with unstable, inclement weather, with a chance of rain or storms. High pressures associated with fine, stable conditions with clear skies.
Natural Cause of Climate Change 1
solar variations
The sun plays a large role in determining Earth’s climate, and thus any changes to the amount of radiant energy emitted by the sun alters our climate.
AGING SUN: For every 1 billion years, the suns brightness increases by 10%, increasing insolation reaching earth.
SUNSPOT / SOLAR CYCLE: 11 year cycle of huge, magnetic storms occurring on suns surface that increases expulsion of radiation and its magnetic field breaks. Extra radiation is released as coronal mass ejections and solar flares. Alters insolation reaching Earth if ejected in our direction. Usually contains a regular number of sunspots in each cycle, however variations do occur. E.g. In 1650-1715, Maunder Minimum period saw almost no sunspots, creating a cooling effect. European winters were ~1ºC colder and longer.
It has a short-term effect as heat is fast to disperse.
Natural Cause of Climate Change 2
volcanic eruptions
Large volcanic eruptions influence climate by throwing gases such as sulphur dioxide, carbon dioxide, dust and ash into the atmosphere. Although greenhouse gases are emitted to create a warming effect, sulphur dioxide can reach the upper atmosphere, where it can transform into droplets of sulphuric acid or aerosol which reflect insolation, causing a cooling effect. It can take up to 7 years for aerosol to disappear, resulting in a volcanic winter. Super volcanoes are substantially larger than all other eruptions in geological times, producing long lasting effects on climate. E.g Lake Toba super volcano in Northern Sumatra was the largest volcanic eruption of the last 25 million years. It erupted 75,000 years ago spewing 100 billion metric tonnes of sulphur dioxide into the atmosphere. It caused a global 3-3.5ºC cooling volcanic winter lasting years, pushing species to the brink of extinction.
Anthropogenic forcing of climate change
The enhanced greenhouse effect has been created by the forced release of GHG from their terrestrial state into the atmosphere.
Increases terrestrial radiation trapped near Earths surface, creating accelerated warming. Most contributions occurred over the last 200-300 years.
Anthropogenic forcing of climate change 1
agricultural
~20% of anthropogenic GHG emissions.
RICE CULTIVATION: Wet rice cultivation involves flooding a field, which cuts off the oxygen supply from the atmosphere to the soil, causing anaerobic fermentation, creating methane as a waste product. Rice cultivation contributes to 50-100 million tonnes of methane per annum.
LIVESTOCK: Largest contributor to agricultural GHG creating 29% of methane emissions, 9% of CO2 emissions and 65% of nitrous oxide emissions. Caused by respiration, land clearing, manure, processing and transport. Methane is created from ruminant livestock during their digestive process – enteric fermentation. A waste product of methane which is eventually released.
Since the IR, methane emissions have increased due to expansion and intensification of agriculture, however their sequestration has stayed the same or reduced due to deforestation, increasing the rate of global warming
Anthropogenic forcing of climate change 2
DEFORESTATION
Dual cause of cause of climate change as it: Releases CO2 into the atmosphere and reduces the ability of ecosystems to removed CO2 from the atmosphere.
Forests are carbon reservoirs (Sequestering and storing large amounts of carbon). CO2 is absorbed by photosynthesis where it is converted into carbon and is stored in plant fibers. If trees are removed by biomass burning, CO2 is released. Over 2015-2017, global tropical forest loss contributes to 4.8 billion tonnes of CO2 a year.
Changed albedo can cause climate change. Forests have a higher albedo than bare soil, seeing higher evapotranspiration rates, increasing rainfall. When forests are cleared, surface reflectivity increases, causing less heat to be absorbed and less moisture to bet taken into atmosphere and reducing evapotranspiration.
E.g. Australia’s SW regions saw a 20% rainfall decrease due to extensive deforestation from the 1970s.
Rate of climate change
More recent climate change is occurring at a rate much faster than in the past. Significant evidence this is attributed largely to anthropogenic processes.
Rate of climate change 1
INCREASED CO2
The amount and rate of CO2 occurring in the atmosphere has increased since 1750. Anthropogenic activities have raised atmospheric concentrations of CO2 by almost 50%. 417ppm as of 2022, 278ppm in 1750. The annual rate of increase in the past 70 years is 100 faster than any previous increase ever recorded. CO2 emissions continue to increase levels unprecedented to known history.
Rate of climate change 2
INCREASED GLOBAL TEMPERATURE
Earths temperature is maintained at an average of 15ºC by the global heat budget. CO2 is the primary greenhouse gas emitted by humans, which absorbs and reradiates infrared radiation back to Earths surface. An increase in CO2 concentration leads to an increase in Earths average global temperature. Due to CO2 rises: The average global temperature has increased by 1.1℃ since 1880. Since 1981, combined sea and surface temperature has increased at a rate of 0.18°C per year. Because CO2 remains in the atmosphere for 100 years, even if all anthropogenic CO2 emissions were to stop today, global temperature is projected to reach 1.5ºC of warming.
Rate of climate change 3
GLOBAL ICE MELT + SEA LEVEL RISE
Today there are two ice sheets in the world: the Antarctic ice sheet and the Greenland ice sheet. Since 2002, both sheets are losing mass quickly, with Greenland’s melting at 5 times faster over the last 20 years. Arctic sea ice minimum is declining at a rate of 13% per decade. If glaciers melt, sea level rises. Sea ice, ice sheets and glaciers play a role in supporting Earths energy balance by reflecting insolation, maintaining temperature and keeping local air cool and maintaining the global ice extent.
Evidence for climate change: Geological time
Proxy data extracted from ice core modelling. Ice cores are cylindrical tubes extracted from ice sheets using a specialised drill. They tell scientists about past temperature, precipitation, atmospheric composition, volcanic activity and wind patterns. Bubbles trapped within the ice captures historical gas concentration and composition of our atmosphere. These cores contain distinct layers that form throughout the years. With each year, snow falls over the ice sheets and each with a different texture and chemistry. The chemical composition of the snow can tell scientists about the temperature in the area, as colder temperatures lead to a lower concentration of heavier oxygen isotopes in snow. . Wind patterns can be determined by taking multiple ice cores in an area and determining patterns based on where the snow drifted by the thickness of the layers. Dust from nearby locations can also accumulate in the layers of the ice cores, showcasing volcanic eruptions. It allows scientist to date the age of the ice cores and therefore the climatic conditions of the time. For example, the Vostok ice core obtained in 1987, taken from a depth of 3190 meters dated back 800,000 years of climate, has revealed eight glacial cycles through its layers. This evidence is crucial for understanding historical climate fluctuations and their driving factors.
Evidence for climate change: recent human history
One major type of evidence for climate change in recent history is the atmosphere. Global temperature measurements have shown that each of the last 3 decades have been successively warmer at the Earth’s surface than any preceding decade since 1850. Globally 19 of the 20 hottest years ever have been since 2000. In Perth, the summer of 2021-22 was the hottest on record in term of mean temperatures, with a mean maximum 2.5 ºC above average and a mean minimum 1.2 ºC above average. There is a direct relationship between atmospheric concentration of GHG and atmospheric temperature, measured by taking samples at monitoring stations such as Cape Grimm in Tasmania, or measured by remote sensing satellites. Since measurements began, the concentration of GHGs have increased almost 50% increase from pre-industrial levels. The global mean CO2 level in 2021 was 417ppm and is most likely highest level in 2 million years. Global methane concentration is 262% higher than 1750, nitrous oxide concentrations are 123% higher than 1750 and both gases at their highest concentration for at least 800,000 years. even if 100% of CO2 emissions were stopped, there would still be a 1.5 degree increase in temperature by2050
Present impacts of climate change in natural environment: ICE SHEETS AND GLACIERS
Due to an increase of atmospheric concentration of greenhouse gases, a 1.1ºC increase in global surface temperature has been observed, meaning there is less ice accumulation and greater ice melts occurring. According to NASA’s observations and data, over 50% of glaciers have been lost since the start of the 19th century. As a result, food supply and accessibility has declined for many native species. For example, Arctic ringed seal numbers are declining due to less ice-dwelling prey and an increased risk of predation from killer whales moving into once inaccessible ice-covered regions. However, an ice retreat has allowed some species, such as the Adélie penguin, to thrive by making foraging trips faster (3.2-7.9 hours quicker) when sea ice is low.
Projected impacts of climate change in natural environment: ICE SHEETS AND GLACIERS
It is estimated by 2050, there will be a 1.5 degree increase in temperature since the industrial revolution because of climate change. The global glacier volume, excluding those on the periphery of Antarctica and the Antarctic and Greenland ice sheets, is projected to decrease by 15-55% for the best case scenario. For all emission scenarios, Arctic sea ice reductions are expected, and in the high emissions scenario, a nearly ice-free summer Arctic Ocean is likely before mid-century. Ultimately, this means that many ice-dwelling species will lose their habitats and likely go extinct.
Present impacts of climate change in anthropogenic environment: AGRICULTURE
Climate change impacting the atmosphere has resulted in precipitation changes. A 20% decrease in rainfall has been observed in south-west Australia since 1970, causing some regions to see a decline in arable land. Thus, farmers have had to invest more resources into irrigation, or have moved production to areas with more reliable rainfall and moderate temperatures, such as towards the coast in Western Australia. Furthermore, an increase in natural hazard frequency has been observed, impacting agricultural environments. For example, the 24 million hectares lost in the Black Summer bushfires in 2019-2020 impacted approximately 1/4 of agricultural land, causing a loss of an estimated 4-5 billion dollars, a rise in food prices and job loss.
Projected impacts of climate change in anthropogenic environment: AGRICULTURE
It is predicted that between 2003 and 2080, there will be an increase in agricultural land cover in the Northern Hemisphere due to satellite data showing increased plant growth in the area. Temperate regions are expected to see an increase in arable land due to changing climatic conditions, with Northern Russia is expected to have a 150% increase, seeing 20 more frost free days annually, increasing crop production. However, tropical and subtropical areas are expected to see a decline in arable land due to water scarcity and heat, such as in India and Australia. Additionally, the number of extreme fire events in southern and eastern Australia is projected to grow 10-50% for low emissions, and 100-300% for high emissions.
Adaptations for climate change
make alterations or adjustment in response to a changed environment, involving actions to live with new conditions rather than to reverse or stop changes that have occurred.
Desalination and genetically modified crops and prescribed burns.
Adaptations for climate change 1
DESALINATION
Rainfall in Perth has decreased by 12% since 1990. In areas where rainwater supply is reducing, more water storage and infrastructure is needed to support rivers, lakes, irrigation etc. To cope with increasing populations and changes to rainfall caused by climate change desalination plants have been constructed. Desalination is the process of removing salt and other minerals from water sources to make water suitable for drinking and irrigation via reverse osmosis and filters to remove impurities. Perth has 2 desalination plants which produced 45% of it’s water supply in 2020-21. The Perth Seawater Desalination plant in Kwinana, opened in 2006, produces 15% of Perth’s water supply and has allowed for groundwater to be replenished more frequently. It doesn’t lead to further depletion of other water supplies as the sea is plentiful, and they provide an abundant source of water regardless of rainfall. However, they are very expensive to build and operate ~$2.20 Kl compared to $0.20Kl from surface water dams, leading to the cost being passed onto the public. It also produces ~1.5L of polluted liquid as a waste product. Desalination does not solve the problem of a diminishing water supply, which is why it is an adaptation strategy.
Adaptations for climate change 2
GENETICALLY MODIFIED SPECIES
With an increase in the frequency of extreme weather conditions as an attribute of climate change, regions such as southwest WA must adjust their farming practices to these new conditions. Genetically modified species have been specifically created to cope with the changing climate to avoid crop loss, covering 12% of the worlds cropland. Individual genes with desirable traits are transferred from one organism to another to make crops pest, heat, salt, drought, herbicide tolerant or resistant. For example, rice makes up about 20% of global calories consumed. Bangladesh, a core rice producer, is expected to see a 24% increase in flooding if global temperatures increase by 2 degrees. A solution is scuba rice, which can withstand extensive periods of soaking in water. This allows for the yield of rice to be maintained despite global climate change. Furthermore, demand for livestock is expected to double by 2050. An increase in temperature by 1-5 degree can result in high mortality for cattle, causing a 5-15% decrease in milk production. Crossbreeding could combat this, with traits such as the slick hair gene, increasing thermoregulation so cattle can survive despite changed climate. However, there are concerns on gene transfer, as these species breed into indigenous populations, eroding local diversity. Ultimately, they are an effective strategy in adapting to new climate conditions.
Other adaptation for climate change: Prescribed burns
A land management technique where fire is intentionally set under controlled conditions to reduce excess vegetation. As climate change increases the frequency and intensity of wildfires, prescribed burning prevents their severity. Between July 2019 and January 2020, over 10 million ha burned across Australia, and in that same year. The Department of Fire and Emergency Services (DFES) supports private landowners with advice on how to burn leaf litter and fuel loads, reducing risk of damage to property, livestock, environment and surrounding properties. This ultimately leads to an adaptation to the new, warmer environment to prevent adverse effects of climate change.
Mitigation for climate change
Mitigation involves the implementation of strategies to eliminate or minimise the severity of a hazard or similarly adverse occurrences and are essential to reduce effects of climate change.
As humans are the main cause of climate change, most mitigation strategies involve reduction or prevention of anthropogenic greenhouse gas emissions, such as using renewable energy and dietary changes.
Mitigation for climate change 1
RENEWABLE ENERGY
Renewable energy refers to energy that is derived from resources that are essentially inexhaustible, meaning they can be used indefinitely as they are rapidly replenished by natural processes. It helps mitigate climate change by creating electricity without producing any greenhouse gas emissions which increase temperatures, as most CO2 emissions are from the energy sector. As outlined by the Paris Agreement, if the transition from fossil fuel energy to renewable energy is accelerated by 2030, average global temperatures will be limited to a 2°C rise. Although investing in renewable power sources can be costly, improvements in technology, economies of scale and a more competitive supply change has caused a dramatic decline in its cost, with wind or solar power being the cheapest source of new energy. Rottnest island is an example of a location that has switched to renewable energy. In 2022, the State Government announced that $62 million would be invested into upgrading energy infrastructure, using renewable power for 75% of the islands energy, which should abate 4000 tonnes of carbon emissions annually. Thus, the implementation of renewable energy will reduce fossil fuels consumed for energy production, reduce greenhouse emissions, decreasing the trapping and heating of the Earth’s surface, and mitigate climate change.
Mitigation for global climate change 2
DIETARY CHANGES
Agricultural land is a leading cause of deforestation, soil degradation and global climate change. A shift to plant-based diets is a key opportunity to mitigate the impacts of climate change and reduce global greenhouse gas emissions from the agricultural sector. 26% of global emissions come from the production of food. With significant dietary changes by 2050, millions of square kilometres of land could be freed up and up to 8 billion tonnes of CO2 emissions could be reduced annually, reducing the enhanced greenhouse effect and hence climate change. A single plant based patty generates 90% less GHG compared to meat patties, and without meat and dairy consumption, global farmland could be reduced by 75%. However, meat is a significant part of our culture, leaving many unwilling to give it up. Additionally, the meat industry is highly economically significant in Australia, with our meat industry worth $75billion, thus it could cause negative effects upon our economy. Ultimately, dietary changes are key to mitigating global climate change as a ‘business as usual’ approach to animal product consumption will see an 80% rise in GHG by 2050, leading to significant changes to our climate.
Evaluate a strategy for LCC: Living streams
Land cover change refers to the changes that take place on the Earths surface as a result of a variety of natural and human causes. Living streams are an example of a strategy that aims to address land lover change, particularly focussing on water quality, sedimentation, habitat loss, eutrophication and erosion. It involves altering the shape of a drain to mimic the characteristics of a natural stream system. The drain is turned into a meandering shape, native reeds, sedges and shrubs are planted along the bank to stabilise it, reducing sedimentation, eutrophication or erosion while simultaneous providing a habitat for native wildlife. Although it does have its costs in terms of sustainability, meeting the needs of current and future generations through simultaneous economic, environmental and social adaptations and improvements, the benefits outweigh them.
Social sustainability.
Living streams have a moderate social sustainability level. They provide a more aesthetically pleasing space for recreational activities such as bushwalking and bird watching, increasing local amenity. However, there are some perceived health concerns on the area becoming a vector recruitment zone of diseased mosquitoes, snakes etc, however evidence suggests this is untrue. Although beneficial, if these concerns were addressed, these streams would achieve greater social sustainability.
Environmental sustainability.
Living streams excel in terms of environmental sustainability. The native plants not only provide a viable habitat for wildlife but also absorb excess nutrients and stabilise banks to reduce sedimentation and eutrophication, increasing the water quality of the stream and connected water bodies. For example, the urban section of the collier pines main drain observed 0 invertebrates and had a turbidity value of 300NTUs. However, the living stream section observed 9 species and had a turbidity of 33NTUs. Furthermore, they act as a green corridor in urban areas, reducing surface temperature up to 6º. However, living streams can take extremely long to be constructed and established, having a very delayed impact on the environment. However, this downside is heavily outweighed by the many positives of the strategy, making it highly environmentally beneficial.
Economic sustainability
Living streams struggle in terms of economic sustainability. Although housing prices near the streams have been seen to increase – houses located in a 200m radius of Bannister Creek living stream increased in value by $7000-26000, they are expensive to construct, costing up to $5000, with ongoing maintenance costs being larger than that of an open cut drain. Furthermore, their long periods of construction can have an adverse impact on local businesses due to noise and debris.
Evaluation of sustainability: Artificial Oxygenation
Artificial oxygenation is a mitigation strategy that aims to address sedimentation, loss of habitat and biodiversity and eutrophication. It provides a habitat for aquatic animals and promotes healthy ecological processes to break down organic matter and recycle nutrients, reducing algal blooms. When sensors detect low oxygen levels, water is pumped from the river to the land-based plant and dissolved oxygen is increased to very high concentrations. The oxygen-rich water is returned to the river via distribution pipes, and rapidly diluted and dispersed up and downstream. Through this, phosphate is bound to sediment so algae cannot use it for growth even in the event of an algal bloom, increasing water quality.
Social sustainability
Artificial oxygenation has a moderate level of social sustainability. Oxygenation plants provide jobs for engineers who run and maintain the plants. Oxygenating the water also prevents anaerobic decomposition, which releases a rotten-egg smell, enhancing the public amenity of the rivers. However, some stakeholders believe they decrease the river beauty by being an eyesore, and areas undergoing reoxygenation cannot be used safely by the public, angering stakeholders such as Boating WA. Thus, greater social sustainability would be achieved by addressing these issues and working with locals to improve social sustainability.
Environmental sustainability
Artificial oxygenation has a high level of social sustainability. Oxygenation processes improve oxygen conditions in 39-92% of the target oxygenation zone, providing a habitat for aquatic wildlife, which would otherwise die in hypoxic conditions due to large algal blooms. Oxygenating water also binds phosphorus to sediment, reducing the amount of phosphorus available in the water for algae to grow. However, the effect is localised, oxygenating water around 5km on either side of the pump. Furthermore, oxygen concentrations decline as soon as the plant is turned off. Thus, the many environmental benefits of artificial oxygenation outweigh the downsides.
Economic sustainability
Artificial oxygenation has a moderate level of economic sustainability. It is a relatively affordable and viable strategy for the government as the plant does not need to run continuously due to sensors triggering activation when levels decline below 4mg/L. However, operational costs and infrastructural demands for the plants will only increase as climate change increases the impacts of eutrophication. Their maintenance is also costly at $200,000-400,000 per annum per plant.
Strategy for LCC: Local
LIVING STREAMS
Living streams are an example of a strategy that aims to address the impacts of land cover change. Following European colonisation, agriculture and urban landscapes were constructed surrounding the banks of the Swan and Canning rivers in Perth, meaning that much land was cleared. Many urban drains were constructed that lead into these rivers, which could bring in sediment and cause pollution. This project, funded by the Department of Biodiversity, Conservation and Attractions and local councils will help reshape these drainage channels and improve the surrounding environment. It particularly aims to address and combat soil erosion, loss of habitat and biodiversity, sedimentation, eutrophication and water quality decline, involving reconstructing artificial drains to mimic the characteristics of a natural stream system. It involves planting native shrubs, reeds and sedges along the bank of the stream, and changing its shape from a straight line into a meandering shape, seen in FIG 1. This stabilises the bank and slows water flow, reducing runoff and sedimentation while simultaneously reducing eutrophication and algal blooms. Together, this increases water quality and creates habitats for native wildlife in the stream and along joined rivers and lakes. For example, on our fieldwork at the Collier Pines main drain, we observed 0 invertebrate species and calculated a turbidity value of 300NTUs in the urban drain. However, in the living stream portion of the drain, we observed 9 species and a turbidity of 33NTUs, exhibiting
Strategy for climate change: Regional
Yarra Yarra Biodiversity Corridor
Intensive agricultural land-use systems have changed the landscape in Western Australia's northern agricultural region through the clearing of natural vegetation and the compaction of soil. The Yarra Yarra biodiversity corridor aims to address soil erosion and degradation, loss of habitat and biodiversity, and loss of ecosystem services. Made up of 12 nature corridors that covers an area of 10000sqkm. By revegetating the landscape with native shrubs and trees, wildlife is encouraged to return, while also capturing and storing carbon from the atmosphere through reforestation. The area which has lost between 70-90% of its natural habitat, is home to thousands of endemic species. It utilises a combination of direct seeding and hand planting, composed of a woodland ecosystem to reflect its pre-cleared vegetation, such as York Gum and Eucalypt species. Habitats for four key species have been identified that the corridor aims to reconnect: Malleefowl, Carnaby’s cockatoo, Western Spiny-tailed Skink and Woylie. The corridor targets both climate change and biodiversity, white addressing 17 of the United Nations Sustainable Development Goals.
Rural places
Any place which is not part of an urban area, with population clusters under 1000 people. Generally, have a lower population density and large amounts of undeveloped land, with majority of people engaged in primary industries.
Urban Places
Places with population clusters above 1000 people. Generally, have a higher population density and lower amounts of undeveloped land, with majority of people engaged in secondary, tertiary and quaternary industries.
Megacity
A metropolitan area with a population of over 10 million people that has formed by the urban amalgamation and agglomeration of several cities and suburbs.
Urbanisation
The proportion of people living in urban areas compared to rural areas.
The process of urbanisation
The increasing percentage or proportion of people living in urban areas of a country. This typically involves the movement or shift of people from rural to urban area or a large influx of migrants into urban areas at a greater rate than into rural areas.
Urban Growth
An increase in the number of people living in urban places. Typically increase in urban growth = increase in level of urbanisation. 56% of the world’s population lives in urban areas, up from 30% in 1950. Urban populations tend to be higher in MEDCs (78.7%)
Liveability
The quality of space and the build environment. It is linked to a range of factors: Quality of life, health, sense of safety, access to services, cost of living, comfortable living standards, mobility and transport, air quality, social participation
implications of urbanisation on world population growth in rural places
As people migrate from rural to urban areas for better healthcare, employment and lifestyle opportunities, urban populations have rapidly increased - growing from 30% to 56% globally between 1950 and 2020. This contributes to the expansion of megacities as people move from primary industries into secondary and tertiary industries, with 43 megacities expected to exist by 2030.
In contrast, rural areas experience population decline and ageing due to a lack of resources and opportunities. For example, 9 of the 10 top percentage population declines in WA between 2006 and 2016 occurred in rural places, with Northampton declining by 4.3%. This migration, especially of younger women, reduces birth rates and leads to negative natural growth.
Economic interdependence between rural + urban areas
Rural and urban places are economically interdependent in terms of agriculture. Food/ fibres produced in rural places are transported to urban places as not only are they a market for these products, but raw materials are processed and redistributed there as packaged food products to other urban and rural places. E.g. Masters Milk is farmed in rural areas such as Pinjarra, then transported to a centre in Bentley to be processed and distributed.
Environmental interdependence between rural + urban areas
In terms of environmental interdependence, ecosystem services are essential to human survival and wellbeing in rural and urban places. Rural places provide urban places with most ecosystem provisioning services such as water, while urban areas provide the policy and management framework to protect these ecosystem services for both rural and urban populations.
Historical Factors for spatial distribution
British colonisation
Urban centres were established on the coast, becoming state capitals. The first settlement was established in Sydney in 1788, and the Perth Swan River Colony in 1829. Infrastructure was centred here due to the need for water transport and the fact that the British were not adapted to the harsh inland environment, becoming hubs of economic activity. Later, the need for rural farming areas, creating new urban settlements such as Bathurst NSW and York WA. As they were established during the IR, large-scale enterprises meant there few labour opportunities, causing few rural populations.
Cultural Factors for spatial distribution
Australians are renowned for their value of coastal life, reinforcing the pattern of dense settlement along the coastal zones. The reliance on private car ownership has seen many Australians willing to drive long distances for daily activities, causing urban places such as Perth and Sydney to expand over a greater area than most other cities of a similar population.
Rural-urban drift has seen young adults to move from rural places to urban places due to greater opportunities. However, retirees often migrate rural for a sea or tree change creating larger rural centres and a loss of smaller rural places. E.g. Mandurah population has 97,000, Greater Gold Coast-Tween head regions in QLD has over 718,000.
Economic Factors for spatial distribution
Capital cities and ports are the centres of economic activity. With ~ 80% of global merchandise being transported by sea, ports such as Fremantle Port attract businesses to establish nearby, expanding the surrounding urban centres and increasing employment.
Agriculture has resulted in a low density, dispersed pattern of rural settlements. The distribution of rural towns often aligns with farming regions like the Wheatbelt in WA or Wagga Wagga in NSW, with small rural places scattered every 30-40km. As farmers expand their plots, a loss of population occurs as small rural centres shrink and larger ones grow.
Environmental for spatial distribution
Climate
The southern half of Australia, dominated by a mediterranean climate was favoured by the first settlers for the good seasonal rainfall and mild temperatures. These more favourable agricultural regions in areas like Augusta and the QLD coast contain the highest concentration of both urban and rural places.
In the arid and semi arid climate inland and NNW of Australia, the hot, dry weather and droughts made agriculture less productive and living uncomfortable, causing few rural and urban settlements here.
Age demographics in urban and rural places
Australia’s population is ageing because of low fertility and increasing life expectancy. Resulted in proportionally fewer children and a larger proportion of over 65 year olds.
In large urban places, 20-49yrs are becoming the largest group as they are subject to push/pull factors such as education and employment, making up 44% of the combined capital city population, compared to 36% in the rest of Australia, and have fewer people 55+ (32%) than the rest of Australia (39%).
Rural places are experiencing an ageing population with a high proportion of 58-80+ year olds as young adults leave and retirees migrate to rural locations, such as Albany with a median age of 49.
Gender demographics in urban and rural places
In capital cities, the sex ratio shifted to its lowest value of 98.2, indicating slightly higher share of females in urban places. In places outside of capital cities, the ratio was 99.2, due to male dominated industries such as mining and agriculture located here.
Socioeconomic demographics in urban and rural places
Urban dwellers tend to have a higher socioeconomic status. In all states and territories, the largest urban place has the highest average income, with median weekly income at $1747, due to greater education and employment opportunities with higher salaries.
Rural places tend to have lower average incomes, containing more retirees and a fewer jobs. A shift to FIFO employment resulted and a decrease in construction associated with the mining boom alters the average income of these regions, such as in Marble Bar as the median weekly household income decreased from $1410 in 2016 to $1035 in 2021.
Cultural demographics in urban and rural places
Waves of migration are influenced by economic growth, global events and government policy. E.g. 1978 – national multicultural policy.
Australia’s largest urban places display the greatest cultural mixes. Urban dwellers usually migrate to urban places, or to where people they know have moved (chain migration). Melbourne has the largest Greek population outside of Greece (over 150,000). Perth has the highest numbers of overseas born residents and cultural mix at 35%. Rural places attract migrants with skills that can be applied to the land uses in these areas. Market gardening in areas such Geraldton attracted Vietnamese migrants and farmers after the Vietnam war, using their agricultural skills to work.
Urban Sprawl
The outward spread of typically low density residential and urban development on the periphery of urban areas.
Urban Australia usually a low-density. Single story, detached homes on the outer edge of the urban area. Significant in Melbourne, Sydney and Perth, sprawling around 150km along the coast.
Invasion and Succession
The gradual invasion of one land use type into an area dominated by a different land use, succession has occurred when the invading land use has almost completely transformed the land use in that particular area.
In the Rural-Urban fringe, agricultural land has been converted into residential or industrial functions. E.g. Baldivis in south Perth.
Urban Renewal
The rehabilitation of urban areas, by regeneration, replacement, repair or renovation, in accordance with comprehensive plans, typically larger scale redevelopment projects, usually initiated by government.
East Perth redevelopment: Once industrial location became abandoned and polluted, the area underwent a transformation into an upmarket residential area and polluted creeks such as the Claisebrook Creek were regenerated.
Land Use Planning
Planning policies and regulations that play an important role in shaping the land uses and characteristics of urban and rural places. Land use planning includes land use zoning, transport planning, grouping of compatible land uses, creation of buffer zones between incompatible land uses, determining residential densities, renewal project and planning for future growth.
State governments are responsible for overall planning. E.g. Perth and Peel@3.5 million is a 20-30 year plan to guide long-term growth of Perth to manage where and how people will work and live (transport, health facilities etc.)
Land Use Competition
The competition that occurs between different land use functions when more than one land use can benefit from a particular location. This competition increases the land value and usually the land use that can deliver the highest return on investment will locate in that particular area. For example, the centre of an urban or rural area is usually the most accessible and therefore desirable and the most expensive.
Intertia
Resistance to movement; often would benefit from changing location but instead decisions are made to keep them where they are located.
Usually due to high relocation costs or older heritage listed buildings.
E.g. Old Perth Town Hall is one of the earliest convict-built structures in Perth, so its historical and cultural significance ensures it is maintained in its present state despite the land being a good area for commercial activity.
Agglomeration
A group of similar, but not necessarily the same, land uses that locate in the same area in order to benefit from common infrastructure and each other’s operation.
E.g. Retail outlets located together as comparison shoppers boosts sales – Hay Street Perth and Queen Street Sydney.
Challenges facing places outside major cities. FIFO Work patterns
Many mining companies have transitioned to a FIFO workforce for their rural mine sites due to the financial benefits of needing less services or facilities. Causes loss of revenue to local businesses and government revenue in rural areas as spending declines. Rather, employees take their salary back to their place of residence. A large influx of non-resident works is a permanent disruption to the social fabric of a town and can have negative impacts to the safety, amenity and image of communities. E.g. The WA mining town of Telfer has suffered as a community from the change. In 1996 when the mining company converted to FIFO work, the community no longer contained the same sense of identity as is simply became a location for employment, losing many commercial services.
Challenges facing places outside major cities. Isolation and remoteness
Due to their remoteness, rural places experience a rising cost of goods and services, impacting daily life of residents. Rural residents can pay up to 3x more than those in urban areas for some food items. Due to long transportation, storage and handling of food passing costs to the consumer while also reducing food quality and the ability to live a healthy lifestyle as fresh food is not affordable.
E.g. in remote Aboriginal and Torres Strait Islander communities, food prices are up to 50% higher than the nearest capital city.
E.g. in 2022 1kg of beans in Euabalong NSW cost $36 compared to $11 in Sydney.
Challenges facing places outside major cities. Service and water provision
Rural areas often have a low population, so they have a low functional complexity where only basic goods and services are provided. E.g. fresh food must be transported, during the wet-tropical summer in northern Australia, communities can be cut of from supplies for extended periods of time. Small communities have greater challenges in maintaining and obtaining a reliable and high quality water supply. Substantial infrastructure may be needed to provide adequate water due to unreliable rainfall. Half the population of remote Aboriginal communities rely on groundwater, but are often located in arid climates, making groundwater access difficult. Negative consequences for the health of residents.
Challenges facing places outside major cities. Transport
Effective, sustainable transport options are crucial to community wellbeing, productivity and growth, thus without suitable transport it poses a challenge. Public transport is not viable in many rural areas due to low population densities. 1.7% of the rural population use public transport to travel to work compared to 20% in capital cities. As car ownership rises, public transport becomes more expensive and closes, increasing reliance on private vehicles causing a cycle of decline. Thus, cost for fuel, car maintenance increases. Those who cant drive become isolated and immobile. Lack of transport infrastructure can adversely impact access to employment, education, health services etc. E.g. Only 5 major unsealed roads outside of Darwin in NT. Some roads for close during the wet season, reducing access for producers + cutting off communities. E.g. March-April 2022, wet weather in Mid-West and Murchison regions in WA flooded roads, cutting dd the Pia Wadjarri remote community from supplies.
Site of Perth
Perth, also known as Boorloo in Noongar language, is sited on the Swan Coastal Plain between the Darling Scarp and Indian Ocean.
The darling scarp discourages development to the east, and the Indian Ocean to the West, resulting in a long north to south orientation.
TOPOGRAPHY: sandy and gently undulating 0-60m above sea level. Generally stable and well drained, = attractive for construction due to reduced costs.
VEGETATION: Originally bushland and wetlands, it supported native flora like banksias and eucalypts and offered resources for Noongar people.
WATER: Founded along the Swan River, a prominent natural water feature that bisects the city, dividing it into northern and southern regions, providing water sources and fertile soil. Many prominent lakes, such as Galup, located west of the city centre, support local flora and fauna.
Situation of Perth
SW coast of Australia in WA at 31°57’ S 115 51’ E.
CBD is 15km inland from the Indian Ocean and 17km North East of Fremantle Port.
One of the most isolated cities in the world: 2700km west of Adelaide, its closest neighbouring capital city, and 180km north of Bunbury and 424 km south-east of Geraldton, its two closest regional centres.
The Perth metropolitan area is situated along major highways and railways, with radial development occurring NE, E, SE and SW along the Great Northern Highway, Great Eastern Highway, Albany Highway and South Western Highway . CBD is located at the junction of these.
External Morphology
Study of the outward shape of a settlement and the processes that affect that shape. In Perth, value of the Australian Dream has led to low-density, sprawling development, covering a large area.
Semi-stellate, becoming rectangular as infill develops between the original corridors, seen in figure 1. The 1970s Corridor Plan shaped this, promoting growth along the four main corridors. As these corridors have expanded, Perth’s become increasingly rectangular. The metropolitan area spans approximately 1,600 km2, extending roughly 150km north to south from Two Rocks to Mandurah and 30–40km east to west, constrained by the Darling Scarp and Indian Ocean.
Perth has a compact core, radiating from the original settlement. The Swan-Canning River system divides the urban area and encourages the semi-stellate shape, with the four main corridors being linked to major transport routes along Mitchell Freeway, Great Eastern Highway, Albany Highway and Kwinana Freeway. These transport links have encouraged radial development, influencing the city’s north-south extension.
Satellite communities, pockets of smaller urban developments separated from the main urban area e.g. in Ellenbrook and Byford. infilling can cause the separation of these areas to diminish, seen when Brabham and Dayton almost connect Caversham to Ellenbrook.
Internal morphology
The layout of the functions within a settlement, and the processes and interactions that affect that layout. Perth is comprised of eight functional zones seen in figure 1, each with distinct characteristics.
Perths CBD
On the north bank of the Swan River
Grid like street patterns.
Most intensive land use zone with high-density, high-rise buildings.
Main functions are commercial and administrative, with limited residential use, = a high daytime population and small nighttime population resulting from a commuting workforce.
Vertical zonation separates functions, with lower levels having pedestrian-accessible functions like cafes, and upper levels having corporations like the BHP Billiton offices.
Perths IMZ
Located just beyond the boundaries of the CBD,
Northbridge and West Perth,
Largest level of mixed-use functions, such as recreational and commercial.
Invasion and succession —> dynamic, e.g. residential areas convert to commercial as land values in the CBD rise, such as along Richardson Street in West Perth.
= urban blight can occur when landowners are reluctant to renovate their properties as the land becomes more valuable than the structures on it.
Perths ERZ
Largest zone.
Older housing with well-established gardens, infrastructure and good access to services and facilities, containing suburbs like Claremont and Subiaco.
Older or wealthier demographic, and land values vary by the suburb, with Claremont’s median house price in 2021 at $1.82 million, whereas to Morley’s was $522,000.
Perths NGZ
On outer boundary of the ERZ or adjoining the RUF.
May exist as satellite suburbs or developments beyond metropolitan areas existing boundary, like Baldivis.
Houses = newer with less established gardens that can be quickly developed, hence lacking access to services and infrastructure until the population is substantial enough to support these services.
Land values tend to be more affordable, attracting a younger population.
Perths IZ
Industrial functions, with light and medium industry scattered through the metropolitan area such as Myaree, and heavy industry located further like in Kwinana.
Benefits from agglomeration due to shared services and infrastructure like the use of main transport routes.
Industrial functions require a greater amount of land; sees larger block sizes, and is located where land is cheaper, often away from the CBD.
Uses are usually unsightly and noisy, requiring segregation to reducle land use conflict
PERTHS RUF
On outer edge of the metropolitan area, with mixed land uses such as rural, residential, and functions.
=Land use conflict can between undesirable functions such as industrial and surrounding residential functions.
Land values are lower and often attract functions that are space extensive. For example, rural functions like agriculture and recreational functions like golf courses.
Perths OBD
Zones within Perth dispersed throughout the metropolitan area, often in accessible locations amongst the residential zone.
Generally along major transports routes, such as lakeside Joondalup being adjacent to Mitchell Freeway.
Decentralises jobs from the CBD, and provides accessible services to the general population, predominantly retail.
Aggregation of similar businesses occurs for consumer convenience, seen along Scarborough beach.
Perths SPZ
Scattered and unevenly distributed throughout the metropolitan area.
Many are space extensive, requiring cheaper and more readily available land.
It includes functions that cannot be easily categorised, such as education facilities like UWA.
Perth Age and Gender
MEDIAN AGE: 2011 was 35.7, and in 2021 it was 37.6 years, compared with 40.4 in the rest of Western Australia = Perth has an ageing population.
Greater proportion of younger people and children 5-14 in WA compared to Greater Perth = young families attracted to the NGZ for cheaper housing and recreation compared to the higher density CBD.
20-44, Greater Perth had a higher proportion of males and females —> increased availability for higher education and employment.
Females outnumbered males: sex ratio 99.6, while males outnumbered females in the rest of Western Australia 105.1, especially seen in ages 50-80 —> Greater proportion of male dominated industries outside of Greater Perth, causing women to leave and seek employment elsewhere.
Socioeconomic distribution
Income patterns vary.
Higher incomes found in desirable coastal suburb.
The ERZ records higher levels of home ownership, as incomes are higher and houses having been owned for longer, thus wealth has been accumulated and mortgages repaid, conversely to NGZ suburbs with a lower weekly income an younger families. For example, City Beach had 49% of houses owned outright, compared to Butler at only 12%.
Low socioeconomic areas are often occupied by labourers or low-skilled workers with lower education levels, and higher unemployment. High socioeconomic trends are linked to professionals with tertiary education and higher incomes. In the CBD, 46% of residents hold a bachelor’s degree or higher, compared to 23% for WA overall.
Perth Cultural Distribution
Ethnic clustering is when groups of people from a similar background around the same location. People are naturally drawn to locations that have a familiarity as relationships can be built and a new sense of home created, or from a desire to preserve cultural identity. For example many Greek people migrated to Perth in the 1930-50s, initially locating in Northbridge and North Perth due to the first two Greek Orthodox Churches being established here.
There is also a higher proportion of migrants in some suburbs from neighbouring Asian countries such as China and India due to Australia government promoting tertiary study in Australia. For example, in Bentley which Curtin University is situated, around for the 60% of properties are rented out because of their temporary stay.
Scope of transport challenge
Transport has shaped and developed Perth, with the road transport networks resulting from site factors, historical decisions and planning. Cities like Perth were planned for the car first, then public transport, then bike, then pedestrian. In recent times, there is a shift to reverse this order as poor transport planning can create negative impacts.
SCOPE OF TRANSPORT CHALLENGE
Freeways and railway systems focus upon the CBD —> leads to traffic congestion (road network cannot sufficiently handle the number of vehicles on it)
=Users experience slower speeds, increased queuing on major networks, particularly during peak hours between 6:30am-9am and 4pm and 6:30pm.
Problem for commuters travelling in and out of the inner-city areas, with the Mitchell and Kwinana freeways being amongst the 10 worst roads in Australia for delays.
Causes of the transportation challenge
Population Growth
Metro Perth’s population is expected to grow to 3.5 million people by 2050, creating an additional 1.4 million needing to move around urban area. As a result, areas with well connected to public transport have seen increases in their usage. However, trains are already at capacity during peak hours, and the 200km of modern electric rail built since 1990 will need to double to keep up with the current rate of population growth.
Road Design
Perth’s transport network is struggling as demand exceeds supply, caused by overemphasis of working in the CBD, with narrow roads and a grid-like structure that wasn’t originally designed for the 200,000 people that converge on it daily. Invasion and succession of CBD functions around originally residential suburbs = increased day population = congestion seen along places such as Thomas Road.
Urban sprawl and car dependency
The low-density growth of the urban area extending toward the outward boundary has caused an increase in dependency on car travel. ~500,000 people in Perth have poor access to public transport.
Wanneroo, 9.5% used public transport to travel to work, and 71.3% used private vehicles.
Impacts of transportation challenge
Environmental
Transportation is a concern regarding its GHG emissions and the contribution this has to climate change. In Perth, GHG emissions are 2-3x higher than European cities due to our higher reliance on private vehicles. CO2 has a direct impact on the environment through climate change, and the average WA car is estimated to produce double its weight in CO2 annually. Photochemical smog.
Economic
Congestion impacts an economy’s productivity and ability to function effectively. In Perth, congestion costs $2.5 billion a year and is set to increase to $3.6 billion by 2031. This can result in higher associated costs as sitting in traffic decreases fuel efficiency for most vehicles. Increasing vehicles also exacerbates parking problems, with delays occurring as drivers spend up to 20 minutes searching for parking, reducing productivity.
Social
When transport networks aren’t working efficiently, users can feel frustrated and stressed, causing anti-social behaviour or road rage. A 2020 RAC survey revealed almost half of its members said sitting in traffic congestion negatively impacted their wellbeing. Furthermore, atmospheric pollution from vehicles can impact health, especially to those with asthma and respiratory issues as pollutants like nitrogen oxide can causing irritation of the lungs, reducing immunity to infections.
Stakeholder
Any individual, group, or organisation that has an interest in, is affected by, or can influence a decision, project, or issue.
Transport stakeholder 1 Perth
MAIN ROADS WESTERN AUSTRALIA (MRWA)
A state government transport agency providing safe, reliable road networks, bridges and paths to move people, ensuring the roads meet the needs of the community, industry and stakeholders.
Relates to the transport challenge = manages the road network and is directly involved in decisions about congestion and road upgrades. The are responsible for ~19,000km of roads, hoping to provide an efficient road network that improves productivity while considering urban amenity for citizens. Their focus is not reducing the number of vehicles on the road through public transport, but by creating new or upgrading transport networks to make them more socially and environmentally sustainable. E.g. they’ve worked to reduce Perth’s contribution to climate change through using 46,000 tonnes of crushed recycled concrete on roads.
Transport stakeholder 2 Perth
PUBLIC TRANSPORT AUTHORITY (PTA)
A statutory government authority that provides public transport systems and solutions in the state, including rails, bus and ferry services.
Affected by the transport = it plans and operates transport services that people depend on for mobility, and are key to addressing the issue in metropolitan Perth.
AIM: Give people a choice to improve their quality of life by encouraging people to switch from car to public transport for economic and environmental benefits.
Serive proveided = Transperth = planning the daily running of this transport network which operates around15,500 timetabled bus trips and 1,100 train service trips.
A full load of bus passengers can take over 50 cars off the road, and a full train of 1000 people can take 800 cars of the road.
Transperth has received criticisms for being unreliable, unsafe and having high fares, with discussion revealing a general dislike for public transport in Perth, accounting for its declining use.
Transport planning strategy 1 Perth
TRANSIT ORIENTED DEVELOPMENT (TODS)
Planning strategy by METRONET = integrates land-use and transport planning by building higher-density, mixed-use neighbourhoods around major public transport stations.
AIM: reduce car dependency, improve accessibility, create more sustainable, connected communities, seen around stations such as Subiaco.
Encourage people to live and work closer public transport = becomes a convenient and cost-effective alternative to driving.
Housing and retail services surrounding TODs are typically in high-rise, high-density buildings which experience an active street frontage resulting from vertical zonation as residential functions are located upstairs, and commercial functions are ground level.
Higher-density living around stations = patronage of public transport = public transport more viable = improve equity as these services become more accessible for those who cannot drive while + reducing the cars on the road.
Encouraging active transport through projects like Subi East, = promote walkability and cycle access through narrowing roads and expanding foot and bike paths, linking residents directly to transport hubs, reducing car reliance.
Transport planning strategy 2 Perth
Western Australian Bicycle Network Plan (WABN) 2014-2031
The Department of Transport developed it.
AIM: provide a safe, connected and convenient bicycle network, while also making riding a widely accepting form of transport. ENCOURAGE ACTIVE TRANSPORT
Improve cycling infrastructure and reduce serious cyclist injuries. During 2016 - 2017, an average of 8,300 riders travelled into the Perth CBD on a weekday, highlighting the high demand for such infrastructure.
The plan sets out the Long-Term-Cycling Network for Perth and Peel, which proposes new routes to create greater connectivity, creating and safe and easy to use bike routes regardless of skill or age.
The development of the Principal Shared Path Program, which are high standard bicycle routes for longer, more direct cycling trips with minimal traffic interruptions, such as the Kwinana Freeway PSP.
Within the CBD, working to develop a central transit network with bicycle paths, bicycle end of trip facilities like storage and change facilities and encouraging travel behaviour changes. This makes cycling more attractive for workers in the CBD. .
Evaluation Sustainabilty transport plan 1
An efficient public transport system is essential to a sustainable city. As Perth faces a significant transportation challenge, seeing high levels of traffic congestion, two strategies have been implemented.
WESTERN AUSTRALIAN BICYCLE NETWORK PLAN (WABN) 2014-2031
The WABN, developed by the State Government, aims to expand and improve Perth’s cycling infrastructure, making cycling a safe, connected, and convenient transport method. It addresses car dependency, congestion, and limited sustainable transport options by encouraging more people to use active transport instead of private vehicles.
Environmental
Riding a bike encourages less vehicle use on the roads.
Clean method of travel that can help limit climate change, reducing travel emissions by around 75% compared to car usage.
Less land is needed for cycling infrastructure as opposed to roads or rail networks, providing space for other land uses. However, without strong integration with public transport, cycling alone may not replace long car commutes.
Social
Reducing serious cyclist injuries.
Separated bike paths surrounding Subiaco station reduce risks of collisions with pedestrians through the implementation of soft barriers, including hedges and bushes.
More aesthetically pleasing but also reduce risk of serious injury if a cyclist collided with it, in comparison to hard barriers.
Health benefits brought about by cycling, decreasing risk of health issues such as obesity, and depression.
Economic
Cycling infrastructure savings vs car
64-bay bicycle shelter costs about $70,000, while a 50-bay car park costs around $450,000.
Bicycles are
Perth households spending ~$18,000 annually on transport in 2019, bikes can be more affordable due to reduced fuel, maintenance, and insurance costs.
However, infrastructure savings depend on strong uptake.