AP Micro Graphs
1/14
There's no tags or description
Looks like no tags are added yet.
Name | Mastery | Learn | Test | Matching | Spaced |
|---|
No study sessions yet.
15 Terms
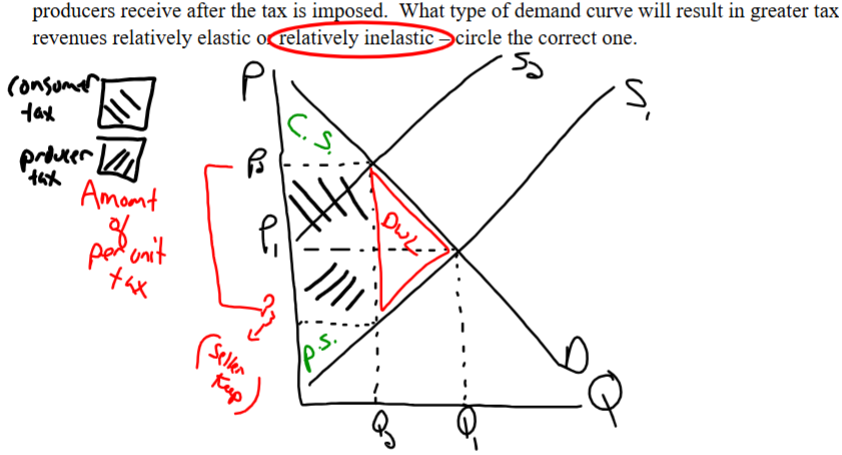
P/Q graph of Supply and Demand, add in how a per unit excise tax would affect the graph. Would an inelastic or elastic demand curve result in greater tax revenue?
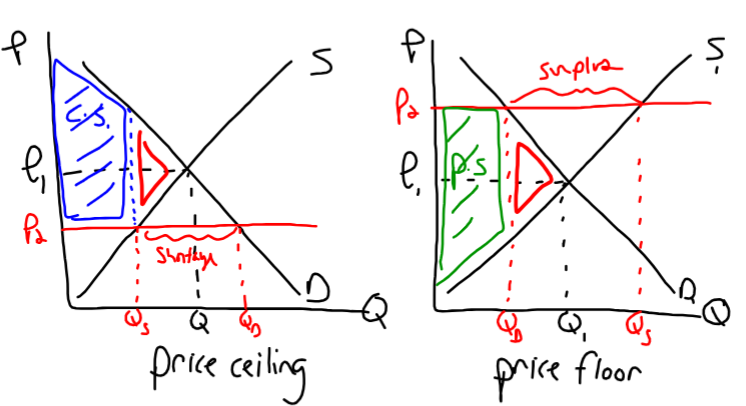
2 P/Q graphs showing effective price ceiling and price floor, including DWL
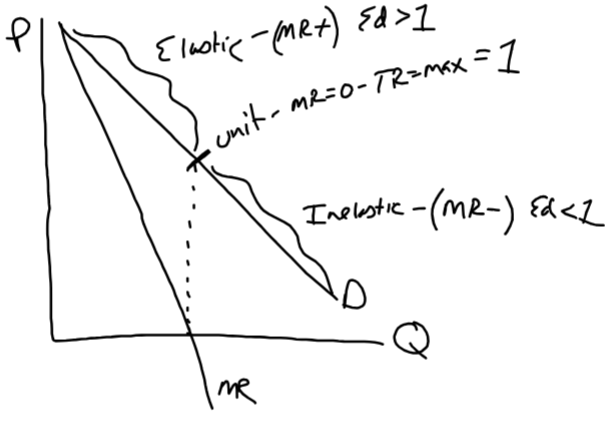
P/Q graph showing Marginal Revenue, Max Revenue, Unit Elastic, Inelastic, and Price Elastic
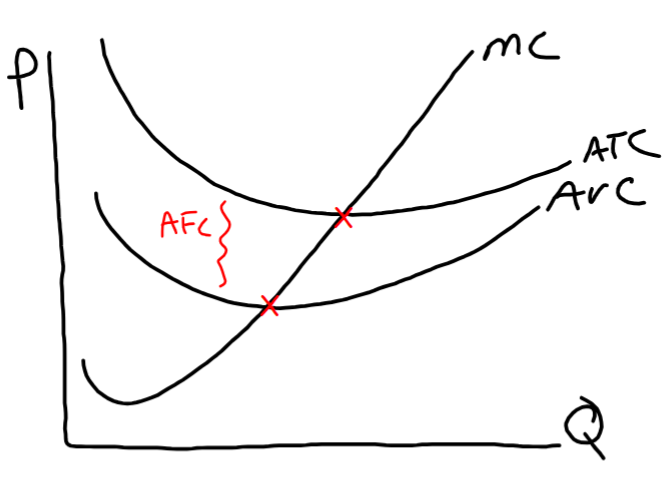
P/Q graph showing Average Total Cost, Average Variable, and Marginal Cost. Show where to find Average Fixed Cost. Mark where MC intercepts ATC, AVC.
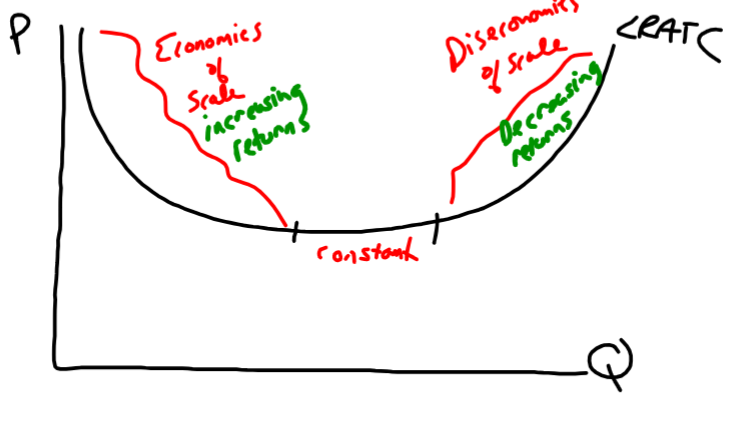
Long Run Average Total Cost curve showing Economies of Scale(increasing returns), Constant Returns, and Diseconomies of Scale(decreasing returns)
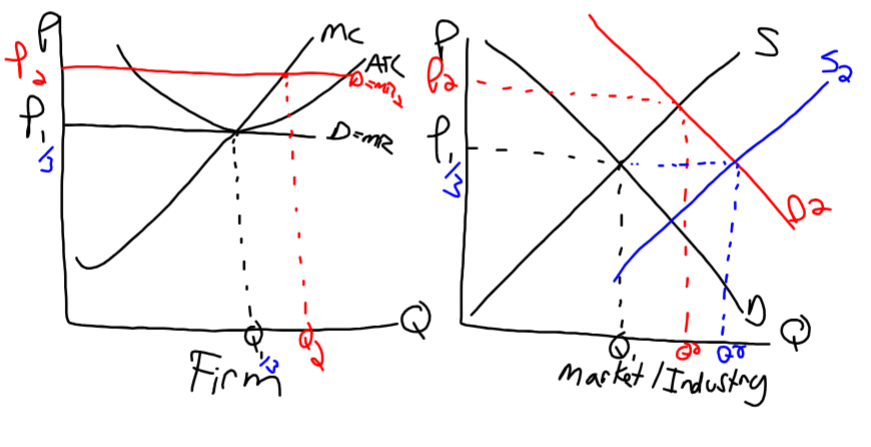
Purely Competitive Firm graph and Market/Industry graph. Show how consumer demand increasing will affect both, then show the Long Run Adjustment that resulted from the inc.
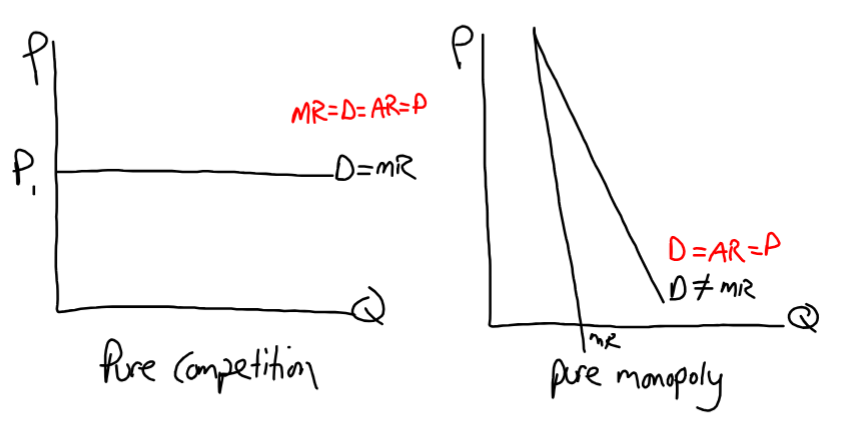
Pure Monopoly graph, Purely Competitive Firm graph. Show Demand curve and Marginal Revenue Curve.
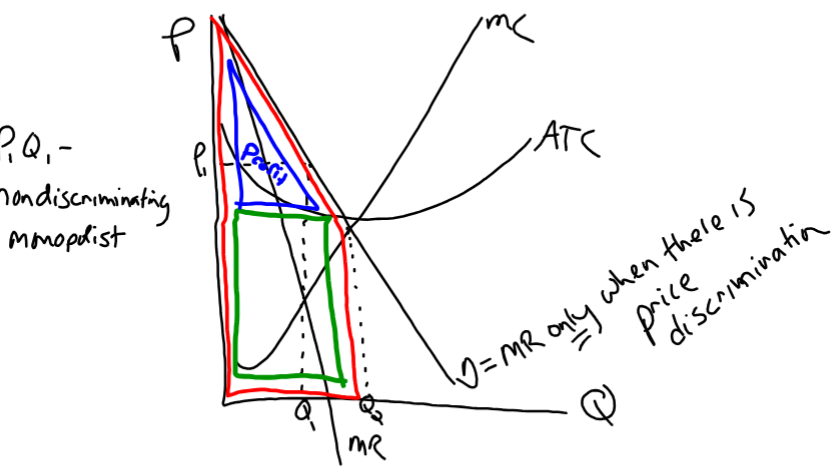
Draw a monopoly earning economic profit – label P1, Q1. If this monopoly is able to price discriminate illustrate how the graph changes – especially D and MR. Show Total Revenue, Total
Cost and Area of Profit.
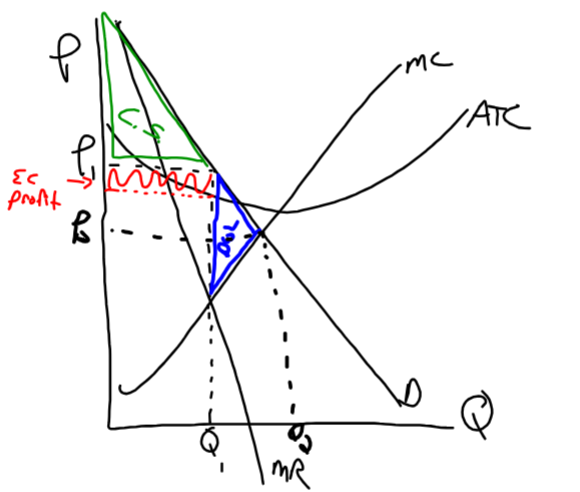
Draw a monopoly earning economic profit – label P1, Q1. Shade and label the area of economic
profit, consumer surplus and dead weight loss. If this monopoly were broken up and became a
purely competitive market/industry where would price and quantity be – label P2, Q2.
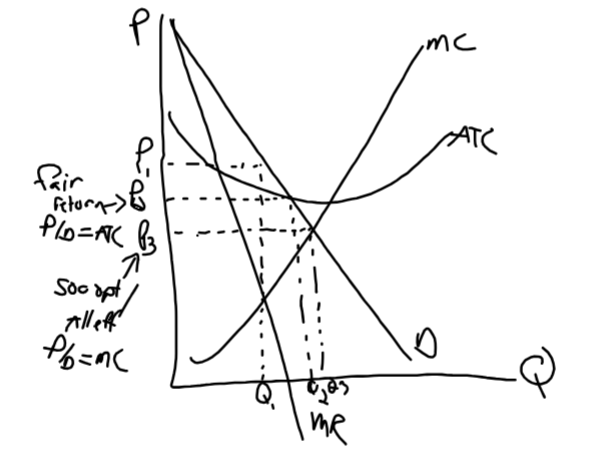
Unregulated Non-Discriminating Monopoly earning Economic Profit show Fair Return (p2 q2) and Socially Optimal (q3 p3)
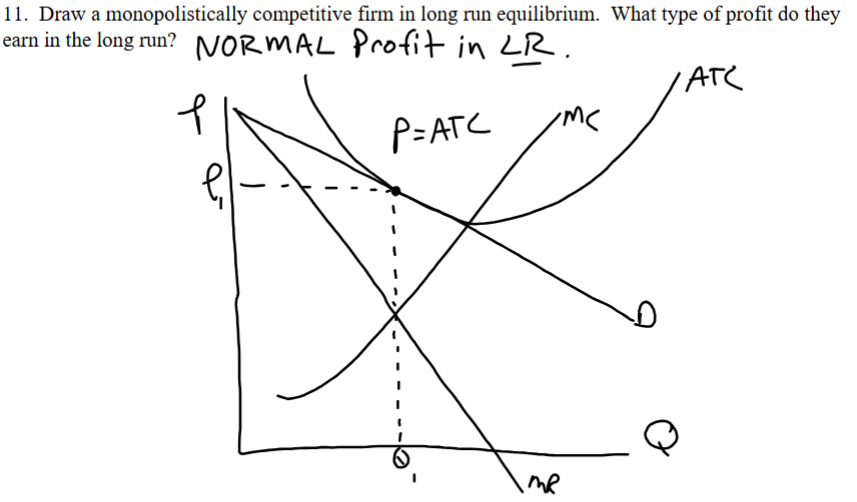
Monopolistically Competitive Firm graph What kind of profit in the long run?
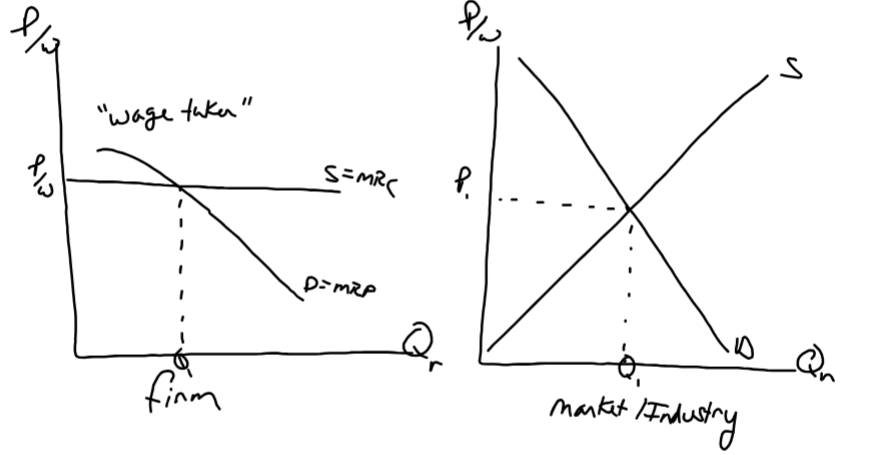
Perfectly Competitive Factor/Resource Market graph, Firm who hires resources in that market graph. Label the profit maximizing amount of resource to hire for the
firm.
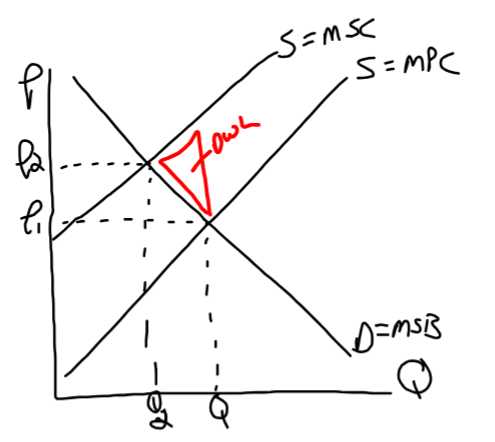
Draw a simple Supply and Demand P/Q graph for product X and label P1 and Q1. Now suppose the production of product X creates negative externalities. Show how the government
would correct for that negative externality and show the area of dead weight loss that would disappear after the government intervenes. Use the labels MSB, MPC and MSC on the
supply and demand curves.
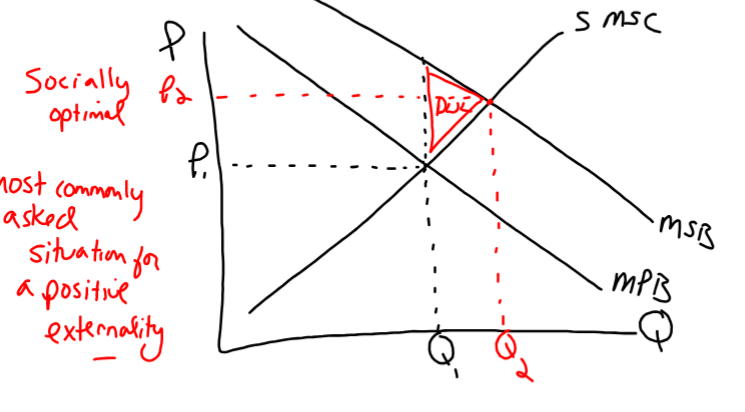
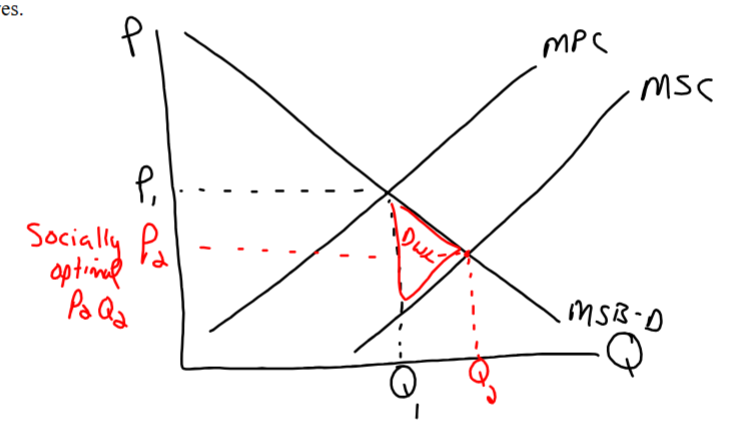
Draw a simple Supply and Demand P/Q graphs for product X and label P1 and Q1. Now suppose the production of product X creates positive externalities. Illustrate how the government would correct for that positive externality and illustrate the area of dead weight loss that would
disappear after the government intervenes. Use the labels MSB, MPC and MSC on the supply and
demand curves.
Draw a simple Supply and Demand P/Q graphs for product X and label P1 and Q1. Now suppose the consumption of product X creates positive externalities. Illustrate how the
government would correct for that positive externality and illustrate the area of dead weight loss that would disappear after the government intervenes. Use the labels MSB, MPB and MSC on the supply and demand curves.