info analytics ozaki final
1/90
There's no tags or description
Looks like no tags are added yet.
Name | Mastery | Learn | Test | Matching | Spaced |
|---|
No study sessions yet.
91 Terms
What does subgroup analysis examine in clinical research?
Examining treatment effects in specific subsets of a study population.
Why must results from subgroup analyses be interpreted with caution?
Multiple comparisons increase the risk of type I error.
What does a p-value for interaction tell you in a subgroup analysis?
Whether treatment effects differ between subgroups.
Do p-values for interaction measures the effectiveness of a treatment compared with the control group?
No. Effectiveness in each subgroup is measured by its own HR and CI; the interaction p-value asks if subgroup effects differ.
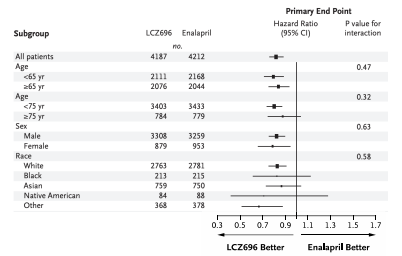
How do patients aged ≥75 years respond to LCZ696 compared with younger patients?
Show similar treatment effects based on hazard ratios and interaction p-values.

What do subgroup results show about differences in LCZ696 effects by race?
No differences; the interaction p-value is not significant.

Why are confidence intervals wider in the subgroup of Black patients taking LCZ696?
The sample size is small and causes imprecision.
What is the primary goal of conducting a noninferiority trial?
To show a new treatment is not unacceptably worse than a standard therapy.
What does a noninferiority trial NOT attempt to demonstrate?
Prove a drug is better.
What does the noninferiority margin represent within a trial design?
The maximum acceptable loss of efficacy.
How does selecting a wide noninferiority margin affect the trial?
Makes the trial easier to meet but less clinically meaningful.

Which confidence intervals (margin 1.20) support noninferiority in a trial?
HR 1.08 (1.02–1.18) and HR 0.96 (0.90–1.05).
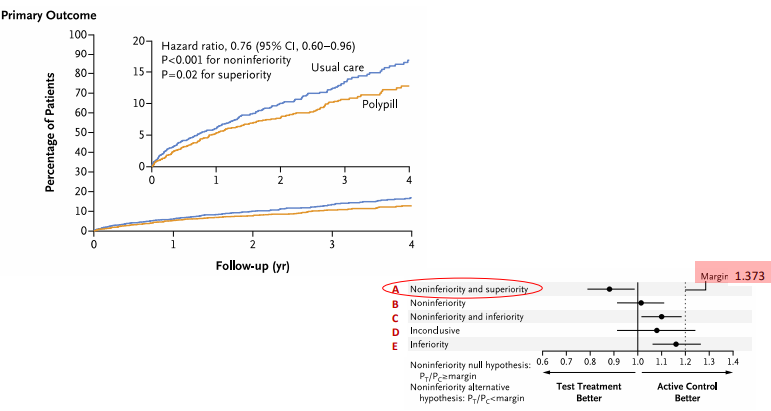
What did the polypill trial demonstrate when considering its CI and p-value results?
Both noninferiority (CI < margin) and superiority (CI < 1.0, p=0.02).
What is the primary purpose of using composite outcomes in a clinical study?
To combine endpoints and increase study efficiency.
Why can composite outcomes be misleading when minor components dominate the results?
They may exaggerate the perceived treatment benefit.
Why does variability in clinical importance among composite components create interpretation problems?
The results become misleading and harder to interpret.
How can composite outcomes obscure clinically meaningful results?
They can hide opposite effects among individual components.
What is incorrect about stating that factorial trials randomize patients to only two interventions?
The incorrect part is that factorial trials involve more than two interventions or factors. In a typical 2×2 factorial design, patients are randomized to all combinations of two independent interventions, creating four groups:
Intervention A + Intervention B
Intervention A + No B
No A + Intervention B
No A + No B
What does a factorial design create when assigning patients to multiple interventions?
Separate randomized groups for each treatment combination.
Do factorial trials always require larger sample sizes than standard trials?
A factorial trial does not always require a larger sample size than a standard two-arm trial. It depends on the goals of the study and how the sample size is calculated.
Can factorial trial designs incorporate non-drug interventions?
Yes, Factorial trials can include non-drug interventions, such as behavioral programs, lifestyle changes, or devices, alongside or instead of drugs.
Why does increasing the sample size alone fail to eliminate confounding?
Increasing the sample size reduces random error but does not remove confounding, because confounding is a systematic bias.
How does matching help control confounding during trial design?
By controlling confounding at the design stage.
How does randomization reduce confounding in clinical trials?
By balancing known and unknown confounders.
Can residual confounding still occur after statistical adjustment procedures?
Yes. Residual confounding can remain if confounders are unmeasured, mismeasured, or modeled incorrectly.
How does propensity score matching help in observational studies?
By reducing confounding through covariate balancing.
Which aspects of a study can misclassification affect?
The exposure, the outcome, or both.
Why is nondifferential outcome misclassification still a threat to validity?
It biases results and is not harmless.
What type of error decreases accuracy in a study measurement?
Systematic error.
What type of error decreases precision in a study measurement?
Random error.
Do Kaplan–Meier curves require every patient to have identical follow-up time?
No. Kaplan–Meier curves do not require identical follow-up times. They handle censored data, so patients can enter and leave the study at different times or be lost to follow-up.
Do survival curves serve only descriptive purposes in clinical trials?
No. Survival curves are descriptive and can also be used to compare groups statistically.
What information do Kaplan–Meier curves primarily display?
Event proportions over time and patterns of event occurrence.
Is PSM used in experimental studies?
No. Propensity score matching (PSM) is primarily used in observational studies to balance baseline characteristics between treatment groups. In experimental studies, randomization already controls for confounding, so PSM is generally unnecessary.
What does misclassification bias from coding errors affect?
It reduces internal validity. Misclassification bias happens when people are put in the wrong exposure or outcome group due to coding errors. It can make results seem weaker, stronger, or just wrong, leading to incorrect conclusions and misleading recommendations.
Does confounding by indication affect internal or external validity?
It reduces internal validity because the treatment is given for a reason related to the outcome, making it harder to determine the true effect of the intervention.
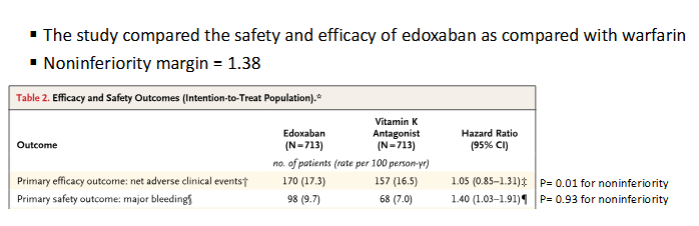
Is Edoxaban noninferior to warfarin for the efficacy outcome?
Edoxaban was noninferior to warfarin because the upper bound of the 95% CI (1.31) was below the noninferiority margin (1.38).

Is Edoxaban noninferior to warfarin for the efficacy outcome?
Edoxaban was not noninferior to warfarin because the upper bound of the 95% CI (1.91) exceeded the noninferiority margin (1.38). Edoxaban’s safety outcome would be considered inferior of the new drug compared to the standard because the entire CI > 1.0.