research final exam study guide!!!
1/105
There's no tags or description
Looks like no tags are added yet.
Name | Mastery | Learn | Test | Matching | Spaced | Call with Kai |
|---|
No analytics yet
Send a link to your students to track their progress
106 Terms
what is the concept of dualism as introduced by rene descartes?
Dualism, by René Descartes, is the idea that the mind and body are two separate substances:
The mind is non-physical and responsible for thinking and consciousness.
The body is physical and operates like a machine.
He believed they interact but are fundamentally different — this is called mind-body dualism.
the relationship between metaphysics and the physical worlds:
Descartes’ dualism connects metaphysics (mind) and physical science (body), trying to explain how the immaterial mind can influence the material body
how do we determine article credibility?
by ensuring:
peer reviewed:
journal editorial board and review process, its been evaluated and approved by experts before publication to ensure credibility!
journal quality:
reputation of the article measured by impact factor- which is measured by how often the article is cited and referenced by other researchers. influential and respected in the field!
author reputation:
credentials of the 1st primary author
funding source:
NIH, or other major private philanthropic orgs enhance credibility because they have rigorous review processes that are competitive and means it is ethical credible and high quality!
how do we create a research question?
identifying the problem vs research rationale!
identifying the problem: Start with something you’ve noticed or questioned in practice — what needs to be explored or solved? Comes from your curiosity, clinical experience, or observation
clinical experience:
challenges and experiences in clinic influence areas of curiosity and knowledge Your hands-on experience can spark curiosity—maybe a pattern, challenge, or success you’ve seen with patients that needs deeper understanding.
clinical theory
whats the theory at the source of the question? Ask: What existing theory or concept is behind your question? It helps guide the purpose and expected relationships.
professional literature:
Check if previous research has:
Gaps (what’s missing?)
Conflicts (do studies disagree?)
Limitations (was something not fully explored?)
research rationale: Why is this research important? What will it add to the field or improve in practice?
This is your justification
You’re checking the literature to see:
Is this already well-studied?
Are there gaps, contradictions, or limitations?
Is it worth studying for real-world impact?
review of literature:
Look for:
Systematic reviews or meta-analyses (high-level summaries of evidence)
Is your target population included in those studies?
theoretical framework:
What models or theories have previous studies used?
Are they relevant to your patient population or condition?
purpose
Define what your study will do — explain the aim clearly and tie it to your question and rationale.
what are the components of the PICO question?
P – Population/Patient/Problem
Who are you studying?🧠 Example: Adults with stroke
I – Intervention
What treatment, exposure, or approach are you looking at?🧠 Example: Balance training
C – Comparison (optional)
What is the intervention being compared to?🧠 Example: Standard physical therapy or no intervention
O – Outcome
What result are you measuring?🧠 Example: Improved walking speed or quality of life
inductive vs deductive reasoning:
Inductive reasoning:
Starts with specific observations and moves toward a general conclusion.
begins w experiences
Observing!
specific observations to general conclusions
Deductive reasoning:
acceptance of a general premise upon which inferences can be drawn to reach a specific conclusion.
testable hypothesis
general observation to specific conclusion
EBP: how do we know things as a profession?
Tradition-inherited knowledge and accepted precedent
“That's the way it’s always been done!”
Authority- statements or beliefs or influential leaders
“That’s what the experts say!”
Experience- trial and error in your own practice
“It’s worked for me before!”
* Experience, Authority, and Tradition
ALSO:
scientific evidence
deductive and inductive reasoning
experience- trial and error in own practice
authority- statements or beliefs or influential leaders
tradition- inherited knowledge and accepted precedent
what are the 3 components of EBP?
1. Best available research evidence
2. Patients values and preferences
3. Clinical expertise
what is the process of EBP decision making?
The 5 A’s! Ask, Acquire, Appraise, Apply, Assess
1. ASK a clinical question relevant to patient problem
a. background and foreground
2. ACQUIRE relevant literature guided by your question
3. APPRAISE the literature to determine if it meets standards & if findings are relevant
4. APPLY the evidence to your clinical situation
5. ASSESS the effectiveness of the evidence
Willowbrook Study:
Willowbrook Study 1956: Hepatitis Study at State School
At the Willowbrook State School researchers deliberately infected children with intellectual disabilities with hepatitis to study the disease.
Tuskegee Study:
Tuskegee Study 1932: US Public Health Syphilis Study
The U.S. Public Health Service studied untreated syphilis in Black men in Tuskegee, Alabama, without telling them they had the disease.
the nuremburg code:
why was it created? and what does it address?
1949
Why was it created?
Created after Nazi doctors were tried for horrific human experiments during WWII on lives deemed unworthy.
What does it address?
Emphasis on voluntary consent given by an adequately informed participant.
Researchers must be scientifically qualified!
what are the ethical principles of the Belmont Report?
Respect for persons:
Respecting personal autonomy and protecting those with diminished autonomy.
Beneficence:
Risk-benefit analysis, maximizing benefits and minimizing harm.
Justice:
Equitable distribution of benefits and burdens
what are the significant elements of informed consent?
Before the signature:
Researchers must ensure the participants understand what they're signing & can ask questions.
Free to Withdraw:
As volunteers, subjects are free to discontinue participation at any time without penalty and may request that their data is discarded.
Vulnerable Participants:
Consent without intimidation or coercion due to influence in populations. Special care with those who cannot consent for themselves, i.e. children & cognitively impaired.
define: fabrication, falsification, and plagiarism:
Fabrication:
Making up data or results and reporting on them
Falsification:
Manipulating data or processes, changing or omitting data or results- tweaking numbers slightly in favor of research, or getting rid of certain data.
Plagiarism:
Using another person's ideas, process, results, or words, without giving them credit.
independent vs dependent variables:
Independent:
Manipulated or controlled by the researcher
Presumed to explain or influence the dependent variable
“Variable that is changed”
Dependent:
Response variable
Outcome/variable affected by the change
Independent variable: What you change
Dependent variable: What you measure
what are the numerical variables?
and define each! give examples!
diff between ratio and interval
Continuous:
infinite number of values along a continuum, not limited to a whole number. I.e. weight: 25.5lbs, 25.487lbs or distance
Ratio variable: true zero!!!!
measured from an absolute zero
Has an absolute (true) zero meaning zero means none
Example: 0 height = no height at all. weight age force
Interval variable: no true zero!!!!!
rank order with equal intervals, zero does not indicate absence
Has no true zero; zero is just a point on the scale, not the absence of the thing.
Example: 0 degrees Celsius doesn’t mean no temperature, just a reference point (cold).
SAT scores
Discrete:
measured in separate units, cannot be measured in intervals less than 1= limited to a whole number. It means no decimals or fractions are used; values jump in full units.
I.e. how many children you have! number of visits or heart rate 84 bpm
ratio- equal intervals measured from true zero
interval- equal intervals, no true zero
what are the categorical variables?
and define them!
Nominal- categorical labels
Gender, blood type, label associated
Ordinal- rank order
MMT, pain scale
Nominal = Name only
Ordinal = Order matters
define reliability:
Predictable & reliable under steady conditions across researchers and pts.
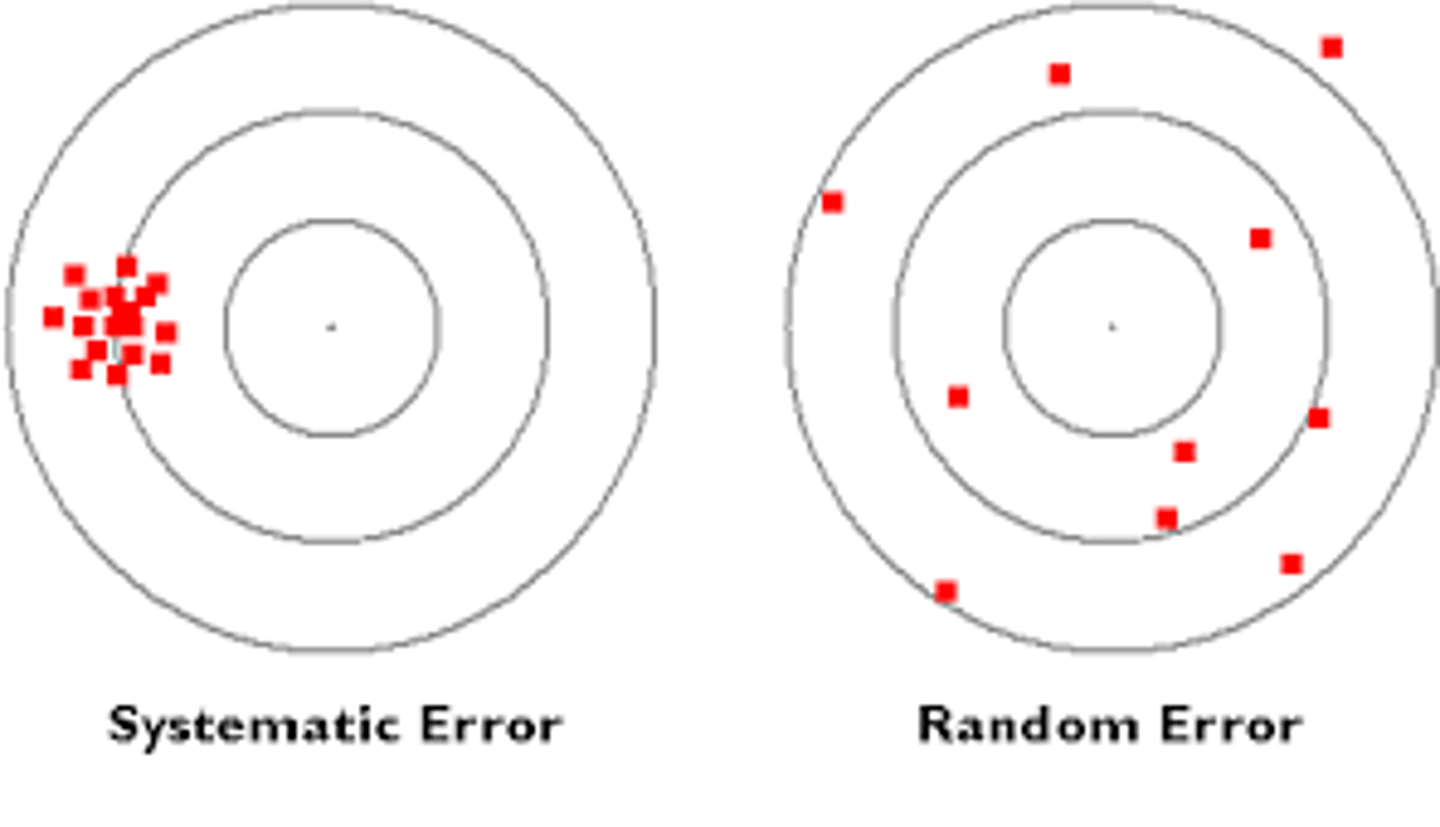
random vs systematic error:
Random error:
Happens by chance
Causes inconsistent results
Systematic error:
Causes biased results in the same direction
❌ Not fixed by repeating—needs correction of the source🔁
what are the sources of measurement error:
The Rater:
skill, not following protocol, inaccurate recording, distraction, bias
The Instrument:
Imprecise, affected by environmental changes, background noise
The Measured Characteristic:
Physiological response, Changes in performance, personal characteristics (motivation, fatigue, cooperation)
what is relative reliability?
Measures consistency of ranking between scores
Answers: Do people stay in the same order across tests?
🔧 Measured with Intraclass Correlation Coefficient ICC
0-1
1= completely reliable
0= no reliability completely random
When it says relative reliability is the proportion of total variance in a set, it means:
👉 It looks at how much of the total variation in scores is due to true differences between people, not measurement error.
Relative reliability = how much of the total variance is due to real differences between people (consistency in ranking)
what is absolute reliability?
Measures the amount of measurement error
how much measurement error there is
expressed in original units, how much of the measured value is likely due to error
Answers: How close are the actual scores to each other?
✅ Example: If someone scores 90 and 91, the difference is small = good absolute reliability
🔧 Measured with standard error of measurement (SEM)
Absolute reliability = how much variance is caused by measurement error (how much scores wiggle because of mistakes)
what is test retest reliability?
Determines if the instrument measures performance consistently
- intervals
- carryover
- testing effects
Checks if a measurement tool gives consistent results over time
Same test, same person, different time
✅ High test-retest reliability = stable and repeatable results
🧠 It tells you: “If nothing changes, will I get the same score again?”
Test-retest reliability is mainly about the instrument or tool and how consistently it measures over time.
what is rater reliability?
intra vs inter:
Inter-rater reliability: ✅ Consistency between different raters
variance between two or more raters testing the same subjects
Intra-rater reliability: ✅ Consistency of the same rater over time
stability of data from a single rater across trials
what are the ways we can improve/maximize reliability?
- Standardize measurement protocols
- Train Raters
- Calibrate and improve instruments
- Take multiple measurements
what is norm referencing?
Compare and rank an individual within a given population- percentile ranks
Norm referencing is when a person’s test score is compared to others’ scores, not a fixed standard.
🧠 Think: “Compared to the norm”
what is criterion referencing?
A fixed standard that represents an acceptable level of performance
Criterion referencing means comparing a test score to a fixed standard or specific goal, not to other people’s scores.
🧠 Think: “Meet the criteria”
what is minimal detectable change MDC?
The amount of change that must occur to be confident that it is actual change and not attributable to error.
Confident in saying that what we are seeing is actual change, not within error amount.
Based on standard measurement of error SEM
Smallest change that shows a real difference, not just measurement error
what is minimal clinically important difference MCID?
The smallest difference that signifies an important rather than trivial difference in measurement.
Smallest change that is meaningful to the patient
Focuses on clinical importance
✅ Answers: “Does this change matter to the patient?”
descriptive statistics:
what is distribution vs distribution frequency?
distribution:
total set of scores for a particular variable
Shows the overall pattern of the scores: "Scores ranged from 6–10, most were around 8."
Frequency Distribution:
A table of ranked order scores that shows how many times the value occurred
Shows how often each score occurred:
6 → 2 times
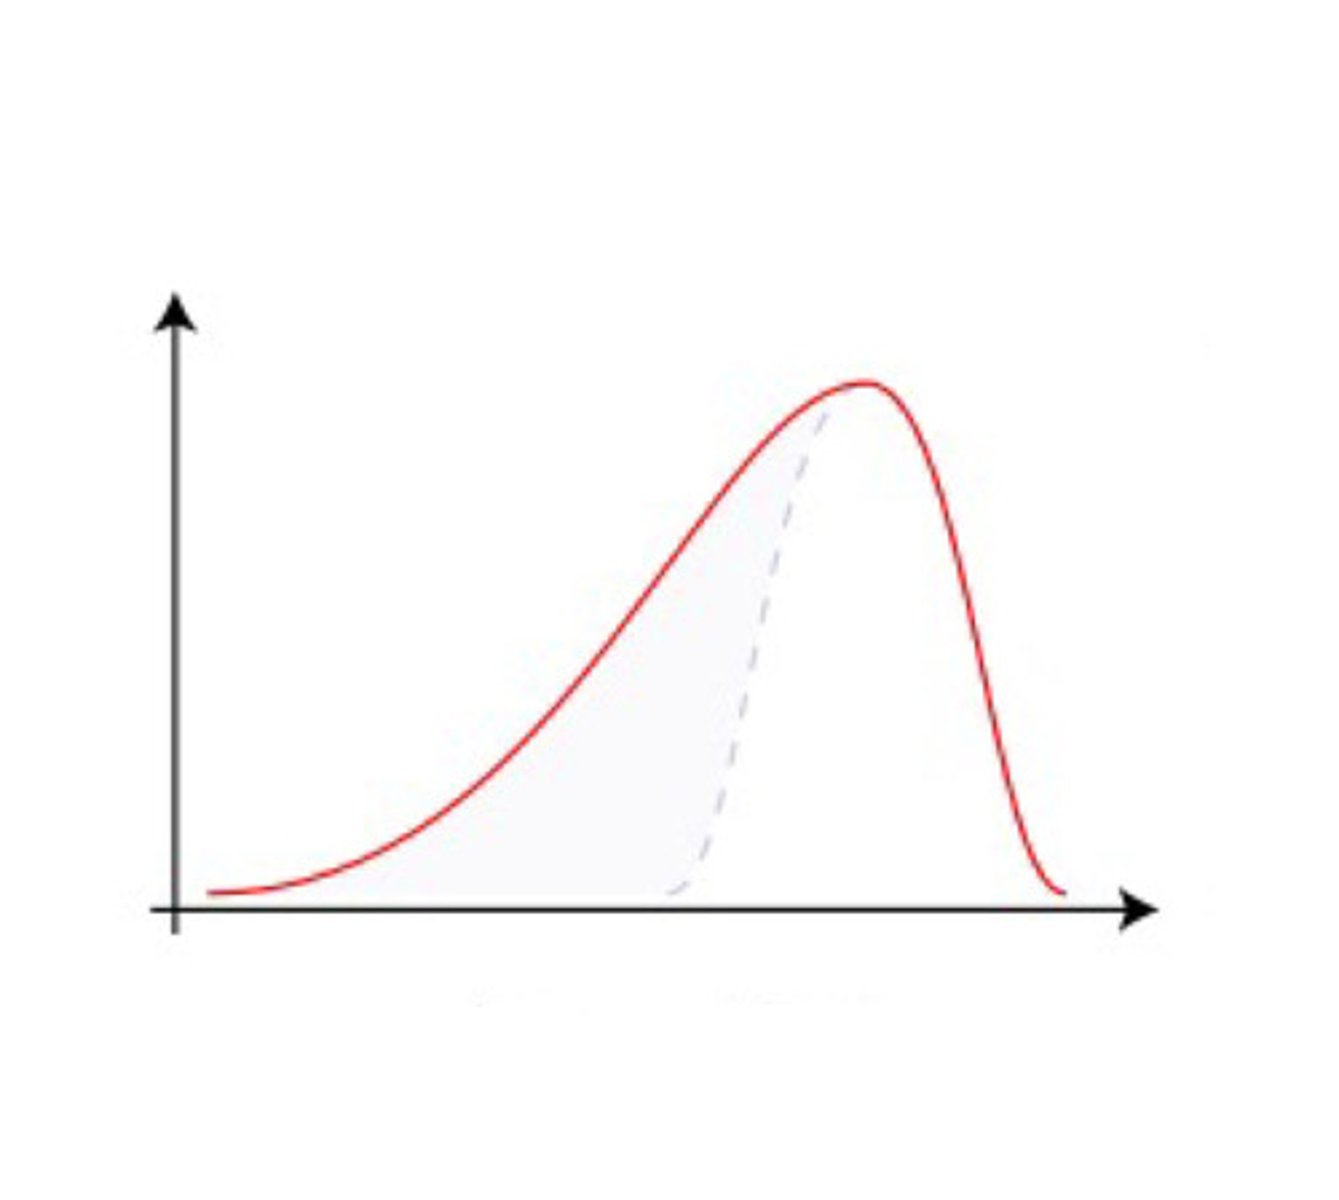
name the skew:
negative skew
L tail = negative skew
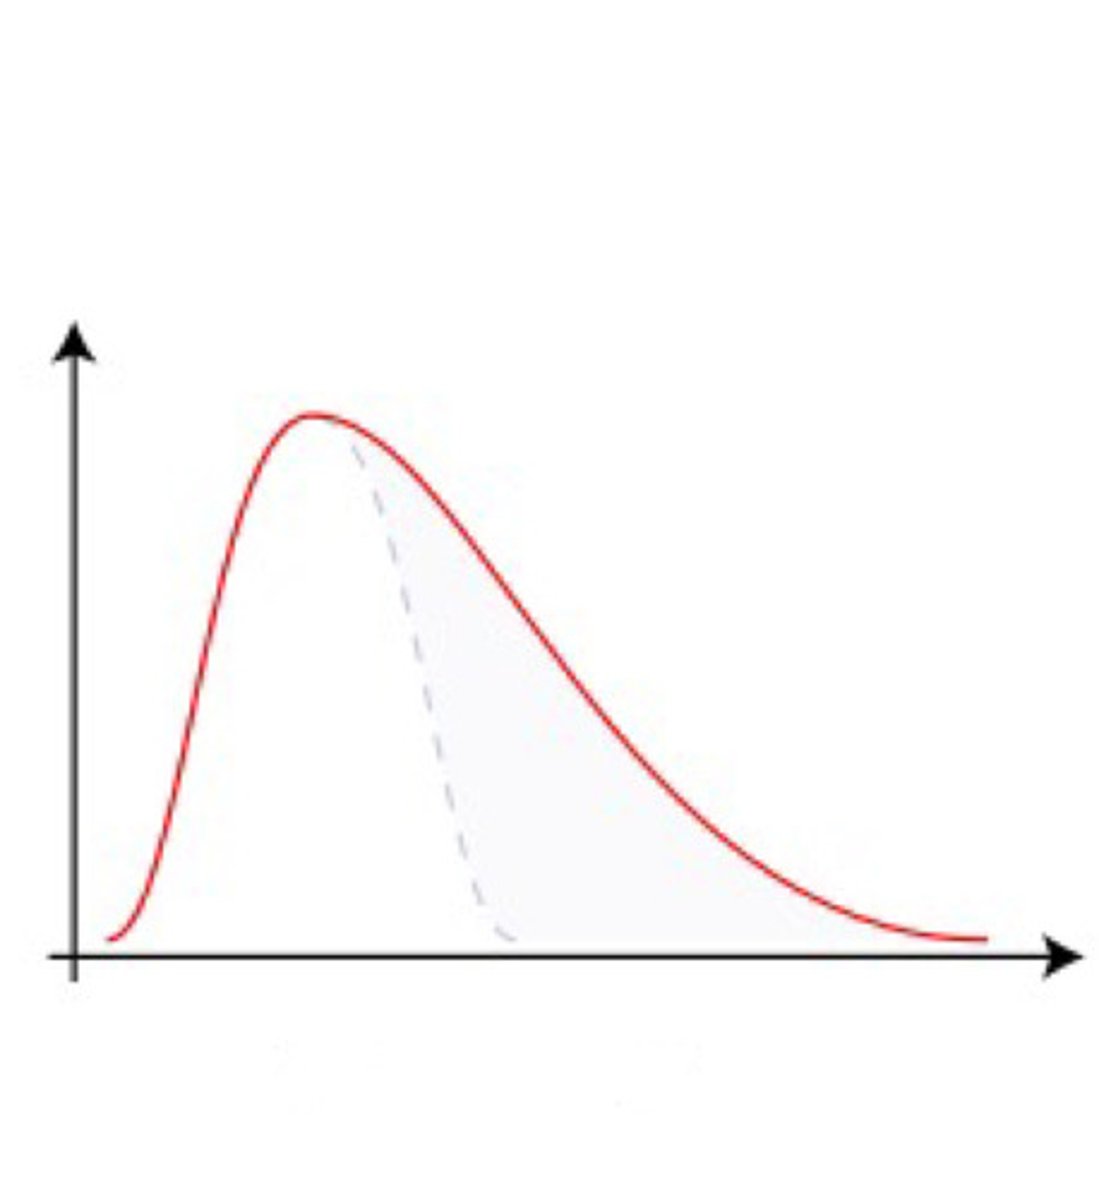
name the skew:
positive skew
R tail = positive skew
measures of central tendency: what is it?
what is mean, median, and mode?
Mean: the “average”
Median: the middle number when scores are in rank-order
Mode: the score that occurs most frequently in a distribution
Central tendency = a way to describe the center or typical value of a data set.
👉 Includes: mean, median, mode. It's how we summarize what’s “normal” or “average” in the data.
what is standard deviation? and how is it interpreted?
- Represents variability or dispersion of scores around the mean
- Smaller standard deviation means the scores are less spread out from the mean
Standard deviation = how much the data spreads out from the mean.
Low SD → scores are close to the mean
High SD → scores are spread out wide
what is inferential statistics?
Inferential statistics are concerned with testing hypotheses and using sample data to make generalizations concerning populations.
statistical inference:
probability vs sampling error
Probability:
the likelihood that an event will occur, given all possible events
Sampling error:
the difference between values observed in the sample and in the population
What we observe vs what is actually true of the population
Probability = chance that a result happens by random chance
Sampling error = the difference between a sample’s result and the true population value because the sample isn’t perfect
inferential stats:
what is confidence interval? how is it interpreted?
A range that should contain the population mean
It’s a range of values calculated from your sample data
You’re “confident” (usually 95% confident) that the true population mean lies somewhere within this range
It accounts for sampling error and variability
For example, a 95% CI means: "We are 95% confident the true value is between X and Y"
A narrow CI means more precise estimate
A wide CI means less precision, more uncertainty
expressed as 95% or 99% 95% of the time the CI would contain the true population mean
what is alternative hypothesis vs null hypothesis?
Null hypothesis (H₀) =
a statement that there is no effect or no difference no relationship between variables.
Alternative hypothesis (H₁) =
a statement that there is an effect or a difference between groups or variables.
Hypothesis stating the expected relationship between independent and dependent variables
alternative hypotheses:
directional vs non-directional:
Non-directional Hypothesis:
does not specify which mean is expected to be higher (uses a two-tailed test)
Directional Hypothesis:
indicating an expected direction in the difference between means (use a one-tailed test)
Directional hypothesis: predicts the specific direction of the effect
Example: "Dance therapy improves quality of life" (expecting increase)
Nondirectional hypothesis: predicts a difference, but no specific direction
Example: "Dance therapy affects quality of life" (could improve or worsen)
what is a type I error?
- include descriptions of alpha level and p value
Type I Error: rejecting the null when it was true
You think your alternative hypothesis is true (reject null), but it actually isn’t true
🔹 Alpha level (α)
You set this before the study (commonly 0.05)
It’s the maximum risk you’re willing to take of making a Type I error (rejecting a true null)
🔹 P-value
You get this from your data
It tells you the actual probability that your results happened by chance if the null is true probability that the observed difference occurred due to chance
If p ≤ α → Statistically significant → Reject the null
If p > α → Not significant → Fail to reject the null
👉 Alpha = your cutoff
👉 P-value = your result
👉 You check: “Did the result beat the cutoff?”
what is a type II error?
include descriptions of beta and power:
Type II Error:
Failing to reject the null when it is incorrect
You think your alternative hypothesis is not true (fail to reject null), but it actually is true
Power= 1-B
Power is probability that a test will lead to rejection of the null Power = detects true differences
β = 0.20 → 20% chance of missing the truth reasonable to protect against type 2 error
Power = 0.80 → 80% chance of catching the truth if it’s there
Beta = the risk of missing true differences
Type II error is the mistake
β is how likely that mistake is
Power is how good your test is at avoiding that mistake
If it has high power (usually ≥ 0.80), you're more likely to find real differences
Power (1−β) helps you design your study well enough so that if a true effect exists, you’ll be able to find it
what is effect size? and how is it interpreted?
The degree to which the null hypothesis is false
the magnitude of the difference between groups
The null hypothesis says: "There is no effect or no difference."
Effect size measures how much your data deviates from this “no effect” idea.
A larger effect size means the null hypothesis is more strongly false — there is a bigger difference or stronger relationship.
A small effect size means the null is only slightly false — differences or effects are minor.
A big effect size means the difference or relationship you found is strong and meaningful.
It suggests the null hypothesis is more clearly false — your intervention or variable really made an impact.
Measures how big or meaningful the difference or relationship is in your data
Cohen’s d (difference between two means)
0.20 = small effect size
0.50 = medium effect size
0.80 = large effect size
what is parametric vs non-parametric?
Parametric: Used to estimate population parameters
Must meet certain assumptions to be valid!
Random sampling
Interval or ratio (cont. data)
Normal distribution
Equality of variance (homogeneity)
Nonparametric: less powerful analogs "less powerful version"
Valid alternative when assumptions are not met
Use parametric tests when your data meets assumptions (normality, equal variance). Use nonparametric tests when it doesn’t or when data is ordinal/ranked.
comparing means:
paired t-test:
compares means from the same group at 2 times (pre and post)
Used when subjects serve as their own control
Compares differences in scores for each pair so the subject is only compared with themself
Reported as t statistic:
t [df] = t statistic, p=p value, CI95 [lower, upper]
Compares means within the same group at two different times
wilcoxon test
Example: Compare balance scores before and after dance therapy in the same patients
comparing means:
independent t-test
compares means between 2 different groups
Each group consists of a different set of subjects
Reports as same t statistic as above^
assumptions include equality of variance (levenes test)
Mann whitney U
Independent t-test
Compares means between two different groups
Example: Compare balance scores between Group A (dance therapy) and Group B (no therapy)
define when you would use ANOVA?
define:
one way ANOVA
two way ANOVA
ANOVA: comparing more than two means, 3 or more treatment groups or conditions, between groups and within groups
based on F statistic
parametric requires assumptions to be met
non parametric- kruskal wallis test
One-Way ANOVA:
one independent variable with 3 or more levels (factors)
You want to see if three different exercise programs (A, B, and C) lead to different average improvements in patients’ strength.
Two-Way ANOVA:
two or more independent variables (factors)
You want to see the effect of exercise program type (A, B) and gender (male, female) on patients’ strength improvement.
ANOVA:
repeated measures ANOVA
mixed design ANOVA
Repeated Measures ANOVA:
within subjects design, use with same subject under multiple conditions
You want to test if patients’ pain levels change across three time points: before treatment, after 2 weeks, and after 4 weeks.
Mixed Design ANOVA:
Combines both between-subjects and within-subjects factors in one study
Tests effects of different groups (between-subjects) and repeated measures (within-subjects) simultaneously
Study looks at the effect of two different diets (Diet A vs. Diet B — between-subjects) on weight loss over 3 months (measured monthly — within-subjects).
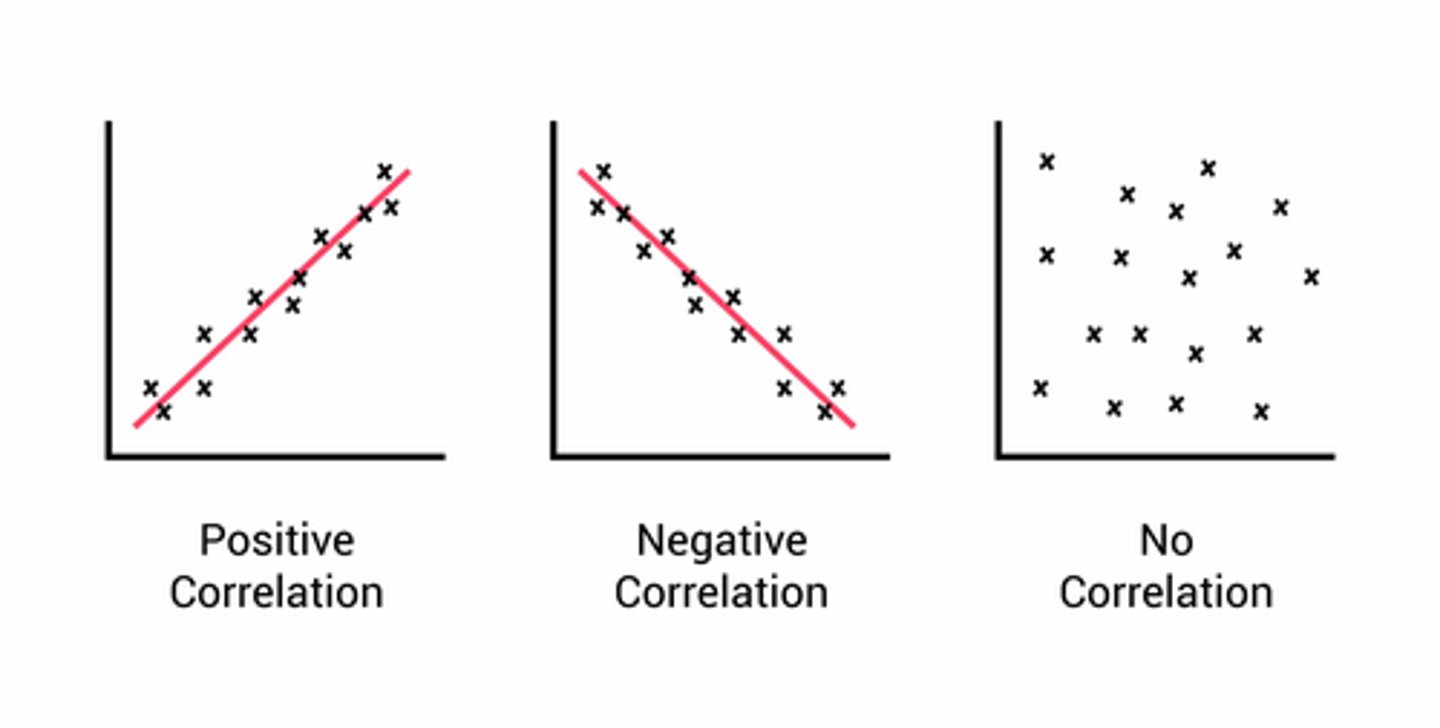
what is a correlation? how is it measured?
Correlation: The degree of association between 2 variables!
a statistical technique used to measure and describe the relationship between two variables
Correlation Coefficient (r): expresses a degree of relationship
Measures the strength and direction of a linear relationship between two variables
Values range from -1 to +1
+1 = perfect positive correlation (both go up together)
-1 = perfect negative correlation (one goes up, other goes down)
0 = no correlation
the extent to which x and y are "co-related"
THE CLOSER THE VALUE IS TO PLUS OR MINUS 1, THE STRONGER THE RELATIONSHIP
what does it mean for two factors to be correlated?
They change together in some way — as one goes up or down, the other tends to go up or down too
The strength and direction of their relationship is measured by the correlation coefficient (r)
Correlation does not mean causation — just that there’s a relationship, not that one causes the other
draw a positive and negative scatter plot
correlations:
nonparametric vs parametric
If your data is normal & continuous → use Pearson (parametric)
If your data is non-normal or ordinal → use Spearman or Kendall (nonparametric)
Parametric Statistic:
Continuous variables
Normal distributions
Nonparametric options:
Spearman rank correlation coefficient
Kendall’s Tau-b
what is a regression? how is it measured?
A statistical method used to predict the value of one variable (dependent) based on one or more other variables (independent)
Coefficient of Determination (R²): proportion of variance shared by two variables
Tells you how much of the variation in the dependent variable Y can be explained by the independent variable X
Ranges from 0 to 1 (or 0% to 100%)
Higher R² = better prediction
Tells us how much of a variance in the dependent variable Y can be explained by the independent variable of X.
regression:
simple vs multiple regression:
- what is MR used for?
Simple Regression
A statistical method that uses one independent variable (X) to predict one dependent variable (Y).
Predicting a person’s test score (Y) based on the number of study hours (X).
Multiple Regression: multiple IVs, 1 DV
A statistical method that uses two or more independent variables (X₁, X₂, X₃...) to predict one dependent variable (Y).
Predicting blood pressure (Y) based on:
age (X₁)
weight (X₂)
exercise level (X₃)
MR is used for applied prediction, decision making, theoretical explanation.
why are regressions used?
ESTIMATION AND PREDICTION!
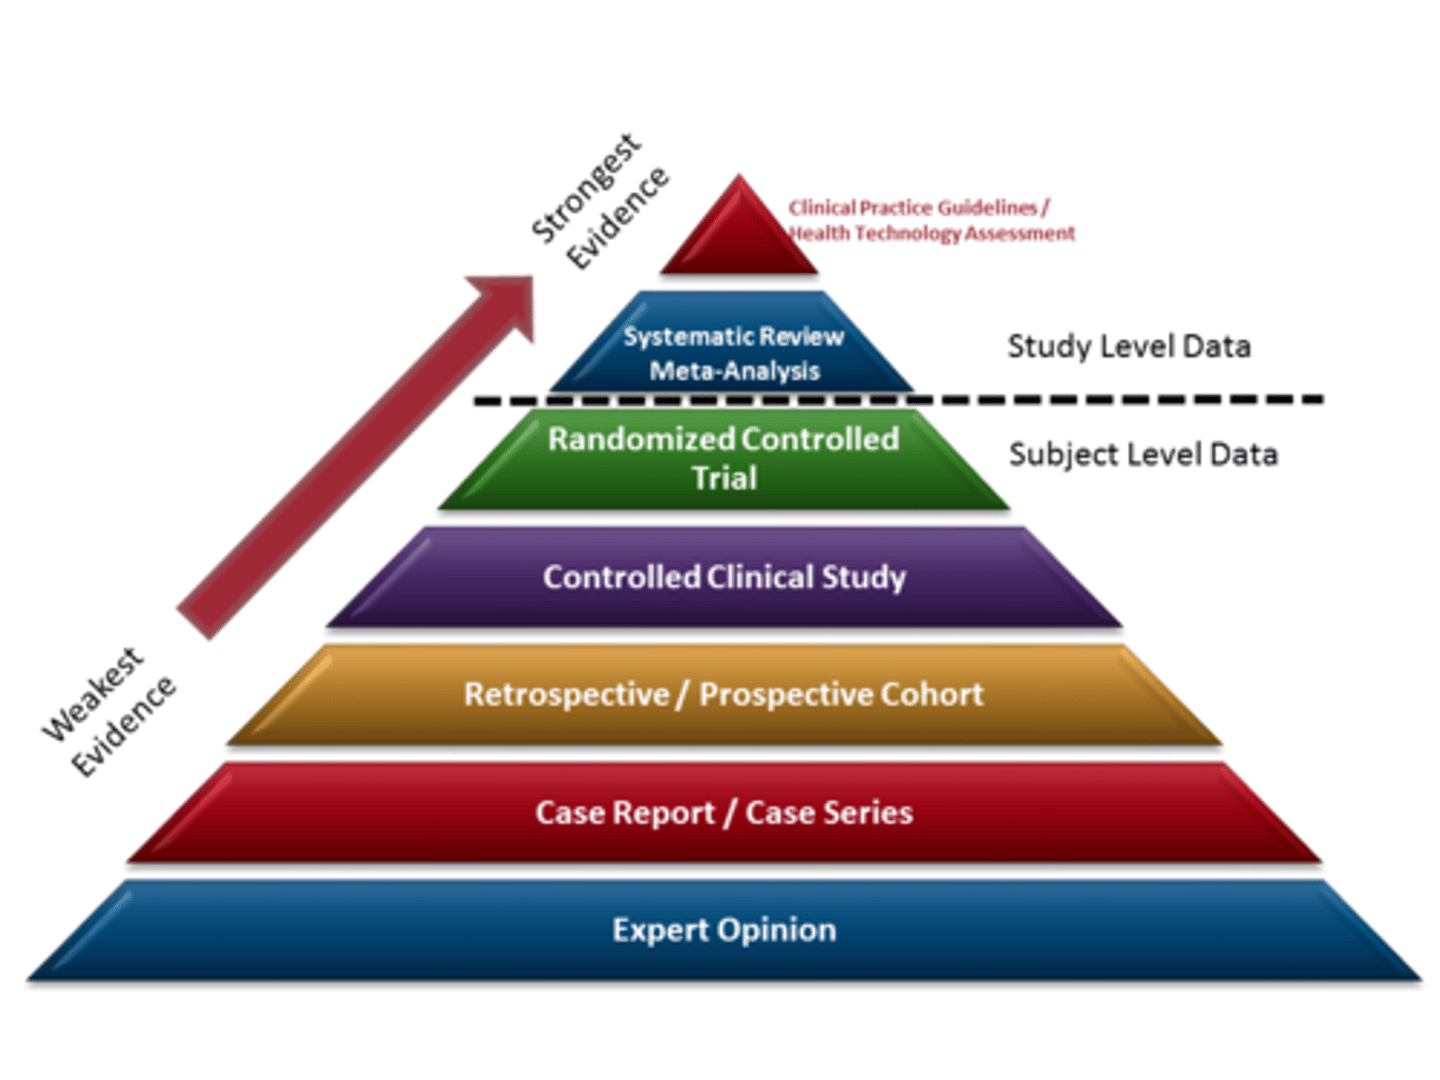
write out the research designs levels of evidence:
strongest: clinical practice guidelines and health tech assessment
systematic review and meta analyses
randomized controlled trials
controlled clinical study
retrospective and prospective cohort
case report/case series
weakest: expert opinion
research design:
inclusion vs exclusion criteria:
Inclusion Criteria:
primary traits of a target population “who we want!”
May include factors such as:
Demographic
Clinical presentation
Geographic location
Exclusion Criteria:
factors that preclude participation- don't want anything that confounds findings!
May include potentially confounding factors such as:
Comorbidities
Contraindications to intervention
Inability to follow study instructions
elements of a "true experiment" / requirements of an RCT!
1. Manipulation of IV’s
Researcher imposes specific experimental conditions
2. Random Assignment
Each subject has an equal opportunity of being placed in any group
3. Use of a control group
active vs inactive control groups:
Inactive Controls:
does not receive a comparison treatment
Placebo: treatment w/o an active component
Sham: essentially a placebo for a physical intervention i.e. providing ultrasound w/o turning on the machine
Active Controls:
conventional or standard care is provided
Can compare against a new treatment approach
Still receives some sort of treatment
blinding:
- single-blind, double-blind, triple-blind:
Single-blind: Participant doesn’t know
Double-blind: Participant and researcher don’t know
Triple-blind: Participant, researcher, and analyst don’t know
Each level helps reduce bias more!
experimental design:
pretest-posttest design
Basic RCT with 1 IV
A pre-posttest control group design is a true experimental design where:
There are two or more groups (usually an experimental group and a control group).
Both groups are tested before the intervention (pre-test)
One group gets the treatment, the other does not (or gets placebo/standard care)
Both groups are tested again afterward (post-test)
Strong internal validity & strengthens evidence that effects of the treatment account for the group differences in posttest scores!
independent t test for 2 groups one way anova for 3 or more groups
mann whitney U 2 groups
kruskal wallis 2 or more groups
experimental design:
posttest only design
- why would we choose this?
There are two or more groups (experimental and control)
Only a post-test is given — no pre-test
One group gets the treatment, the other does not
Then you compare outcomes after the intervention
Identical to pretest-posttest design EXCEPT no pretest for either group!
Why a posttest only?
- If pretest is impractical or potentially reactive
- Decreases bias if prettiest could influence posttest scores
- Increases external validity
- Best done w large sample size to balance out interpersonal characteristics
experimental design:
factorial design
A factorial design is a research setup that studies two or more independent variables (factors) at the same time to see:
Individual effects of each factor (main effects)
Combined effects (interactions) between the factors
Used to account for the interaction of several variables
2 or more IVs
3×3 Factorial Design
2 independent variables
Each has 3 levels
Example:
Factor A: Exercise (yoga, strength, swimming)
Factor B: Diet (low, medium, high protein)
→ 9 total groups (3×3)
analyzed with ANOVA 2 way and 3 way most common
what is a randomized block design?
A research design where participants are grouped (blocked) by a characteristic (like age, gender, severity), and then randomly assigned to treatment groups within each block
experimental design:
repeated measures
ONE GROUP is tested UNDER ALL CONDITIONS
Subject serves as their own control
Advantage: control for individual differences
what is a carryover effect?
A carryover effect occurs when the effect of a previous treatment “carries over” into the next treatment period — and influences the results of later conditions
experimental design:
crossover/carryover design
Two levels of IVs are repeated
● Control for order effects- counterbalancing the treatment conditions
Means you change the order for different participants to cancel out order effects.
● Half receive intervention A followed by intervention B, the other half receives intervention B followed by intervention A.
● Should only be used if the patient’s condition/disease will not change
much over time
● When the treatment has cumulative effects, a washout period is needed
You’re testing 2 pain meds (A and B) on the same group of patients:
Group 1: Gets drug A → then drug B
Group 2: Gets drug B → then drug A
paired t test or wilcoxon
what is a quasi-experimental design?
Similar structure to experimental but lack:
● Random assignment
● Comparison groups
● Both
Used when randomization and/or control groups are not possible or unethical
Threats to internal validity
quasi-experimental:
interrupted time series
An interrupted time series design is a quasi-experimental study where:
series of measurements that are interrupted by one or more treatment occasions
You measure the same group repeatedly over time, then "interrupt" that timeline with an intervention, and keep measuring to see if there's a noticeable change in the trend.
Strengthens causal inference if trends clearly change after the intervention
It splits time into “before” and “after” segments. Pre and Post!
Benefit is to show trends over extended periods
IV is time!
Series of measurements that are interrupted by one or more treatment occasions
One group studied
Most effective at evenly distributed intervals
quasi-experimental:
non-equivalent groups design
It’s a type of quasi-experimental design where:
You have two or more groups (like experimental and control)
But the groups are not randomly assigned
You still compare pre-test and post-test scores between them
🧪 Example:
You compare math scores between:
One class that received a new teaching method
Another class that used the traditional methodBut students were already assigned to their classes — you didn’t randomly place them. ➡ ️ The groups are non-equivalent
Similar to a pretest-posttest design except subjects are not randomly assigned
subjects can self select!
Limitation and potential bias due to lack of random assignment
what is a single subject design?
A single-subject design (SSD) is a type of research where one person (or a very small group) is studied intensively over time, and acts as their own control.
improve decision making in clinical setting
no one size fits all, allows for individualized care because RCTs may not be adequate since they generalize to all people
single subject design:
whats the design follow?
baseline intervention phases!
A = Baseline (no treatment) control condition!!!!!
B = Intervention
A-B design!
Measuring the response of the target behavior at frequent and regular intervals
2 testing periods: A-B Design
SSD:
N of 1 Trials (crossover)
One person, randomly switches between treatments (like A-B-A or B-A-B)
Used as an active decision making tool
● Which treatment should I use for this patient?
● Most commonly used to determine individual effectiveness of drugs
Crossover design:
Treatment and placebo are altered until the pt and clinician reach a decision on preference for one.
✅ N-of-1 Trial
A study done on just one participant
That one person tries multiple treatments over time
Outcomes are measured during each phase to see which treatment works best for them
🔁 How Crossover Design Fits In:
N-of-1 trials use a crossover design: The same person gets Treatment A, then Treatment B, then maybe back to A
There are “washout” periods in between to clear the effects of the previous treatment
The person is their own control
Great for personalized medicine
Helps find the best treatment for an individual, not just what works on average
what is descriptive designs?
Observational approach
Seeking to document:
● Traits
● Behaviors
● Conditions
case report vs case series vs case study!
Case report:
Detailed description of individuals condition or response to treatment (can also focus on a group)
Helpful for clinical theories, or new approaches to diagnoses
Can provide novel research questions and hypotheses
Can emphasize unusual problems or outcomes
Case series:
Expansion of a case report involving observations in similar cases
Case study:
NOT a case report
Qualitative research method investigating broad questions related to individuals or systems
Deep dive into one case (person, event, organization, etc.) ✅ Use to understand context and all factors around a single unit in detail
what is observational research?
what types?
cohort, case control, longitudinal, cross sectional
Comparing groups without assigning exposure
Researchers observe without manipulating variables ✅ Use when you can’t ethically or practically assign treatment
observational research:
longitudinal studies
Following subjects across time and collecting data at intervals
Prospective - direct recording or measurements
Retrospective - examining previously collected data
Prospective = watch it happen
Retrospective = look back at what happened
Longitudinal = over time, either way
observational research:
cross-sectional studies
taking a population "snapshot" at a single point in time
collects data about exposure and outcome at the same time
more efficient than longitudinal studies
- risk of reverse causation
observational research:
cohort studies
Prospective or retrospective!
Follow a group with shared exposure (e.g., smokers) over time to see outcomes
subject selection is free from target outcome at baseline
susceptible to outcome
challenges- classifying exposure and attrition
Cohort Study = follows groups based on exposure to see who gets the outcome
Prospective cohort: Starts now, follows participants forward in time to see if they develop the outcome.
Retrospective cohort: Looks back at existing records to see who was exposed and who developed the outcome
.
Key: Both look at exposure first, then outcome — but differ in when data is collected (future vs past).
observational research:
case control studies
Compare people with a condition (cases) to those without (controls)
determining if groups differ in terms of exposure history or presence of risk factors by looking backwards
Look backward to identify prior exposures
✅ Use when condition is rare or time/resource-limited
➡️ Retrospective (looking back)
challenges- selection, observation, and recall bias and confounding factors
match controls to minimize bias
You start with the outcome
(cases = have the condition, controls = don’t)
Then you look back in time to compare past exposures or risk factors
Case-control = outcome first, then search for cause (retrospective by design)
what is the value of qualitative research?
Qualitative research methods provide researchers with the ability to:
Explore complex human beliefs
Attitudes
And behaviors
That can generate a deeper understanding of the impairments, functional limitations, and disability of our patients as well as therapeutic interactions
qualitative research:
grounded theory
Builds a theory from the data (theory is "grounded" in participants' words)
seeks to form or discover a theory
theory development that explores the how and the why of the phenomenon through systematic processes
qualitative research:
phenomenology
Explores the lived experience of people
seeks to describe common meaning of individuals of a lived experience of a concept/phenomenon
✅ Use when studying what it's like to go through something (e.g., living with pain, grief, illness)
explore the meaning of something from the vantage point of those who have experienced it
qualitative research:
case study
Deep dive into one case (person, event, organization, etc.)
✅ Use to understand context and all factors around a single unit in detail
study of a real life "bounded system"
- individual, group, or organization
The case being studied is clearly defined in terms of time, place, people, or context — it has boundaries.
detailed in depth data collection across multiple sources that provides case descriptions and themes
comprehensive descriptions of a single patient or organization. Have specific design and analysis
qualitative research:
ethnography
Studies cultures or social groups in their natural environment
focused on "culture sharing group"
- immersion in day to day lives
✅ Use when you want to immerse yourself to understand beliefs, behaviors, and norms
examining social units or cultures through direct presence and observation in the natural setting
qualitative research:
generic
A flexible, non-specific approach that doesn’t fully fit the other types
✅ Use when you just want to describe and interpret experiences without forming theory or doing deep cultural or philosophical analysis
standard interpretive research
qualitative research:
methods of data collection
Qualitative methods of data collection:
Participant observation
Interviews!!!
- Structured
- Semi-structured
- Unstructured
Focus groups
Written documents
qualitative data analysis:
coding types
structural, descriptive, in-vivo, process coding
Coding: a word or phrase that summarizes or captures the essence of a portion of data
TYPES:
Structural: conceptual phrase "Health beliefs"
Descriptive: basic labels "Fear," "family," "transportation"
In-Vivo: using the participants own language "I felt invisible"
Process coding: using gerunds (words ending in -ing) "Coping," "struggling," "seeking help"
searching literature:
truncations
An * asterisk is commonly used as a truncation symbol
Allows for any ending
Provides multiple variations
Not all databases use this
A search technique that uses a symbol (like *) to find all word endings or variations of a root word
Helps get more results in database searches
Searching for child* will find: child, children, childhood, childish, etc.
searching literature:
combining terms using boolean operators
Words that help combine or exclude keywords in database searches to narrow or broaden results.
Common operators:
AND → Narrows search (must include ALL terms)
OR → Broadens search (includes ANY of the terms)
NOT → Eliminates articles that contain the 2ND term NARROWS search
Diabetes AND exercise → finds articles with both words
Diabetes OR obesity → finds articles with either word
Diabetes NOT type 1 → finds articles about diabetes but excludes type 1
searching literature:
MeSH terms
MeSH Terms (Medical Subject Headings)
A controlled vocabulary used in databases like PubMed
Standardized terms that describe the content of articles
Help you find all articles on a topic, even if different words are used
Find content with different terminology for the same concept!!!
evidence for validity:
construct, content, and criterion related
validity: measuring what we say it will measure!
content validity:
make sure its getting all points to support the findings i.e. studying depression just doesn't study fatigue but also mood changes, motivation, fatigue, anger, etc.
criterion related validity:
what we are measuring vs the gold standard
construct validity:
It tells you how well a test or tool measures what it’s supposed to measure — the "construct" or concept.
creating a search strategy:
1. identify terms based on your research question
2. set your limits and exclusions
3. create a term combinations
4. determine appropriate database to search
* run a preliminary search
* adjust terms and limits as needed
components of descriptive stats:
what is Q3-Q1? and what is Q2?
what is variability?
- range
- percentiles
- quartiles
shape (distribution shape, normal or skewed bell curves)
central tendency (mean median mode)
variability shows the differences when the other two factors don't provide a clear picture!
- range: differences between highest and lowest values in distribution
- percentiles: scores position in distribution relative to all other scores
- quartiles: breaks distribution into 4 equal parts
Q2 is median 50%
each quarter is 25% of distribution
Q3-Q1 is interquartile range
-standard deviation represents variability or dispersion of scores around the mean
* smaller SD means the scores are less spread out from the mean
how do we determine statistical power?
power:
desired levels can be determined in planning stages
alpha level:
best level needs to be determined considering impact on type 1 and type 2 error
number of subjects:
larger the sample, the greater the statistical power
effect size:
degree to which the null is false
paired t test:
- how is it reported?
- what is the nonparametric alternative?
reported as t statistic:
t[df]= t statistic, p=p value, CI95 [lower, upper]
nonparametric alternative:
WILCOXON TEST
![<p>reported as t statistic: </p><p>t[df]= t statistic, p=p value, CI95 [lower, upper] </p><p>nonparametric alternative: </p><p>WILCOXON TEST </p>](https://knowt-user-attachments.s3.amazonaws.com/c5f91a1c-a936-4ff1-bda0-53dac262fc49.jpg)
independent t test:
- assumptions include?
- reported as?
- nonparametric alternative?
assumptions include equality of variances:
LEVENES TEST!
reported as t statistic
nonparametric alternative:
MANN WHITNEY U TEST
a test used to assess the assumption of equality of variance?
levene's test!
ANOVA:
- reported as?
- non parametric alternative?
- effect size for anova intepretation:
based on F statistic
non parametric:
KRUSKAL WALLIS TEST
effect size- eta squared n^2
small: .01
medium: .06
large: .14
CORRELATION INTERPRETATION:
<- 0.25 little or no relationship
.25 to .50 low to fair
.50 to .75 moderate to good
>-.75 strong!
correlation nonparametric options
spearmann rank correlation coefficient
kendalls tau-b